. 2015 Dec 16;23(2):168-80.
doi: 10.1128/CVI.00637-15. Print 2016 Feb.

Interleukin-17A as a Biomarker for Bovine Tuberculosis

Affiliations

Interleukin-17A as a Biomarker for Bovine Tuberculosis

W Ray Waters et al. Clin Vaccine Immunol. .

Abstract

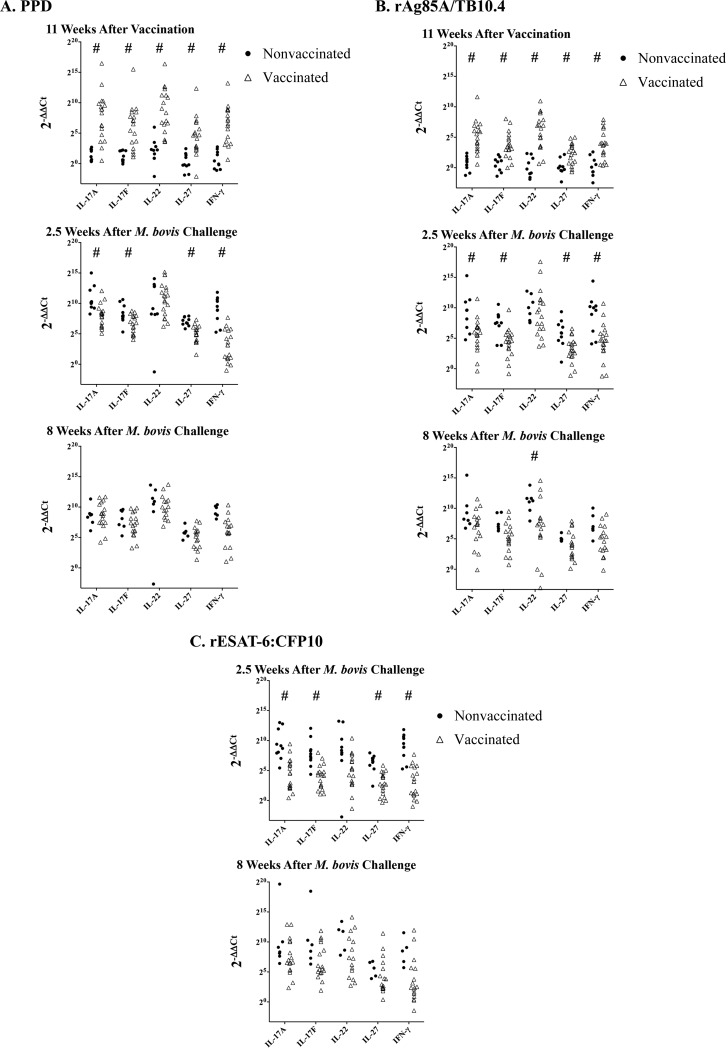
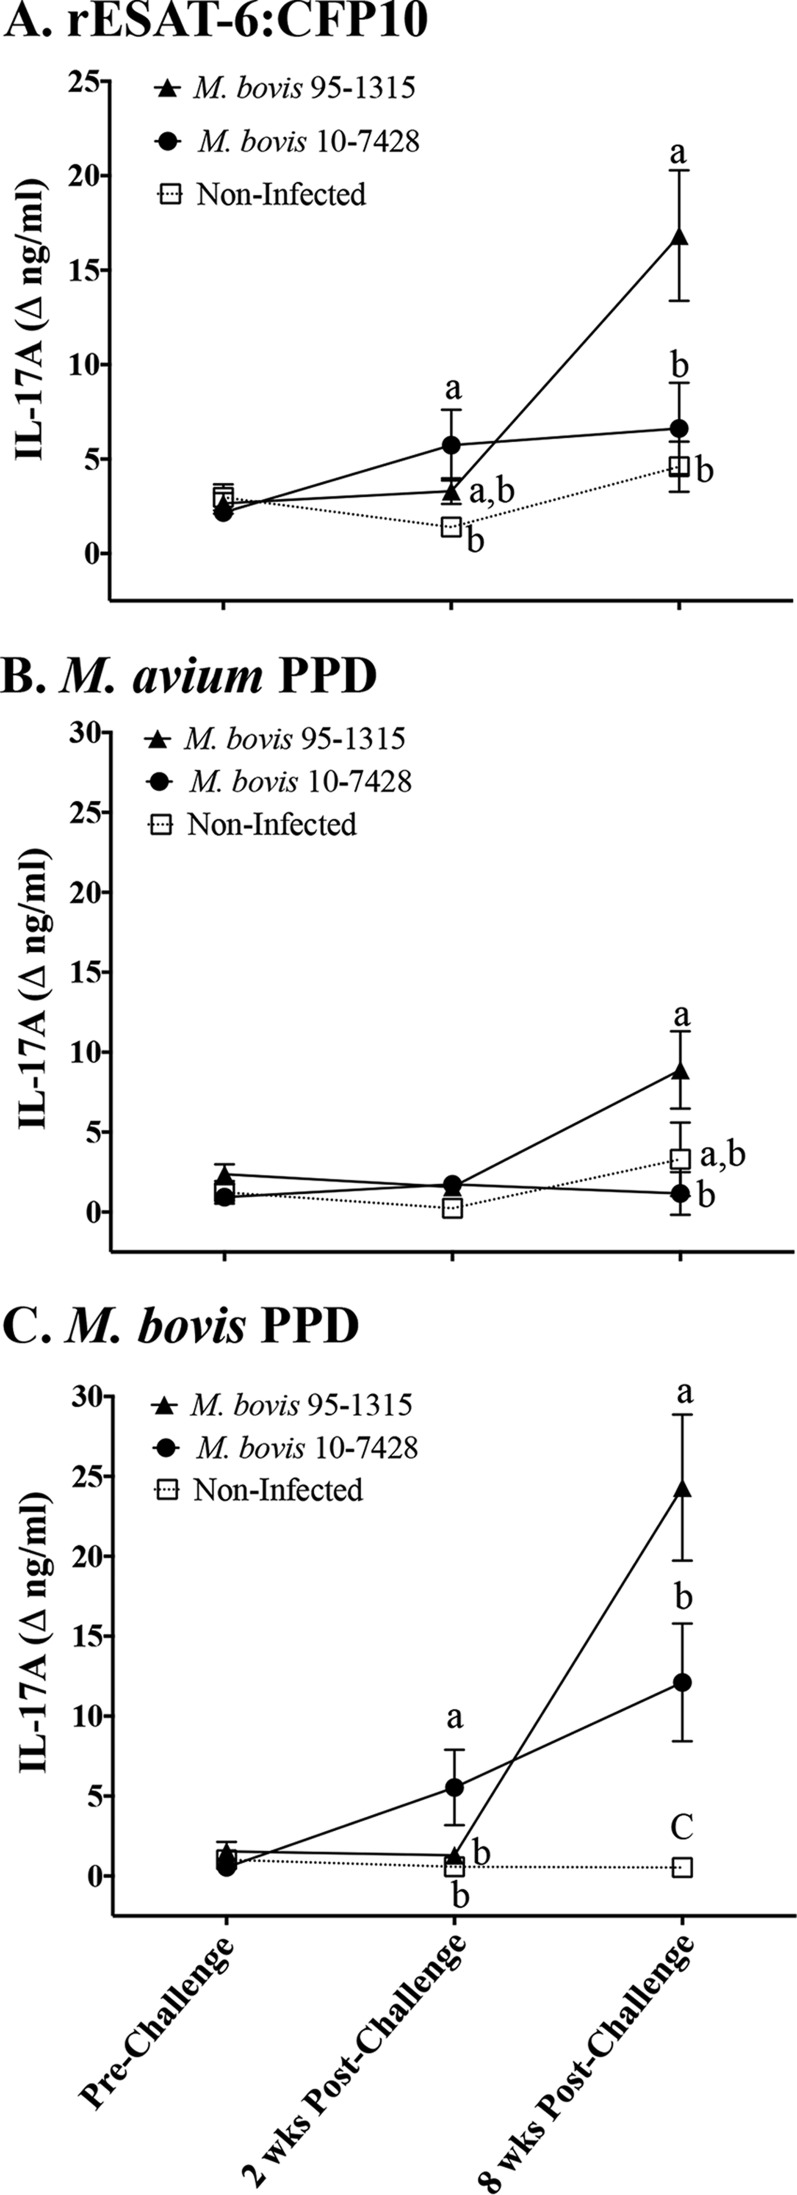
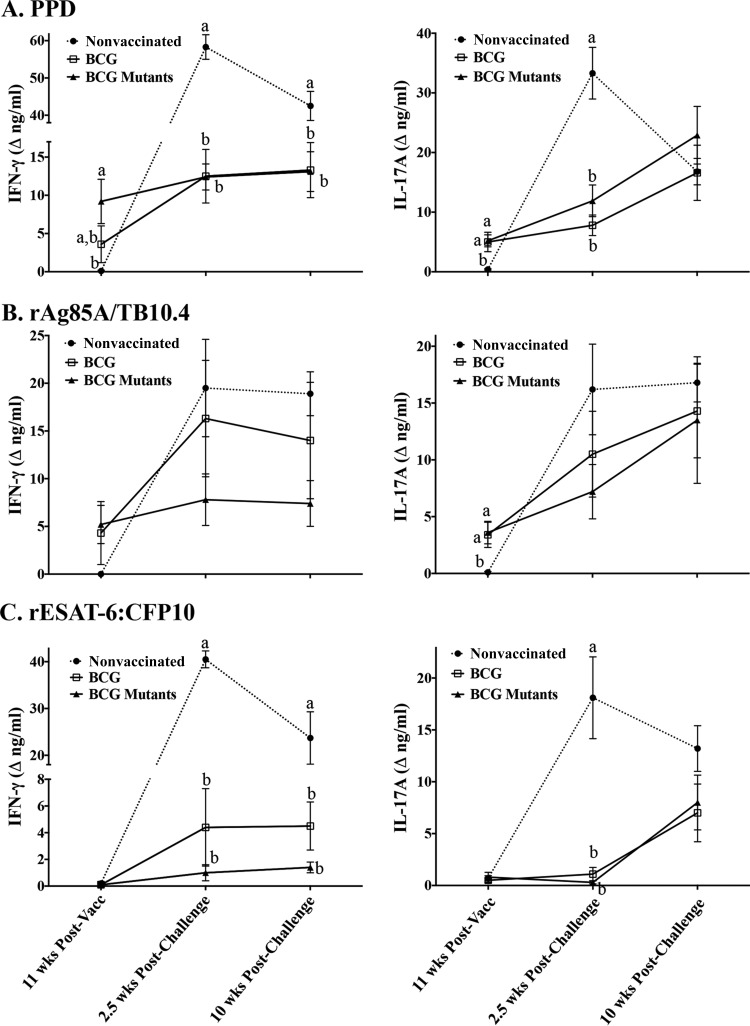
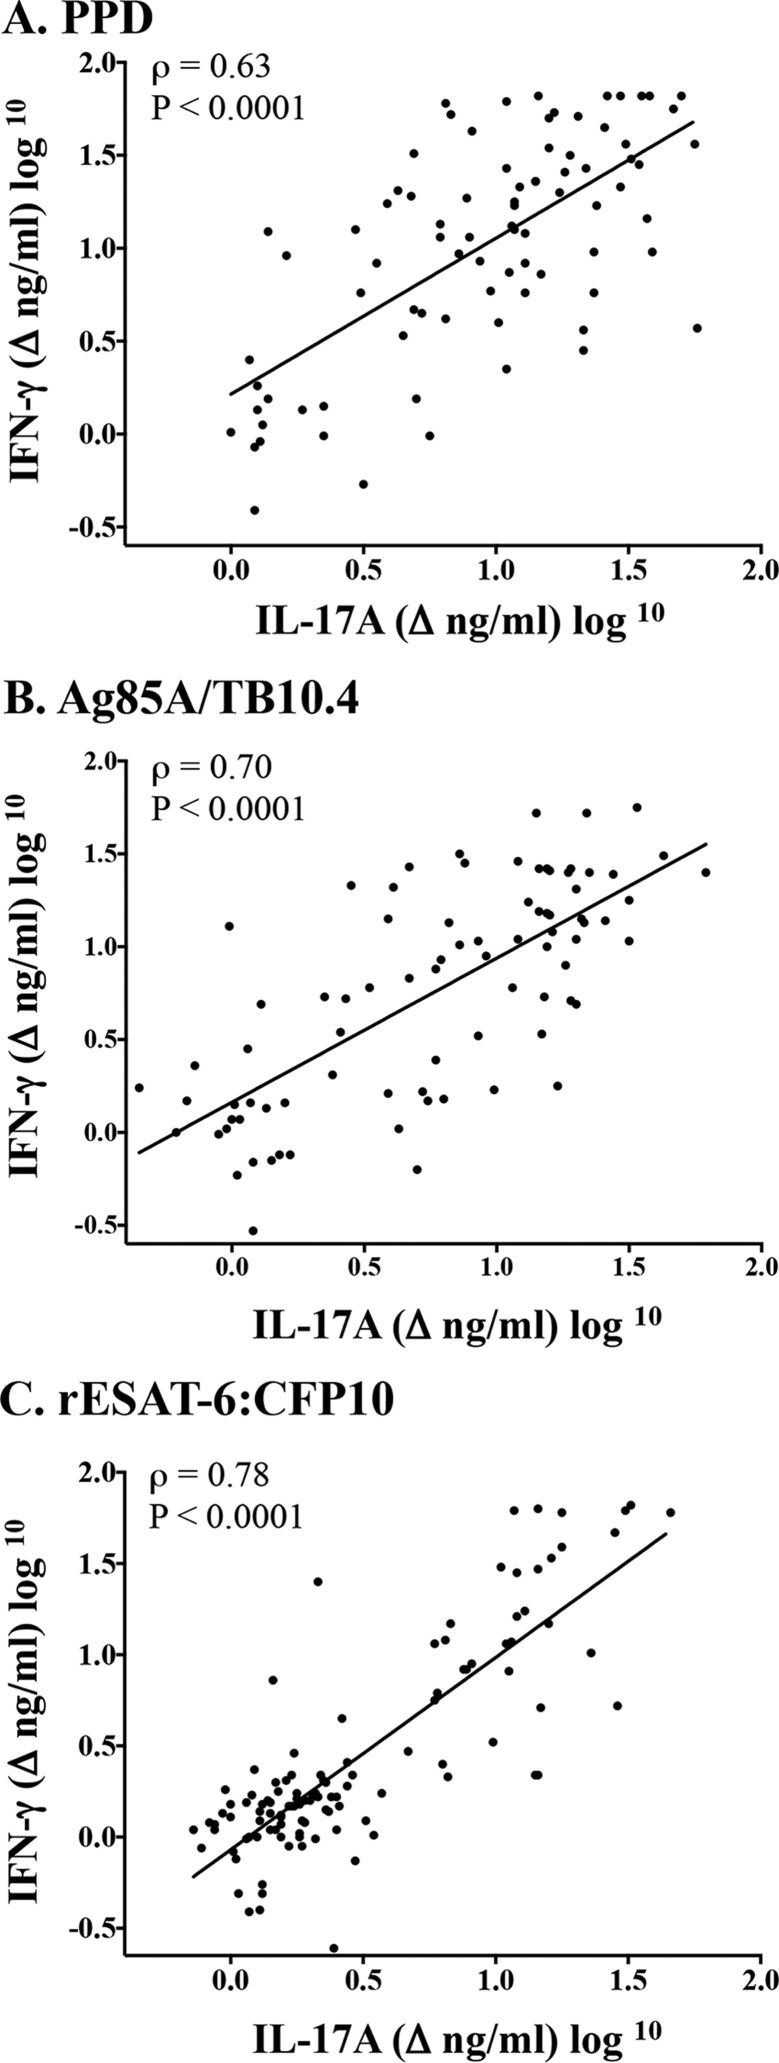
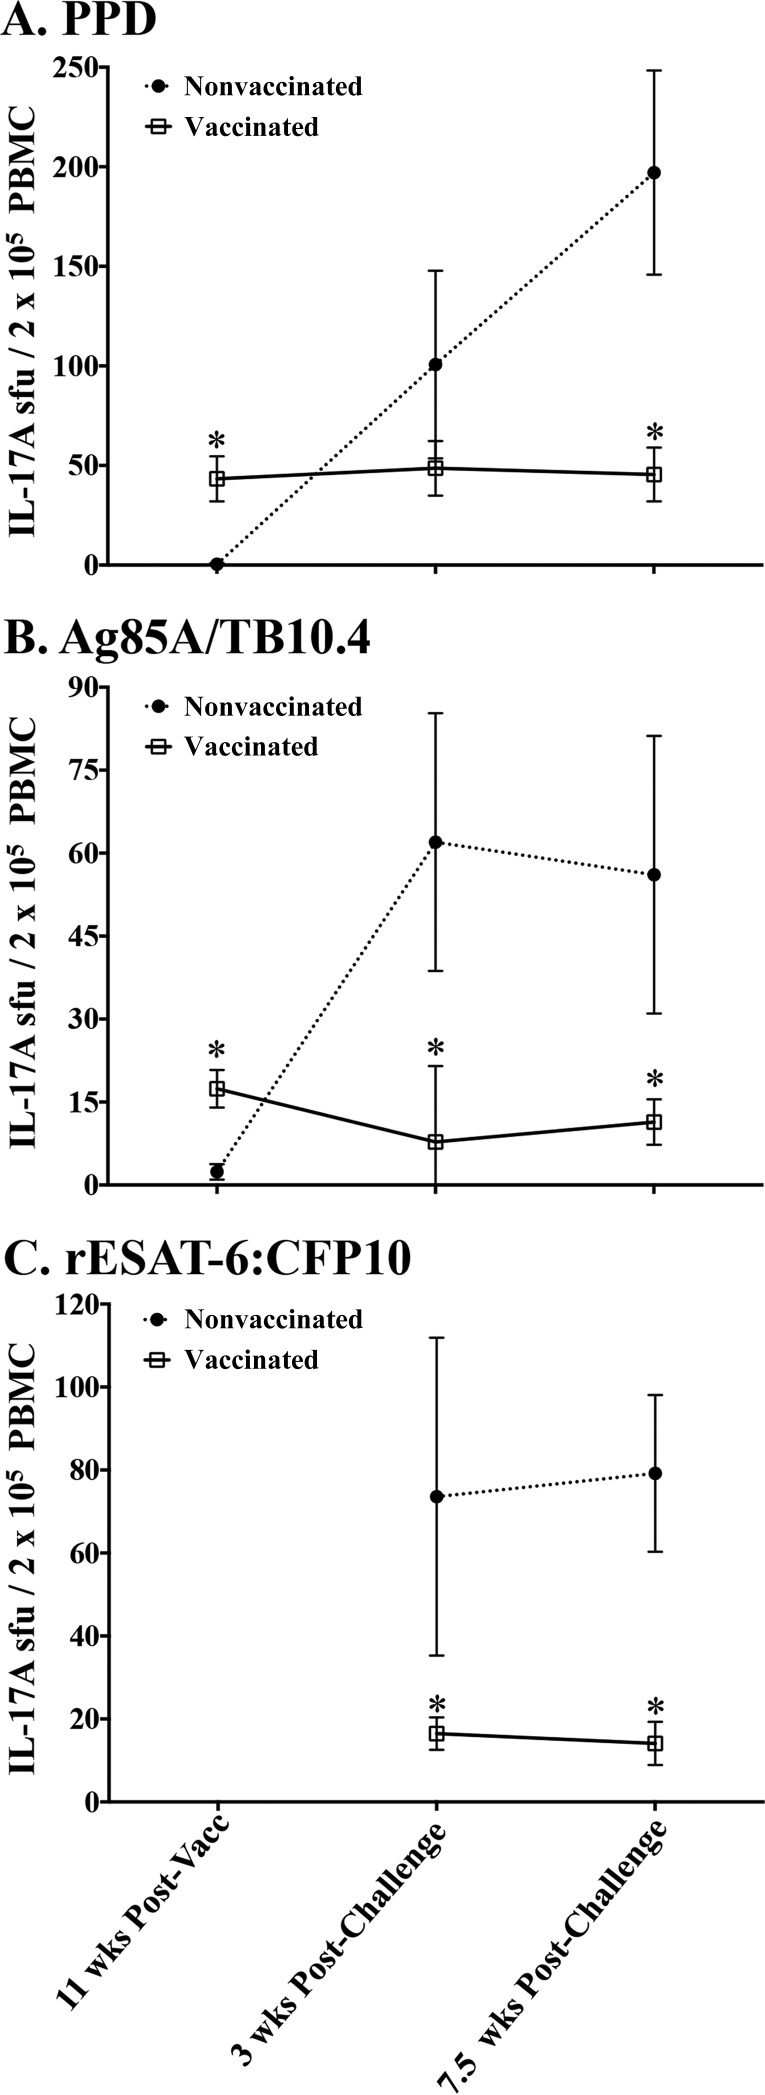
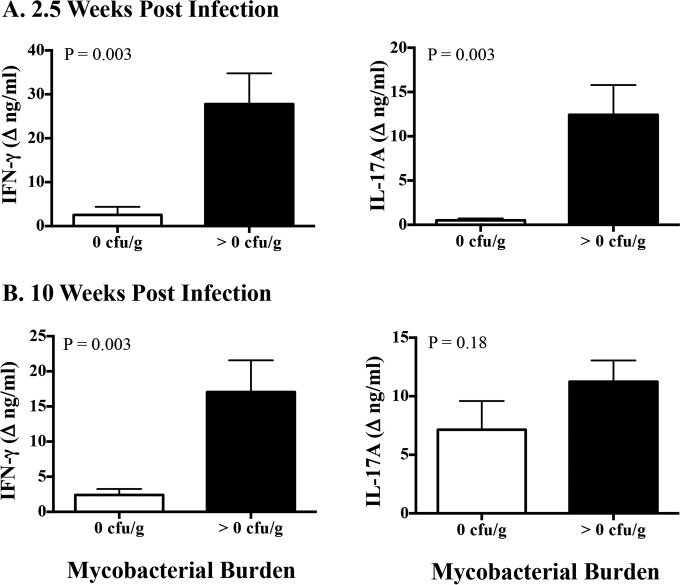
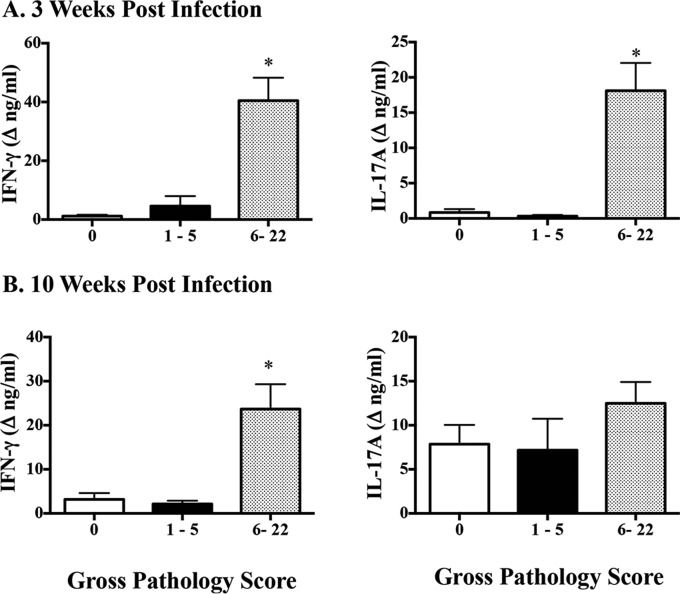
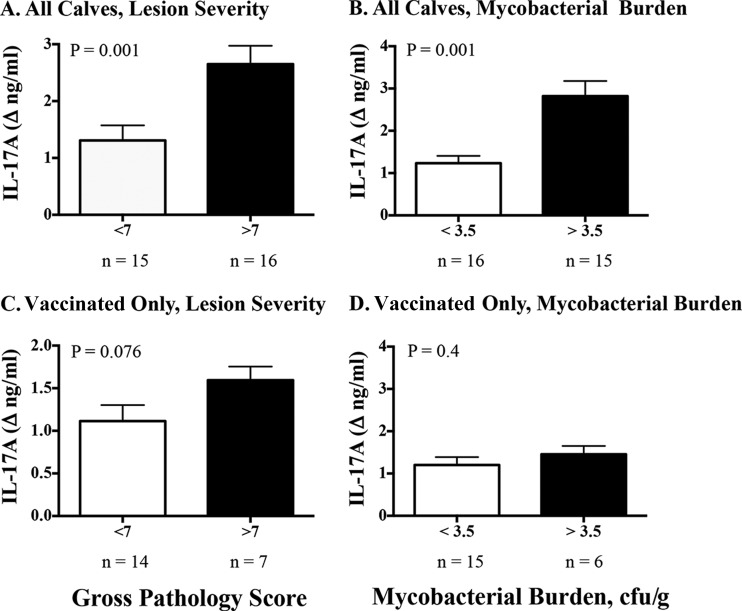
T helper 17 (Th17)-associated cytokines are integral to the immune responses to tuberculosis, initiating both protective and harmful inflammatory responses. The aim of the present study was to evaluate applied aspects of interleukin-17 (IL-17) biology in the context of Mycobacterium bovis infection of cattle. Using transcriptome sequencing (RNA-Seq), numerous Th17-associated cytokine genes (including IL-17A, IL-17F, IL-22, IL-19, and IL-27) were upregulated >9-fold in response to purified protein derivative stimulation of peripheral blood mononuclear cells from experimentally M. bovis-infected cattle. Protective vaccines elicited IL-17A, IL-17F, IL-22, and IL-27 responses. Reduced IL-17A responses by vaccine recipients, compared to nonvaccinated animals, at 2.5 weeks after M. bovis challenge correlated with reduced disease burdens. Additionally, IL-17A and interferon gamma (IFN-γ) responses were highly correlated and exhibited similar diagnostic capacities. The present findings support the use of Th17-associated cytokines as biomarkers of infection and protection in the immune responses to bovine tuberculosis.


Figures

FIG 1
FIG 1
Antigen-specific gene expression of Th17-associated cytokines in response to vaccination and subsequent challenge with virulent M. bovis. Relative gene expression levels were calculated using the 2−ΔΔCT method, using nonstimulated cells as the calibrator and eukaryotic 18S rRNA as the endogenous control. Data are presented as individual animal responses to PPD (A), rAg85A-rTB10.4 (B), or rESAT-6:CFP10 (C) in nonvaccinated animals and vaccinated animals, at the indicated time points. Responses did not differ (P > 0.05) between animals vaccinated with BCG mutants versus BCG; thus, these two groups were pooled as vaccinated. #, responses differ between nonvaccinated animals and vaccinated animals for the respective cytokine (P < 0.05, Student's t test, using ΔΔCT values for comparisons).
FIG 2
FIG 2
IL-17A responses (protein) to M. bovis infection of cattle. Treatment groups included noninfected (n = 7), strain 95-1315-infected (white-tailed deer M. bovis isolate; n = 8), and strain 10-7428-infected (Holstein M. bovis isolate; n = 8) calves, with the experimental design described in Table 1. Whole blood was collected into heparinized tubes and stimulated with 1 μg/ml rESAT-6:CFP10 (A), 20 μg/ml M. avium PPD (Lelystad; Prionics Ag) (B), 20 μg/ml M. bovis PPD (Lelystad; Prionics Ag) (C), or medium alone (no stimulation) for 16 h at 39°C. Plasma was harvested for IL-17A analysis by ELISA (bovine IL-17A ELISA VetSet; Kingfisher Biotech). Data (mean ± SEM) are presented as the change in nanograms per milliliter (i.e., antigen stimulation minus medium alone) for each treatment group at the indicated time points relative to challenge. a to c, different letters indicate that responses differ for the given time point (P < 0.05, ANOVA followed by Tukey's multiple-comparison test).
FIG 3
FIG 3
IFN-γ and IL-17A responses to vaccination and subsequent challenge with virulent M. bovis. Treatment groups included nonvaccinated animals (n = 10), BCG-vaccinated animals (n = 9), and animals vaccinated with BCG mutants (i.e., BCG Δfdr8, BCG ΔleuCD Δpks16, BCG ΔmetA, and BCG ΔmmaA4) (n = 10). The virulent M. bovis strain 10-7428 was administered by aerosol to all calves 3.5 months after vaccination, and calves were euthanized 4.5 months after challenge (Table 1). Whole blood was collected into heparinized tubes and stimulated with 20 μg/ml M. bovis PPD (Lelystad; Prionics Ag) (A), 1 μg/ml rAg85A-rTB10.4 (B), 1 μg/ml rESAT-6:CFP10 (C), or medium alone (no stimulation) for 16 h at 39°C. Plasma was harvested for IFN-γ (left) and IL-17A (right) analyses using commercial ELISA kits (Bovigam [Prionics Ag] and bovine IL-17A ELISA VetSet [Kingfisher Biotech]). Data (mean ± SEM) are presented as the change in nanograms per milliliter (i.e., antigen stimulation minus medium alone) for each treatment group at the indicated time points relative to vaccination (Vacc) or challenge. a to c, different letters indicate that responses differ for the given time point (P < 0.05, ANOVA followed by Tukey's multiple-comparison test).
FIG 4
FIG 4
Correlation of IL-17A and IFN-γ responses. Treatment groups included nonvaccinated animals (n = 10), BCG-vaccinated animals (n = 9), and animals vaccinated with BCG mutants (i.e., BCG Δfdr8, BCG ΔleuCD Δpks16, BCG ΔmetA, and BCG ΔmmaA4) (n = 10). Virulent M. bovis strain 10-7428 was administered by aerosol to all calves 3.5 months after vaccination, and calves were euthanized 4.5 months after challenge (Table 1). Whole blood was collected into heparinized tubes from all calves 11 weeks after vaccination, 2.5 weeks after M. bovis challenge, and 10 weeks after M. bovis challenge and were stimulated with 20 μg/ml M. bovis PPD (Lelystad; Prionics Ag) (A), 1 μg/ml rAg85A-rTB10.4 (B), 1 μg/ml rESAT-6:CFP10 (C), or medium alone (no stimulation) for 16 h at 39°C, and plasma was harvested for IFN-γ and IL-17A analyses using ELISA kits (Bovigam [Prionics Ag] and bovine IL-17A ELISA VetSet [Kingfisher Biotech]). Data represent the changes in nanograms per milliliter (log10) (i.e., antigen stimulation minus medium alone) for IFN-γ versus IL-17A responses for each individual animal at each time point (n = 87). Prior to analysis and graphing, data were transformed for positive skewness with zero values using the following formula: new x = log10(x + 1).
FIG 5
FIG 5
Dampening of IL-17A responses (ELISPOT assay) to M. bovis infection with prior BCG vaccination. Treatment groups included nonvaccinated animals (n = 10) and vaccinated animals (n = 19). The vaccinated group consisted of animals vaccinated with BCG (n = 9) or BCG mutants (i.e., BCG Δfdr8, BCG ΔleuCD Δpks16, BCG ΔmetA, and BCG ΔmmaA4; n = 10). Virulent M. bovis strain 10-7428 was administered by aerosol to all calves 3.5 months after vaccination, and calves were euthanized 4.5 months after M. bovis challenge (Table 1). For IL-17A ELISPOT analysis, PBMCs (2 × 10⁵ PBMCs/well) were stimulated with 10 μg/ml M. bovis PPD (A), 3 μg/ml rAg85A-rTB10.4 (B), or 3 μg/ml rESAT-6:CFP10 (C) for 18 h prior to spot development and counting, as described in Materials and Methods. Results (mean ± SEM) are expressed as spot-forming units (sfu) per 2 × 10⁵ cells for each treatment group at the indicated time points relative to vaccination (Vacc) or challenge. *, response differs from that for nonvaccinated animals at that time point (P < 0.05, as determined by ANOVA followed by Tukey's multiple-comparison test).
FIG 6
FIG 6
Association of ESAT-6:CFP10-specific IFN-γ and IL-17A responses with mycobacterial burdens in the 2014 vaccine efficacy study. Treatment groups included nonvaccinated animals, BCG-vaccinated animals, and animals vaccinated with BCG mutants (i.e., BCG Δfdr8, BCG ΔleuCD Δpks16, BCG ΔmetA, and BCG ΔmmaA4). Virulent M. bovis strain 10-7428 was administered by aerosol to all calves 3.5 months after vaccination, and calves were euthanized 4.5 months after M. bovis challenge (Table 1). Whole blood from all calves was collected into heparinized tubes at 2.5 and 10 weeks after challenge and stimulated with 1 μg/ml rESAT-6:CFP10 or medium alone (no stimulation) for 16 h at 39°C, and plasma was harvested for IFN-γ and IL-17A analyses using commercial ELISA kits (Bovigam [Prionics Ag] and bovine IL-17A ELISA VetSet [Kingfisher Biotech]). Mycobacterial burdens were determined by serial dilution culture of entire tracheobronchial lymph node homogenates and are presented as culture-forming units per gram of tissue. Groups were split based on mycobacterial burdens of 0 CFU/g (n = 14) or >0 CFU/g (n = 15). All 14 animals in the 0-CFU/g group were vaccinated animals. In the >0-CFU/g group, 5/15 animals were vaccinated animals and 10/15 were nonvaccinated animals. Data (mean ± SEM) are presented as IFN-γ (left) and IL-17A (right) responses (changes in nanograms per milliliter, i.e., antigen stimulation minus medium alone) to rESAT-6:CFP10 at 3 weeks after M. bovis challenge (A) and 10 weeks after M. bovis challenge (B), as related to mycobacterial burdens determined at necropsy 4.5 months after challenge. Similar results were obtained for responses to M. bovis PPD (data not shown). Student's t test P values are provided in the upper left corner of each graph.
FIG 7
FIG 7
Association of ESAT-6:CFP10-specific IFN-γ and IL-17A responses with lesion severity (i.e., gross pathology scores) in the 2014 vaccine efficacy study. Treatment groups included nonvaccinated animals, BCG-vaccinated animals, and animals vaccinated with BCG mutants (i.e., BCG Δfdr8, BCG ΔleuCD Δpks16, BCG ΔmetA, and BCG ΔmmaA4). Virulent M. bovis strain 10-7428 was administered by aerosol to all calves 3.5 months after vaccination, and calves were euthanized 4.5 months after M. bovis challenge (Table 1). Whole blood from all calves was collected into heparinized tubes at 2.5 and 10 weeks after challenge and stimulated with 1 μg/ml rESAT-6:CFP10 or medium alone (no stimulation) for 16 h at 39°C, and plasma was harvested for IFN-γ and IL-17A analyses using ELISA kits (Bovigam [Prionics Ag] and bovine IL-17A ELISA VetSet [Kingfisher Biotech]). The lesion severity for lungs and lymph nodes (i.e., mediastinal and tracheobronchial lymph nodes) was determined using a semiquantitative scoring system adapted from that described by Vordermeier et al. (24). Groups were split based on gross pathology scores of 0 (n = 12; all vaccinated animals), 1 to 5 (n = 7; all vaccinated animals), or 6 to 22 (n = 10; all nonvaccinated animals). Data (mean ± SEM) are presented as IFN-γ (left) and IL-17A (right) responses (changes in nanograms per milliliter, i.e., antigen stimulation minus medium alone) to rESAT-6:CFP10 at 3 weeks after M. bovis challenge (A) and 10 weeks after M. bovis challenge (B), as related to gross pathology scores determined at necropsy 4.5 months after challenge. Similar results were obtained for responses to M. bovis PPD (data not shown). *, response differs from the other responses in the graph (P < 0.05, ANOVA followed by Tukey's multiple-comparison test).
FIG 8
FIG 8
Correlation of ESAT-6:CFP10-specific IL-17A responses at 8 weeks after M. bovis challenge with lesion severity and mycobacterial burden in the 2007 vaccine efficacy study. Treatment groups included nonvaccinated, BCG-vaccinated, and M. bovis ΔRD1-vaccinated animals. Virulent M. bovis strain 95-1315 was administered by aerosol to all calves 3 months after vaccination, and calves were euthanized 4.5 months after M. bovis challenge (Table 1). Eight weeks after M. bovis challenge, PBMCs (2 × 10⁵ PBMCs/well) were stimulated with 1 μg/ml rESAT-6:CFP10 or medium alone at 39°C for 16 h, and supernatants were harvested for IL-17A analysis by ELISA (bovine IL-17A ELISA VetSet; Kingfisher Biotech). For evaluation of gross pathology, lungs and lymph nodes (mediastinal and tracheobronchial) were evaluated using a semiquantitative scoring system (24). Mycobacterial burdens were determined by culture of a series of dilutions of entire tracheobronchial lymph node homogenates and are presented as CFU per gram of tissue (26). Data (mean ± SEM) are presented as changes in nanograms per milliliter (i.e., antigen stimulation minus medium alone) for each treatment group based on gross pathology scores (A and C) or mycobacterial burdens (B and D). Student's t test P values are provided in the upper left corner of each graph.

Similar articles

Cited by

References

    1. Smith NH, Hewinson RG, Kremer K, Brosch R, Gordon SV. 2009. Myths and misconceptions: the origin and evolution of Mycobacterium tuberculosis. Nat Rev Microbiol 7:537–544. doi:10.1038/nrmicro2165. - DOI - PubMed
    1. Müller B, Dürr S, Alonso S, Hattendorf J, Laisse CJ, Parsons SD, van Helden PD, Zinsstag J. 2013. Zoonotic Mycobacterium bovis-induced tuberculosis in humans. Emerg Infect Dis 19:899–908. doi:10.3201/eid1906.120543. - DOI - PMC - PubMed
    1. Palmer MV. 2013. Mycobacterium bovis: characteristics of wildlife reservoir hosts. Transbound Emerg Dis 60(Suppl 1):S1–S13. - PubMed
    1. Schiller I, Oesch B, Vordermeier HM, Palmer MV, Harris BN, Orloski KA, Buddle BM, Thacker TC, Lyashchenko KP, Waters WR. 2010. Bovine tuberculosis: a review of current and emerging diagnostic techniques in view of their relevance for disease control and eradication. Transbound Emerg Dis 57:205–220. - PubMed
    1. Walzl G, Ronacher K, Hanekom W, Scriba TJ, Zumla A. 2011. Immunological biomarkers of tuberculosis. Nat Rev Immunol 11:343–354. doi:10.1038/nri2960. - DOI - PubMed

Publication types

MeSH terms

LinkOut - more resources