. 2016 Feb 26;291(9):4698-710.
doi: 10.1074/jbc.M115.698985. Epub 2015 Dec 16.

Phototransduction Influences Metabolic Flux and Nucleotide Metabolism in Mouse Retina

Affiliations

Phototransduction Influences Metabolic Flux and Nucleotide Metabolism in Mouse Retina

Jianhai Du et al. J Biol Chem. .

Abstract

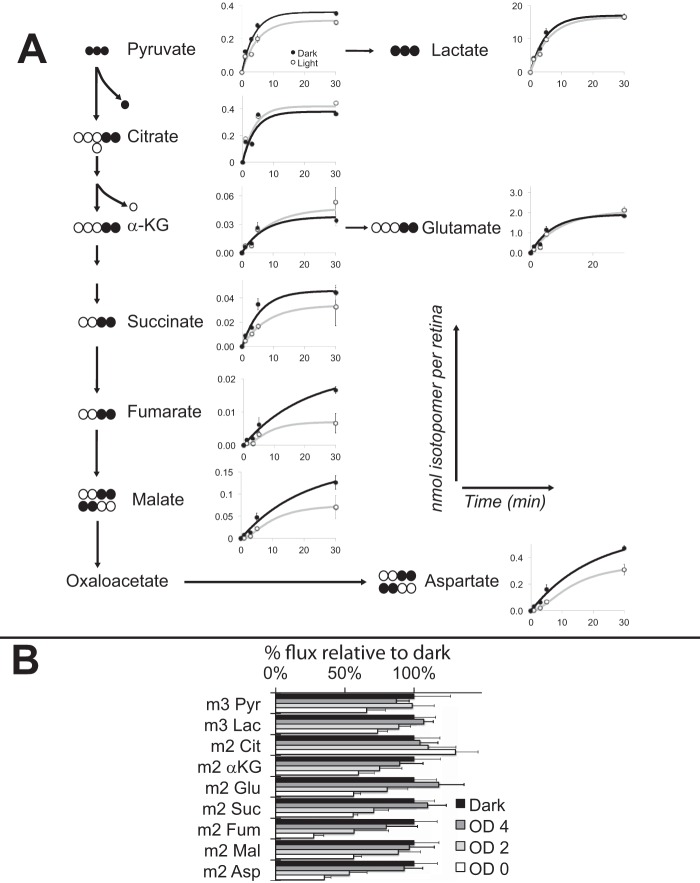
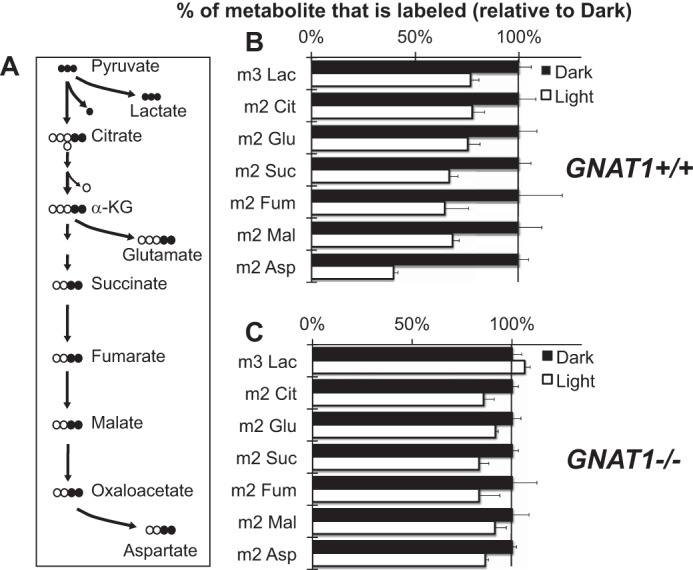
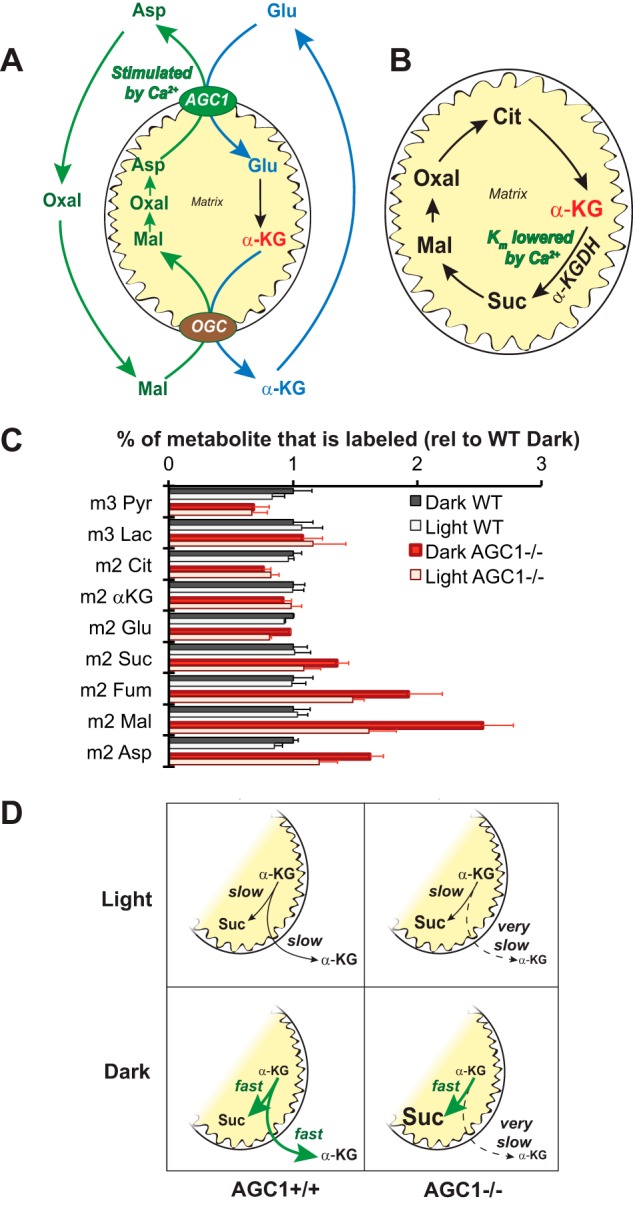
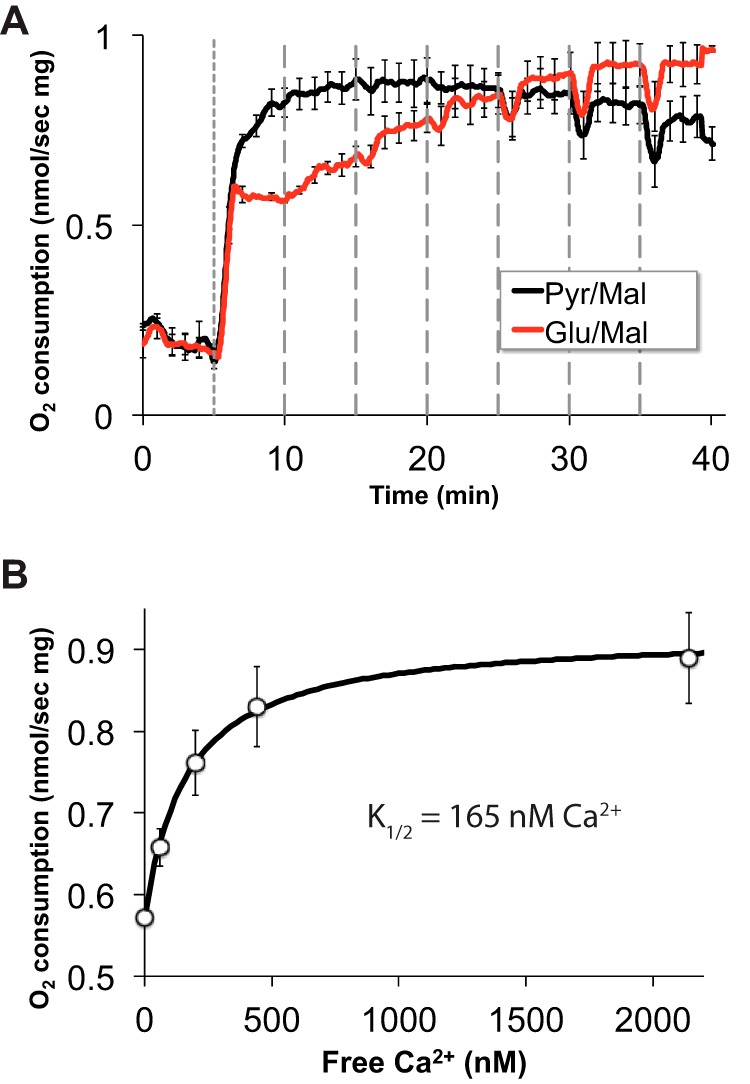
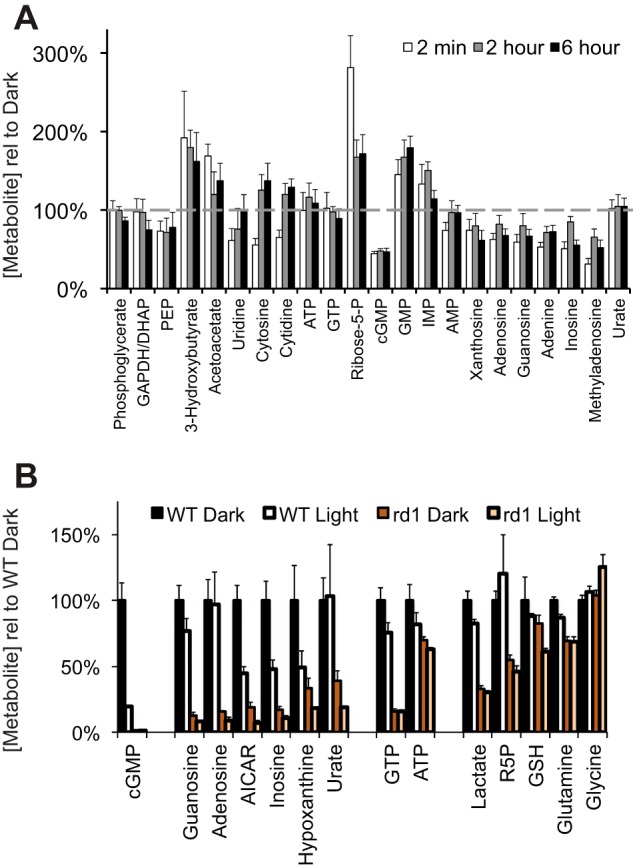
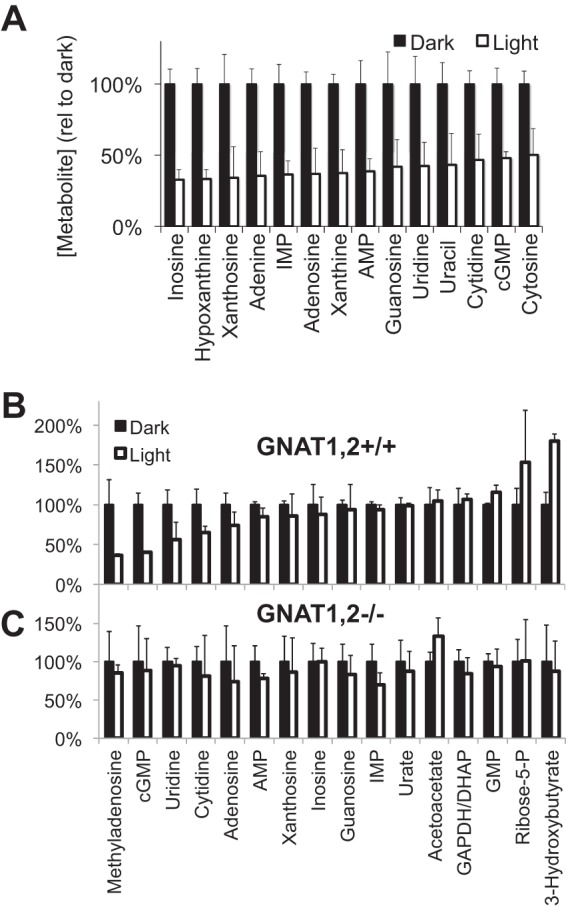
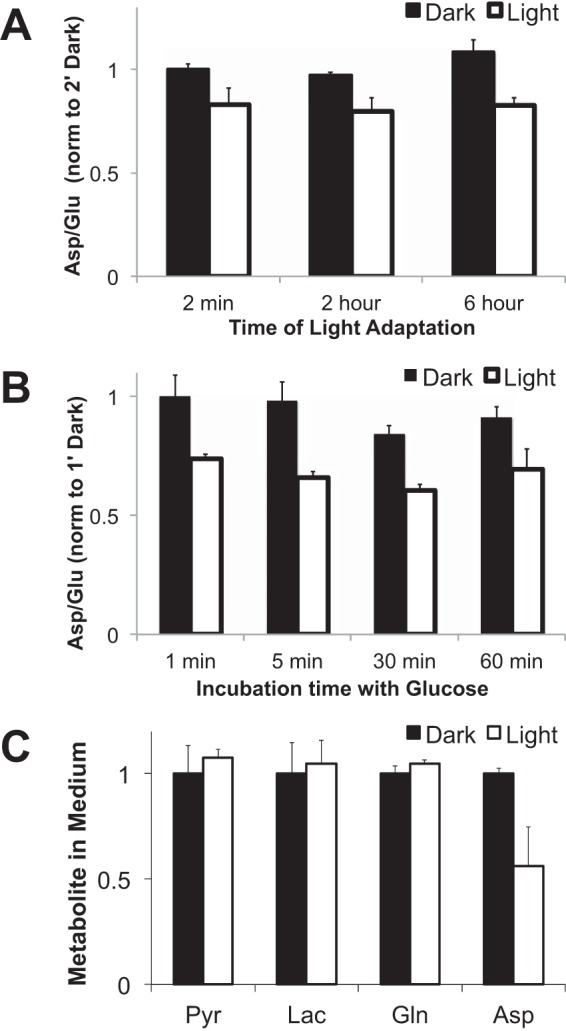
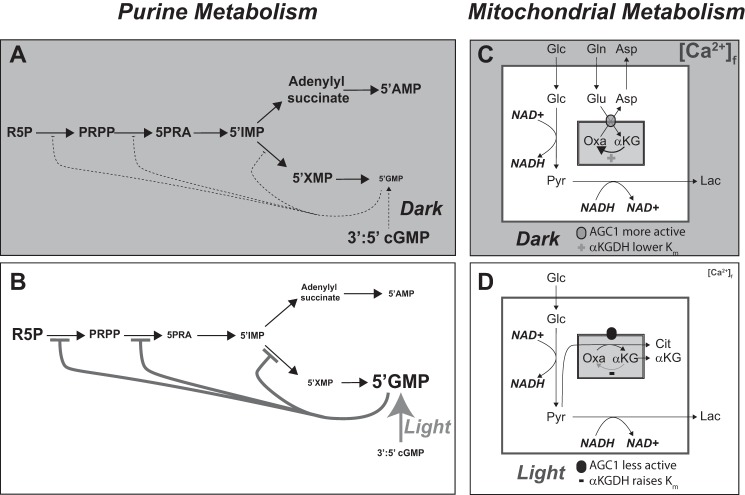
Production of energy in a cell must keep pace with demand. Photoreceptors use ATP to maintain ion gradients in darkness, whereas in light they use it to support phototransduction. Matching production with consumption can be accomplished by coupling production directly to consumption. Alternatively, production can be set by a signal that anticipates demand. In this report we investigate the hypothesis that signaling through phototransduction controls production of energy in mouse retinas. We found that respiration in mouse retinas is not coupled tightly to ATP consumption. By analyzing metabolic flux in mouse retinas, we also found that phototransduction slows metabolic flux through glycolysis and through intermediates of the citric acid cycle. We also evaluated the relative contributions of regulation of the activities of α-ketoglutarate dehydrogenase and the aspartate-glutamate carrier 1. In addition, a comprehensive analysis of the retinal metabolome showed that phototransduction also influences steady-state concentrations of 5'-GMP, ribose-5-phosphate, ketone bodies, and purines.

Keywords: anaerobic metabolism; calcium; mitochondria; photoreceptor; phototransduction; retina.


Figures

FIGURE 1.
FIGURE 1.
Respiration in retinas operated closer to maximum capacity, and it was more uncoupled from ATP synthesis than in other tissues. O2 consumption by isolated mouse tissue was measured with a perifusion apparatus (described under “Experimental Procedures”). Vertical dashed lines indicate transitions between media with different components. After O2 consumption stabilized, increasing concentrations of oligomycin were used to inhibit the mitochondrial ATP synthase. FCCP then was added to uncouple respiration from ATP synthesis. Each trace represents an average. Error bars represent S.E. Data are normalized to the initial O2 consumption rate for each experiment. A, O2 consumption by light-adapted mouse retinas (n = 4). The maximum OCR (after adding FCCP) for light-adapted mouse retina averaged from all the analyses done for this report was 0.40 ± 0.13 (S.D.) nmol of O2/min/mg wet weight of retina (n = 11). B, O2 consumption by cerebellum slices (n = 3). Maximum OCR for cerebellum slices was 0.44 ± 0.08 nmol of O2/min/mg (n = 2). C, O2 consumption by pancreatic islets (n = 2, error bars report range). Maximum OCR for islets was 2.1 ± 0.4 nmol of O2/min/mg (n = 2). D, comparison of effects of oligomycin and ouabain on OCR by light-adapted mouse retinas. Neither oligomycin (left, n = 3) nor ouabain (right, n = 4) inhibited retinal O2 consumption by greater than ∼40%. The star indicates that the probability is 0.04 that the inhibition caused by ouabain could be the same or greater than the inhibition caused by oligomycin.
FIGURE 2.
FIGURE 2.
Uncoupled respiration occurred only when mature photoreceptors were present. A, O2 consumption by isolated light-adapted mouse retinas collected from postnatal days 11, 12, and 16 (n = 2 for day 12, n = 1 for day 11, and 16 and n = 5 for adult). * indicates p = 0.022, and ** indicates p = 0.001. Retinas were treated with 50 μm oligomycin and then oligomycin plus 1 μm FCCP. These results show how the nearly equal respiration rates with versus without FCCP and the large fraction of respiration that is oligomycin-insensitive become apparent only as the rod photoreceptors become functional between postnatal days 11 to 16. The absolute maximal (FCCP stimulated) OCRs for postnatal day 11 and 12 retinas was 1.71 ± 0.21 (S.D.) nmol/min/retina (n = 3), and for adult retinas it was 1.16 ± 0.38 (S.D.) nmol of O2/min retina. p = 0.014 for the hypothesis that the 11–12-day and adult OCRs are the same. B, comparison of the effects of oligomycin and FCCP on O2 consumption by adult WT retinas (n = 5) and adult AIPL1−/− retinas (n = 4). * indicates p = 0.031, and ** indicates p = 0.001. The absolute maximal (FCCP stimulated) OCR for AIPL1−/− retinas was 1.18 ± 0.16 nmol of O2/min/retina (corresponding to 0.58 nmol/min/mg wet weight of retina).
FIGURE 3.
FIGURE 3.
Oligomycin-insensitive respiration in retinas began in complex I. A, malonate, a complex II inhibitor, does not block the oligomycin-insensitive respiration by mouse retinas. Malonate is an inhibitor of succinate dehydrogenase activity of complex II. This figure shows that it does not inhibit the oligomycin-insensitive respiration. O2 consumption by isolated light-adapted mouse retinas was measured in the presence of 5 mm glucose. Sequential additions of 30 μm oligomycin, + 5 mm malonate, then 10 mm malonate, and then 20 mm malonate were followed by the addition of 1 mg/ml antimycin A and then KCN. n = 2; error bars show the range). B, rotenone, a complex I inhibitor, blocks the oligomycin-insensitive respiration by mouse retinas. Rotenone is an inhibitor of complex I. This figure shows that it does inhibit the oligomycin-insensitive respiration. O2 consumption by isolated light-adapted mouse retinas was measured in the presence of 5 mm glucose. Sequential additions of 30 μm oligomycin and 1 μm rotenone were followed by the addition of 1 mg/ml antimycin A and then KCN. n = 2; error bars show the range.
FIGURE 4.
FIGURE 4.
Inhibition of O2 consumption by light required phototransduction. Retinas were isolated from dark-adapted mice, and their O2 consumption was measured in the dark. The retinas then were illuminated and exposed to oligomycin and FCCP. The inhibitory effect of light did not occur in GNAT1−/− retinas deficient in rod transducin. A, O2 consumption from GNAT1+/+ retinas. Maximal OCR for GNAT1+/+ retinas was 1.16 ± 0.38 (S.D.) nmol of O2/min retina (n = 11). B, O2 consumption from GNAT1−/− retinas. Maximal OCR for the GNAT1−/− retinas was 0.93 ± 0.23 (S.D.) nmol of O2/min retina (n = 3). The effect of light is significant. At 45 min the GNAT1+/+ OCR was 95% ± 2% of the OCR at time 0, whereas the GNAT−/− OCR was 104% ± 1% of the OCR at time 0. The difference between light and dark OCR is significant (p = 0.007). As can be seen from the error bars, the gradual upward baseline drift occurred consistently throughout each of the six experiments in this set of experiments.
FIGURE 5.
FIGURE 5.
Illumination inhibited the flow of carbons from glucose through glycolysis and mitochondrial metabolites. A, dark-adapted mouse retinas were isolated and cultured either in darkness or in light in media with [U-13C]glucose. At specified times after the addition of labeled glucose retinas were extracted. Metabolites and their isotopomers were quantified by GC-MS. The schematic outlines metabolic pathways, and the isotopomers that were evaluated. The graphs report nmol of each isotopomer per retina at 1, 3, 5, and 30 min (n = 2–4). Error bars represent S.D. The apparent initial rates used to fit the data in these graphs are (in nmol/min) pyruvate (Pyr; l) 0.062 (d) 0.09; lactate (Lac; l) 2.75, (d) 3.4; citrate (Cit; l) 0.11, (d) 0.10; α-KG (l) 0.005, (d) 0.005; Glu (l) 0.21, (d) 0.27; succinate (Suc; (l) 0.004, (d) 0.008; fumarate (Fum; l) .00017, (d) 0.00053; malate (Mal; l) 0.00027, (d) 0.004; Asp (l) 0.012, (d) 0.043. B, sensitivity of the effect of light on retinal metabolism. Retinas were isolated in the dark and either kept in the dark or exposed to white light for 30 s. Illumination was attenuated by neutral density filters. The energy from the unattenuated light source (OD 0) was equivalent to that of the 200 lux illumination in other experiments described in this report. After the 30-s exposure, retinas were transferred to medium in which 5 mm unlabeled glucose was replaced by 5 mm [U-13C]glucose. The incubation then was continued under the same illumination conditions for three more minutes before harvesting the retinas and extracting metabolites for GC-MS analysis. The effects of light on total metabolite levels are reported in supplemental Fig. S1A.
FIGURE 6.
FIGURE 6.
Phototransduction was required for the effect of light on metabolic flux. A, the schematic shows the metabolic pathways and isotopomers that were evaluated. Dark-adapted mouse retinas were isolated and cultured either in the dark or in light with [U-13C]glucose as in Fig. 5. B, metabolites were extracted after 5 min and quantified (n = 6–8, error bars report S.E.). Lac, lactate; Cit, citrate; Suc, succinate; Fum, fumarate; Mal, malate. C, the effect of light on metabolic flux is suppressed when a deficiency in GNAT1 blocks phototransduction in rods (n = 4 for light and n = 3 for dark). The graphs show the % change in the accumulation of each of the specified isotopomers after 5 min.
FIGURE 7.
FIGURE 7.
There were two opposing effects of Ca2+ on α-KG. A, schematic illustration of the malate-aspartate shuttle. AGC1 activity is stimulated by Ca2+. The increased flux can lead to increased production of malate, which can drive export of α-KG from the matrix through the oxoglutarate carrier translocator. Lac, lactate; Cit, citrate; Suc, succinate; Fum, fumarate; Mal, malate; Oxal, oxaloacetate; Pyr, pyruvate. B, Ca2+ also can regulate oxidation of α-KG by lowering the Km of α-KGDH. C, retinas from 18 days postnatal AGC1+/+ (black and white bars) or AGC1−/− (red and pink bars) littermates from the crosses were incubated with [13C]glucose for 5 min in either the dark or light before harvesting and extracting the retinas. Error bars represent S.E. n = 11–19. Supplemental Fig. S1B shows the effects of light on the corresponding total metabolite levels. D, The left side shows a schematic illustration of how the two opposing effects on α-KG offset each other so that there is no net change in flux between light and the dark in young mouse retinas. The right side shows how the effect of light on the Km of α-KGDH is revealed by inactivation of AGC1.
FIGURE 8.
FIGURE 8.
O2 consumption by mitochondria isolated from mouse retinas and titrated with Ca2+. To confirm that Ca2+ can influence AGC1 activity in rodent retinas we isolated mitochondria from rat retinas and measured their O2 consumption over a range of free Ca2+ concentrations using either glutamate and malate (Glu/Mal) or pyruvate and malate (Pyr/Mal) as fuel in a buffer containing EGTA. Oxidation of the Glu/Mal mix depends on AGC activity, whereas oxidation of the Pyr/Mal mix occurs independently of AGC1 (67). A, ADP was added at time 0 on this graph followed at 5 min (short dashed line) by either Pyr/Mal (black) or Glu/Mal (red) and then 20-nmol stepwise additions of CaCl2 (longer dashed lines). B, Ca2+ dependence of O2 consumption rate when Glu/Mal is used as fuel. The K½ was determined from the curve that best fit the data from the experiments shown in panel A. n = 3; error bars show S.E.). Consistent with previous studies of mitochondria from other tissues (68), we found that Ca2+ stimulates O2 consumption. With mouse retina mitochondria we found a K½ of 165 nm only when the Glu/Mal mixture is used as a fuel. This confirms that Ca2+ can stimulate Asp/Glu exchange in the mouse retina. Note that the millimolar concentrations of Pyr/Mal and Glu/Mal in these experiments are so high that any influence of Ca2+ on the Km values of matrix dehydrogenases would not affect respiration.
FIGURE 9.
FIGURE 9.
Light affected the steady-state levels of metabolites in mouse retinas. A, The ratio of steady-state levels of metabolites in light versus darkness after 2 min, 2 h, and 6 h of illumination. Mice were dark-adapted overnight then exposed to ambient illumination either for 2 min, 2 h, or 6 h. Control mice were kept in the dark for the same periods. At each time point retinas were harvested, and metabolites were extracted and analyzed by LC-MS. The graph shows the abundance of each metabolite in the light condition divided by the abundance in the corresponding dark condition. n = 4 light and 4 dark for each condition. Error bars are S.E. p values for each light versus dark comparison are listed in the supplemental Table 1). PEP, phosphoenol pyruvate; DHAP, dihydroxyacetone phosphate; AICAR, 5-aminoimidazole-4-carboxamide ribonucleotide. B, evidence that most of the purine nucleotides in mouse retinas are from the photoreceptors. Retinas from adult WT or rd1 mice (ages postnatal days 30 to 38) that were either kept in the dark or exposed to ambient illumination for 5 min were harvested and extracted, and metabolites were quantified by LC-MS (n = 3 for each condition; error bars show S.E.). R5P, ribose-5-phosphate.
FIGURE 10.
FIGURE 10.
Phototransduction was required for light to affect steady-state levels of metabolites. A, mice were either dark-adapted or light-adapted, and purine and pyrimidine metabolites were quantified by LC-MS. (n = 3). B and C, GNAT1/2+/+ (B) and GNAT1/2−/− (C) mice were dark-adapted overnight then kept either in the dark for 5 min or exposed to ambient light for 5 min. Retinas were harvested, and metabolites were extracted and quantified by LC-MS (n = 2 for GNAT1,2+/+ and n = 4 for GNAT1,2−/−; all error bars show S.D.). The graph shows the relative abundance of each metabolite in the dark or light (normalized to the dark value). The absence of both rod and cone transducins in the GNAT1/2−/− retinas suppresses the effect of light on all metabolites. DHAP, dihydroxyacetone phosphate.
FIGURE 11.
FIGURE 11.
Effect of light on aspartate. A, ratios of Asp/Glu from retinas isolated from mouse eyes. The ratios of Asp and Glu were calculated from the experiment shown in Fig. 9. B, ratios of Asp/Glu from retinas incubated in culture dishes in the dark or light. The ratios of total Asp and Glu were calculated from the results of the experiment shown in Fig. 7. C, more aspartate is released in the dark than in light from retinas (n = 3). Dark-adapted mouse retinas were isolated and cultured either in the dark or in light in media with 5 mm glutamine. After 60 min the media were harvested, and metabolites were quantified by GC-MS (n = 3; error bars show S.D.).
FIGURE 12.
FIGURE 12.
Summary of the effects of light on retinal metabolism. A, in darkness 3′:5′ cGMP is not rapidly hydrolyzed to 5′-GMP. Low 5′-GMP activities allow maximal activity of enzymes in the purine synthesis pathway. It also is possible that darkness favors breakdown of mRNA, which would also increase the concentrations of pyrimidines and purines (not shown). B, light stimulates hydrolysis of cGMP to 5′-GMP, which then inhibits multiple steps in purine synthesis to cause accumulation of ribose 5-phosphate (R5P) and depletion of downstream purines. Some of the increase in ribose 5-P may also reflect stimulation of pentose phosphate pathway activity. C, cytosolic [Ca2+]f is greater in the dark than in light. Ca2+ stimulates AGC1 to exchange aspartate out of mitochondria. Ca2+ also enters mitochondria where it lowers the Km of dehydrogenases to stimulate flux through the TCA cycle. D, light lowers [Ca2+]f. Both AGC1 and matrix dehydrogenase activities decrease. Pyr, pyruvate; Cit, citrate; PRPP, phosphoribosyl pyrophosphate; 5PRA, phosphoribosyl amine.

Similar articles

Cited by

References

    1. Warburg O., Posener K., and Negelein E. (1924) On the metabolism of carcinoma cells. Biochemische Zeitschrift 152, 309–344
    1. Krebs H. A. (1927) On the metabolism of the retina. Biochemische Zeitschrift 189, 57–59
    1. Lunt S. Y., and Vander Heiden M. G. (2011) Aerobic glycolysis: meeting the metabolic requirements of cell proliferation. Annu. Rev. Cell Dev. Biol. 27, 441–464 - PubMed
    1. Mayers J. R., and Vander Heiden M. G. (2015) Famine versus feast: understanding the metabolism of tumors in vivo. Trends Biochem. Sci. 40, 130–140 - PMC - PubMed
    1. Ames A. 3rd, Li Y. Y., Heher E. C., and Kimble C. R. (1992) Energy metabolism of rabbit retina as related to function: high cost of Na+ transport. J. Neurosci. 12, 840–853 - PMC - PubMed

Publication types

MeSH terms

LinkOut - more resources