. 2016 Feb 5;291(6):3100-13.
doi: 10.1074/jbc.M115.681759. Epub 2015 Dec 16.

Identification of the Glycosaminoglycan Binding Site of Interleukin-10 by NMR Spectroscopy

Affiliations

Identification of the Glycosaminoglycan Binding Site of Interleukin-10 by NMR Spectroscopy

Georg Künze et al. J Biol Chem. .

Abstract

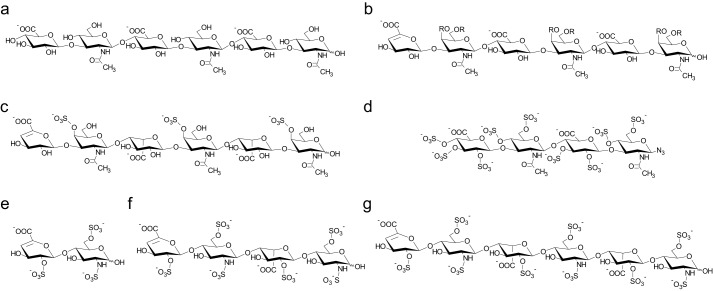
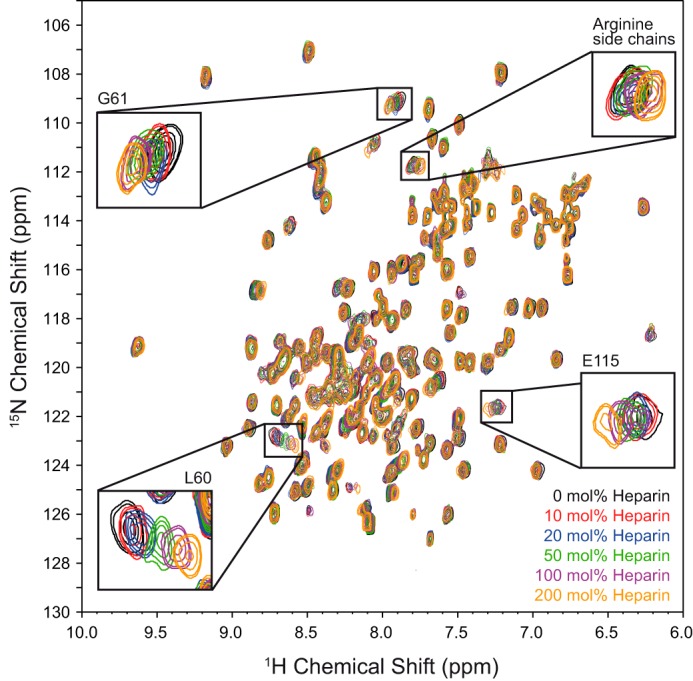
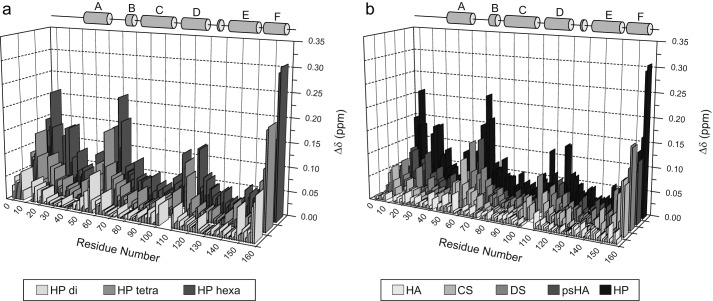
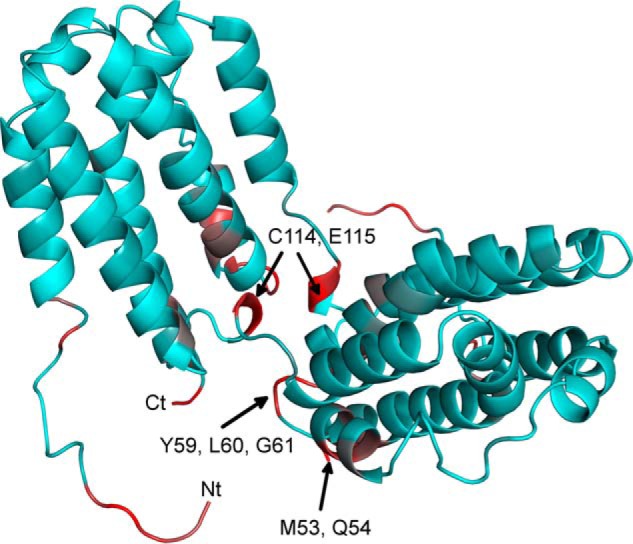
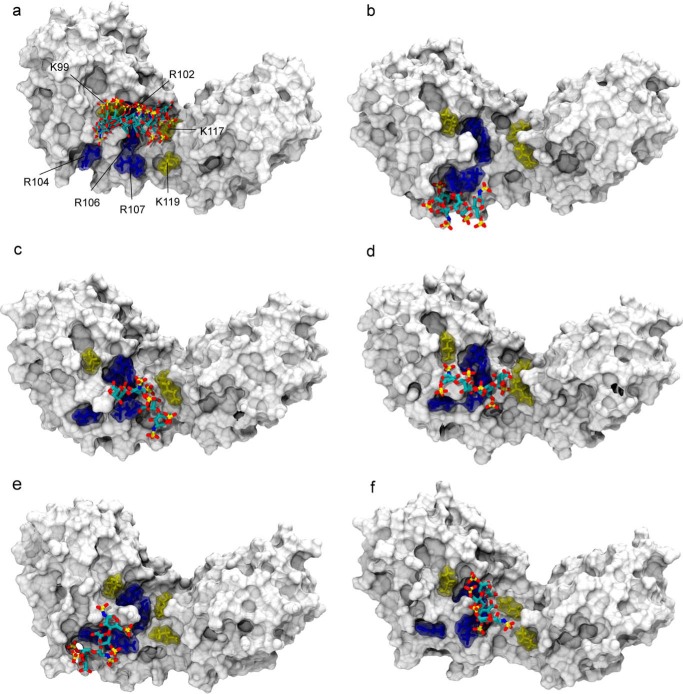
The biological function of interleukin-10 (IL-10), a pleiotropic cytokine with an essential role in inflammatory processes, is known to be affected by glycosaminoglycans (GAGs). GAGs are highly negatively charged polysaccharides and integral components of the extracellular matrix with important functions in the biology of many growth factors and cytokines. The molecular mechanism of the IL-10/GAG interaction is unclear. In particular, experimental evidence about IL-10/GAG binding sites is lacking, despite its importance for understanding the biological role of the interaction. Here, we report the experimental determination of a GAG binding site of IL-10. Although no co-crystal structure of the IL-10·GAG complex could be obtained, its structural characterization was possible by NMR spectroscopy. Chemical shift perturbations of IL-10 induced by GAG binding were used to narrow down the location of the binding site and to assess the affinity for different GAG molecules. Subsequent observation of NMR pseudocontact shifts of IL-10 and its heparin ligand, as induced by a protein-attached lanthanide spin label, provided structural restraints for the protein·ligand complex. Using these restraints, pseudocontact shift-based rigid body docking together with molecular dynamics simulations yielded a GAG binding model. The heparin binding site is located at the C-terminal end of helix D and the adjacent DE loop and coincides with a patch of positively charged residues involving arginines 102, 104, 106, and 107 and lysines 117 and 119. This study represents the first experimental characterization of the IL-10·GAG complex structure and provides the starting point for revealing the biological significance of the interaction of IL-10 with GAGs.

Keywords: carbohydrate function; extracellular matrix; glycosaminoglycan; heparin; interleukin-10; nuclear magnetic resonance (NMR); paramagnetic NMR; pseudocontact shifts.


Figures

FIGURE 1.
FIGURE 1.
GAGs used for NMR chemical shift perturbation experiments. The structures of HA hexasaccharide (a), CS hexasaccharide (b), DS hexasaccharide (c), and psHA tetrasaccharide (d) are shown. For heparin, different chain lengths were tested: di- (e), tetra- (f), and hexasaccharide (g). CS, DS, and heparin molecules carried a 4,5-unsaturated uronic acid ring at the non-reducing end as a result of preparation by lyase digestion. CS had a non-uniform sulfation pattern with the residue R at the O4 or O6 position being either H or SO3. psHA was synthesized with an azide group at the reducing end.
FIGURE 2.
FIGURE 2.
Heparin induced chemical shift perturbations of IL-10. A sequence of 1H-15N HSQC spectra of IL-10 at 600 MHz, a temperature of 30 °C, and pH 6.2 during a titration with heparin tetrasaccharide is shown. Selected protein signals with significant chemical shift changes are highlighted.
FIGURE 3.
FIGURE 3.
Weighted NH chemical shift changes (Δδ) along the IL-10 primary sequence. Experiments were performed with heparins of increasing chain length (a) and different GAG oligosaccharides (b). The α-helix regions of IL-10 are indicated as gray cylinders. The protein/ligand ratio was 1:2 in each case. In b, hexasaccharides were used except for psHA tetrasaccharide. HP, heparin.
FIGURE 4.
FIGURE 4.
Observed NH chemical shift changes mapped onto the backbone structure of IL-10. The protein structure is shown as a schematic diagram. Residues are colored according to their NH Δδ value relative to that of Leu-60 (with the highest Δδ). Colors correspond to 0% (cyan) and 100% (red) Δδ relative to Leu-60. A possible conformation of the N-terminal region 5–17, which was not resolved in the crystal structure, was appended to the structural model here for visualization of their chemical shift changes.
FIGURE 5.
FIGURE 5.
STD NMR measurement of IL-10-heparin binding. a, 600-MHz 1H reference and STD NMR spectrum (×15 magnification) of 3.0 mm heparin tetrasaccharide in the presence of IL-10 in 10 mm sodium phosphate (pD 7.4), 150 mm NaCl, 99.9% D2O at 20 °C. Spectra were obtained with 32 scans at a protein/ligand ratio of 1:75 and a saturation time of 5.0 s. STD signals are assigned to their respective heparin ring protons. The chemical structure of heparin with designation of the sugar rings is shown in Fig. 6. b, binding curve of heparin tetrasaccharide as obtained from the initial growth rates of the STD amplification factor (STD-AF). The STD signal of proton H4 of ring A at the non-reducing sugar end was analyzed. Error bars for each titration point were obtained from the fit of the STD buildup curve to an exponential function. The binding curve was obtained by fitting the initial growth rates (STD-AF0) to a one-site binding model. c, STD control experiments with non-heparin-binding proteins: equine myoglobin (MYG), human carbonic anhydrase 1 (CAH1), and bovine carbonic anhydrase 2 (CAH2). The same experimental conditions as for IL-10 were employed. All STD spectra are shown with ×15 magnification. For myoglobin and bovine carbonic anhydrase 2, an STD signal at around 3.25 ppm was detected, which very likely represents an additive of glycine in the commercially sold protein preparations.
FIGURE 6.
FIGURE 6.
PCS measurement of IL-10 and its heparin ligand. a, 1H-15N HSQC spectra of mixed IL-10-LBT in the presence of 1 eq of Lu3+ (black), Tb3+ (red), Tm3+ (green), and Dy3+ (blue), respectively, at 600 MHz and 30 °C. PCS vectors of selected amino acid residues are indicated as black lines between corresponding diamagnetic and paramagnetic peaks. b, 1H-13C HSQC spectra of heparin tetrasaccharide in the presence of uniform IL-10-LBT complexed with Lu3+ (black), Tb3+ (red), Tm3+ (green), and Dy3+ (blue), respectively. The protein/ligand ratio was 1:4. The assignment of the heparin CH groups is shown. Sugar rings are labeled with capital letters beginning at the non-reducing end. Signals arising from residual not 2H-labeled HEPES buffer and from the protein are marked with asterisks and P, respectively. Buffer signals can serve as internal references, which show no shift compared with heparin signals. c, chemical structure of heparin tetrasaccharide with measured PCS values. The same color coding as in a and b is used.
FIGURE 7.
FIGURE 7.
Lanthanide ion position and Δχ-tensor determination. a, IL-10 is represented as a schematic diagram, and the position of the lanthanide ions, as determined from the Δχ-tensor fit of mixed IL-10-LBT, is indicated by spheres. The lanthanide binding site is close to the protein's C terminus to which LBT was attached. b, representation of the Δχ-tensor of Tb3+ as PCS isosurfaces corresponding to PCS values of ±0.75 and ±0.2 ppm. Positive and negative PCSs are shown by blue and red isosurfaces, respectively.
FIGURE 8.
FIGURE 8.
Structural model of the heparin·IL-10 complex as obtained by PCS-based rigid body docking and subsequent MD simulation. a, ensemble of the five lowest energy structures of the 1C4 heparin ligand after PCS-based docking. The IL-10 molecule is represented with its van der Waals surface. Heparin is drawn in sticks and colored according to the atom type: carbon (cyan), oxygen (red), nitrogen (blue), and sulfur (gold). For clarity, only one heparin binding site is shown. For the second IL-10 dimer subunit on the opposite side of the central crevice, an identical docking pose was obtained, which involves the same group of basic residues. The best five docking solutions were used as the starting point for independent MD simulations from which snapshots after 105 ns are shown here (b–f). In the docking structure and during MD, the ligand position coincides with a cluster of positively charged amino acid residues of IL-10 as shown in sticks: arginines 102, 104, 106, and 107 are colored in blue, and lysines 99, 117, and 119 are shown in yellow.

References

    1. Fiorentino D. F., Bond M. W., and Mosmann T. R. (1989) Two types of mouse T helper cell. IV. Th2 clones secrete a factor that inhibits cytokine production by Th1 clones. J. Exp. Med. 170, 2081–2095 - PMC - PubMed
    1. Fiorentino D. F., Zlotnik A., Vieira P., Mosmann T. R., Howard M., Moore K. W., and O'Garra A. (1991) IL-10 acts on the antigen-presenting cell to inhibit cytokine production by Th1 cells. J. Immunol. 146, 3444–3451 - PubMed
    1. Ding L., and Shevach E. M. (1992) IL-10 inhibits mitogen-induced T cell proliferation by selectively inhibiting macrophage costimulatory function. J. Immunol. 148, 3133–3139 - PubMed
    1. Ishida H., Hastings R., Kearney J., and Howard M. (1992) Continuous anti-interleukin 10 antibody administration depletes mice of Ly-1 B cells but not conventional B cells. J. Exp. Med. 175, 1213–1220 - PMC - PubMed
    1. Levy Y., and Brouet J. C. (1994) Interleukin-10 prevents spontaneous death of germinal center B cells by induction of the bcl-2 protein. J. Clin. Invest. 93, 424–428 - PMC - PubMed

Publication types

LinkOut - more resources