

Spontaneous ATM Gene Reversion in A-T iPSC to Produce an Isogenic Cell Line
- PMID: 26677768
- PMCID: PMC4682125
- DOI: 10.1016/j.stemcr.2015.10.010
Spontaneous ATM Gene Reversion in A-T iPSC to Produce an Isogenic Cell Line
Abstract
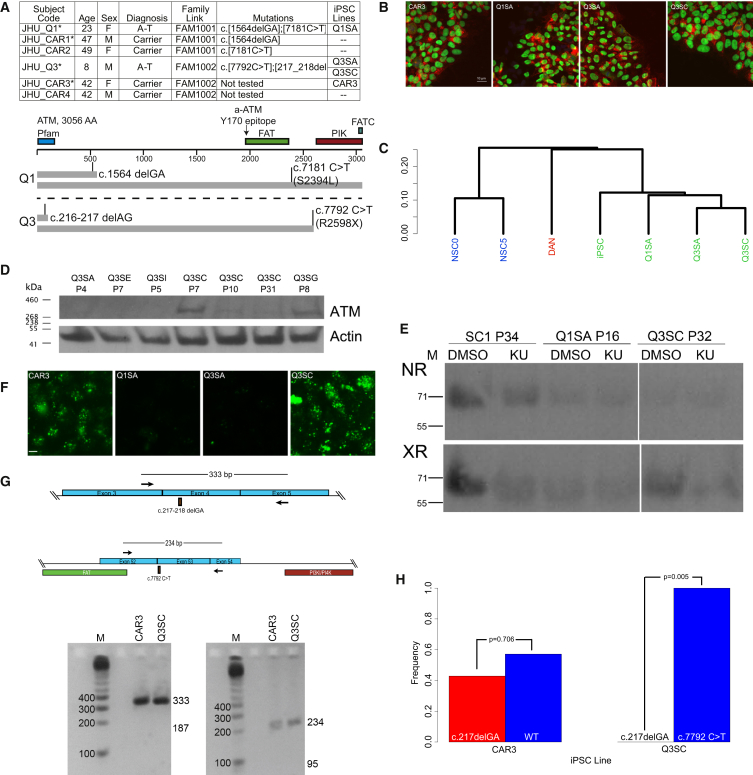
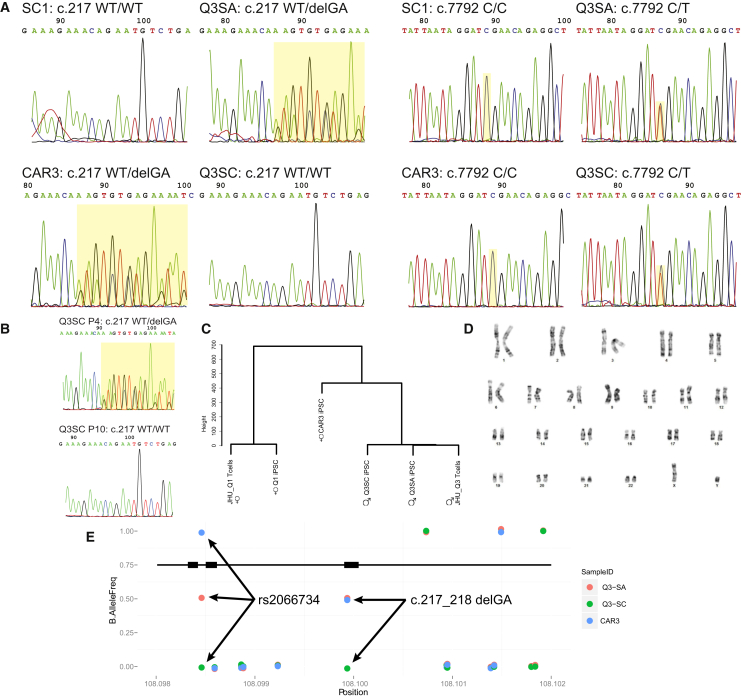
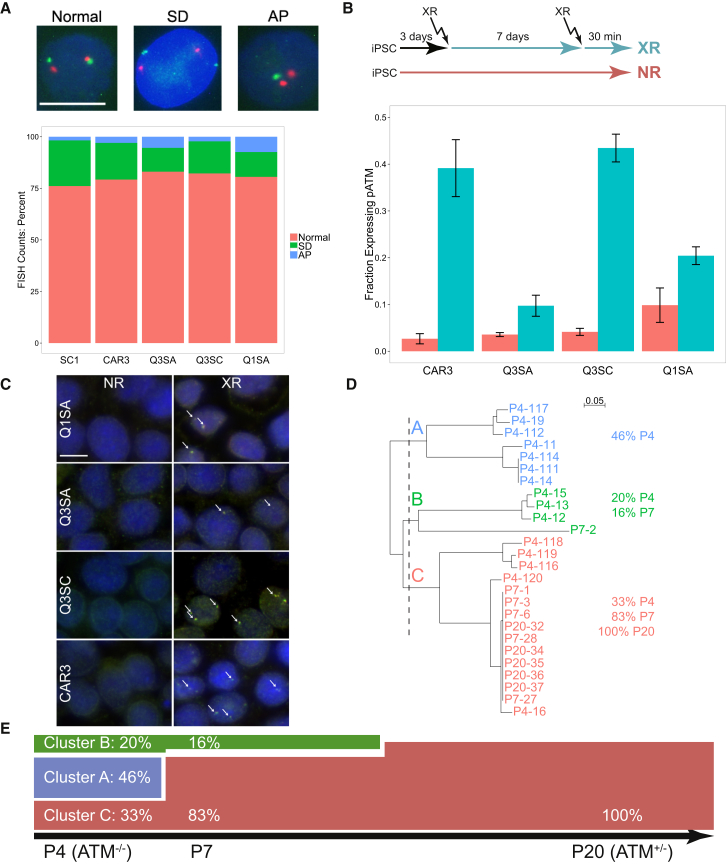
A spontaneously reverted iPSC line was identified from an A-T subject with heterozygous ATM truncation mutations. The reverted iPSC line expressed ATM protein and was capable of radiation-induced phosphorylation of CHK2 and H2A.X. Genome-wide SNP analysis confirmed a match to source T cells and also to a distinct, non-reverted iPSC line from the same subject. Rearranged T cell receptor sequences predict that the iPSC culture originated as several independently reprogrammed cells that resolved into a single major clone, suggesting that gene correction likely occurred early in the reprogramming process. Gene expression analysis comparing ATM(-/-) iPSC lines to unrelated ATM(+/-) cells identifies a large number of differences, but comparing only the isogenic pair of A-T iPSC lines reveals that the primary pathway affected by loss of ATM is a diminished expression of p53-related mRNAs. Gene reversion in culture, although likely a rare event, provided a novel, reverted cell line for studying ATM function.
Copyright © 2015 The Authors. Published by Elsevier Inc. All rights reserved.
Figures

Similar articles
-
Correction of ATM mutations in iPS cells from two ataxia-telangiectasia patients restores DNA damage and oxidative stress responses.Hum Mol Genet. 2020 Apr 15;29(6):990-1001. doi: 10.1093/hmg/ddaa023. Hum Mol Genet. 2020. PMID: 32037450
-
Integration-free erythroblast-derived human induced pluripotent stem cells (iPSCs) from an individual with Ataxia-Telangiectasia (A-T).Stem Cell Res. 2016 Sep;17(2):205-207. doi: 10.1016/j.scr.2016.08.003. Epub 2016 Aug 5. Stem Cell Res. 2016. PMID: 27879207
-
Effects of Integrating and Non-Integrating Reprogramming Methods on Copy Number Variation and Genomic Stability of Human Induced Pluripotent Stem Cells.PLoS One. 2015 Jul 1;10(7):e0131128. doi: 10.1371/journal.pone.0131128. eCollection 2015. PLoS One. 2015. PMID: 26131765 Free PMC article.
-
Robust reprogramming of Ataxia-Telangiectasia patient and carrier erythroid cells to induced pluripotent stem cells.Stem Cell Res. 2016 Sep;17(2):296-305. doi: 10.1016/j.scr.2016.08.006. Epub 2016 Aug 12. Stem Cell Res. 2016. PMID: 27596957
-
Generation of a gene-corrected isogenic control cell line from an Alzheimer's disease patient iPSC line carrying a A79V mutation in PSEN1.Stem Cell Res. 2016 Sep;17(2):285-288. doi: 10.1016/j.scr.2016.08.002. Epub 2016 Aug 7. Stem Cell Res. 2016. PMID: 27879212
Cited by
-
Genetics of Alcohol Use Disorder: A Role for Induced Pluripotent Stem Cells?Alcohol Clin Exp Res. 2018 Sep;42(9):1572-1590. doi: 10.1111/acer.13811. Epub 2018 Jul 5. Alcohol Clin Exp Res. 2018. PMID: 29897633 Free PMC article. Review.
-
Influence of ATM-Mediated DNA Damage Response on Genomic Variation in Human Induced Pluripotent Stem Cells.Stem Cells Dev. 2016 May 1;25(9):740-7. doi: 10.1089/scd.2015.0393. Epub 2016 Apr 11. Stem Cells Dev. 2016. PMID: 26935587 Free PMC article.
-
OLIG2 Drives Abnormal Neurodevelopmental Phenotypes in Human iPSC-Based Organoid and Chimeric Mouse Models of Down Syndrome.Cell Stem Cell. 2019 Jun 6;24(6):908-926.e8. doi: 10.1016/j.stem.2019.04.014. Epub 2019 May 23. Cell Stem Cell. 2019. PMID: 31130512 Free PMC article.
-
Increased nicotine response in iPSC-derived human neurons carrying the CHRNA5 N398 allele.Sci Rep. 2016 Oct 4;6:34341. doi: 10.1038/srep34341. Sci Rep. 2016. PMID: 27698409 Free PMC article.
References
-
- Assaf C., Hummel M., Dippel E., Goerdt S., Müller H.H., Anagnostopoulos I., Orfanos C.E., Stein H. High detection rate of T-cell receptor beta chain rearrangements in T-cell lymphoproliferations by family specific polymerase chain reaction in combination with the GeneScan technique and DNA sequencing. Blood. 2000;96:640–646. - PubMed
-
- Barlow C., Hirotsune S., Paylor R., Liyanage M., Eckhaus M., Collins F., Shiloh Y., Crawley J.N., Ried T., Tagle D., Wynshaw-Boris A. Atm-deficient mice: a paradigm of ataxia telangiectasia. Cell. 1996;86:159–171. - PubMed
-
- Concannon P., Gatti R.A. Diversity of ATM gene mutations detected in patients with ataxia-telangiectasia. Hum. Mutat. 1997;10:100–107. - PubMed
MeSH terms
Substances
Grants and funding
LinkOut - more resources
Full Text Sources
Other Literature Sources
Molecular Biology Databases
Research Materials
Miscellaneous
