. 2016 Mar;150(3):638-649.e8.
doi: 10.1053/j.gastro.2015.11.047. Epub 2015 Dec 8.

Human Enteroids as a Model of Upper Small Intestinal Ion Transport Physiology and Pathophysiology

Affiliations

Human Enteroids as a Model of Upper Small Intestinal Ion Transport Physiology and Pathophysiology

Jennifer Foulke-Abel et al. Gastroenterology. 2016 Mar.

Abstract

Background & aims: Human intestinal crypt-derived enteroids are a model of intestinal ion transport that require validation by comparison with cell culture and animal models. We used human small intestinal enteroids to study neutral Na(+) absorption and stimulated fluid and anion secretion under basal and regulated conditions in undifferentiated and differentiated cultures to show their functional relevance to ion transport physiology and pathophysiology.

Methods: Human intestinal tissue specimens were obtained from an endoscopic biopsy or surgical resections performed at Johns Hopkins Hospital. Crypts were isolated, enteroids were propagated in culture, induced to undergo differentiation, and transduced with lentiviral vectors. Crypt markers, surface cell enzymes, and membrane ion transporters were characterized using quantitative reverse-transcription polymerase chain reaction, immunoblot, or immunofluorescence analyses. We used multiphoton and time-lapse confocal microscopy to monitor intracellular pH and luminal dilatation in enteroids under basal and regulated conditions.

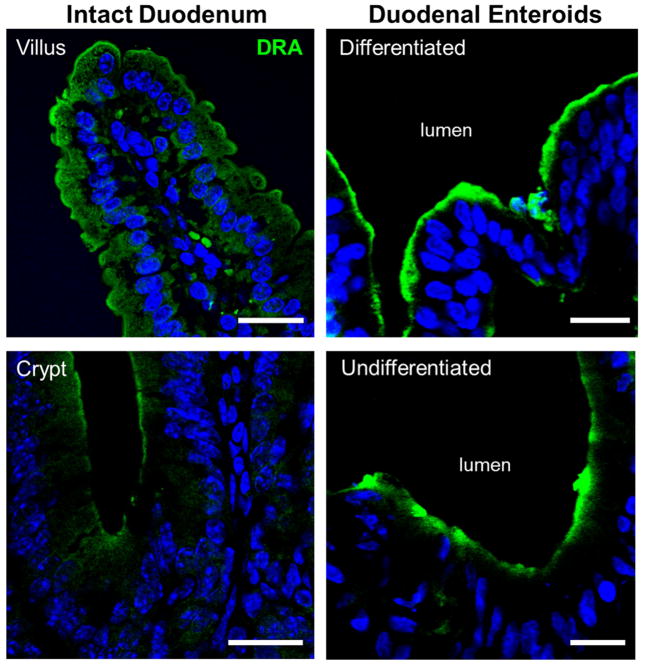
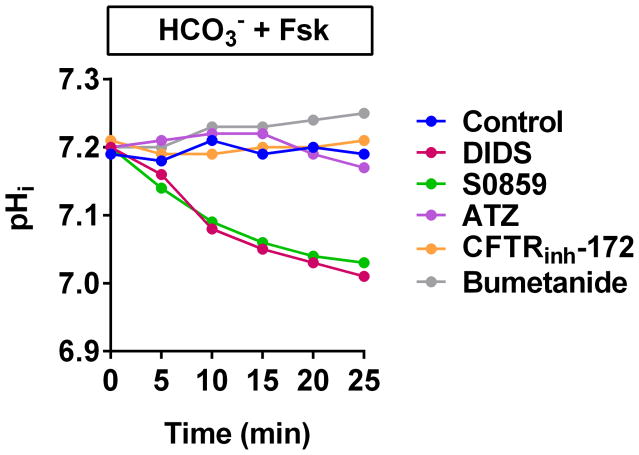
Results: Enteroids differentiated upon withdrawal of WNT3A, yielding decreased crypt markers and increased villus-like characteristics. Na(+)/H(+) exchanger 3 activity was similar in undifferentiated and differentiated enteroids, and was affected by known inhibitors, second messengers, and bacterial enterotoxins. Forskolin-induced swelling was completely dependent on cystic fibrosis transmembrane conductance regulator and partially dependent on Na(+)/H(+) exchanger 3 and Na(+)/K(+)/2Cl(-) cotransporter 1 inhibition in undifferentiated and differentiated enteroids. Increases in cyclic adenosine monophosphate with forskolin caused enteroid intracellular acidification in HCO3(-)-free buffer. Cyclic adenosine monophosphate-induced enteroid intracellular pH acidification as part of duodenal HCO3(-) secretion appears to require cystic fibrosis transmembrane conductance regulator and electrogenic Na(+)/HCO3(-) cotransporter 1.

Conclusions: Undifferentiated or crypt-like, and differentiated or villus-like, human enteroids represent distinct points along the crypt-villus axis; they can be used to characterize electrolyte transport processes along the vertical axis of the small intestine. The duodenal enteroid model showed that electrogenic Na(+)/HCO3(-) cotransporter 1 might be a target in the intestinal mucosa for treatment of secretory diarrheas.

Keywords: Intestinal Organoids; NHE3 Activity; Na(+) Absorption; Stimulated Secretion.


Conflict of interest statement

Disclosures: The authors declare no financial or other interests with respect to this paper.

Figures

Figure 1
Figure 1
Analysis of differentiation markers in human duodenal enteroids. (A) TEM images of the undifferentiated and differentiated enteroid brush border. Scale bar, 1 μm. (B) EdU incorporation in whole-mount enteroids during each day of the differentiation time course. ND, undifferentiated; DF1, differentiation day 1, etc. Scale bar, 100 μm. Note undetectable EdU incorporation at DF4 and DF5. (C) Luminal Muc2-positive secretions detected by immunostaining with Muc2 antibody in whole-mount enteroids. Muc2 is present only in differentiated enteroids. Scale bar, 50 μm. (D) mRNA fold change analysis comparing markers of crypt base columnar cells (LGR5, ASCL2, OLFM4), proliferative potential (KI67), and lineage commitment (SI, TFF3) in undifferentiated and differentiated enteroids. Results are mean ± SEM; *P<0.05, **P <0.01, ***P <0.001; n = 5 different enteroid lines.
Figure 1
Figure 1
Analysis of differentiation markers in human duodenal enteroids. (A) TEM images of the undifferentiated and differentiated enteroid brush border. Scale bar, 1 μm. (B) EdU incorporation in whole-mount enteroids during each day of the differentiation time course. ND, undifferentiated; DF1, differentiation day 1, etc. Scale bar, 100 μm. Note undetectable EdU incorporation at DF4 and DF5. (C) Luminal Muc2-positive secretions detected by immunostaining with Muc2 antibody in whole-mount enteroids. Muc2 is present only in differentiated enteroids. Scale bar, 50 μm. (D) mRNA fold change analysis comparing markers of crypt base columnar cells (LGR5, ASCL2, OLFM4), proliferative potential (KI67), and lineage commitment (SI, TFF3) in undifferentiated and differentiated enteroids. Results are mean ± SEM; *P<0.05, **P <0.01, ***P <0.001; n = 5 different enteroid lines.
Figure 2
Figure 2
Analysis of major ion transporters in human duodenal enteroids. (A) Representative immunoblots of NHE3, DRA, CFTR, NKCC1, and NBCe1 in undifferentiated (ND) and differentiated (DF) duodenal enteroids. The change in transporter expression after differentiation is normalized to GAPDH. Graph results are mean ± SEM; *P<0.05, **P <0.01, ***P <0.001; n = 4 different enteroid lines. (B–E) Immunofluorescence of NHE3, DRA, CFTR, and NKCC1 in intact human duodenal tissue and undifferentiated or differentiated duodenal enteroids. Similar results were obtained in 3 different enteroid lines. Scale bar, 20 μm.
Figure 2
Figure 2
Analysis of major ion transporters in human duodenal enteroids. (A) Representative immunoblots of NHE3, DRA, CFTR, NKCC1, and NBCe1 in undifferentiated (ND) and differentiated (DF) duodenal enteroids. The change in transporter expression after differentiation is normalized to GAPDH. Graph results are mean ± SEM; *P<0.05, **P <0.01, ***P <0.001; n = 4 different enteroid lines. (B–E) Immunofluorescence of NHE3, DRA, CFTR, and NKCC1 in intact human duodenal tissue and undifferentiated or differentiated duodenal enteroids. Similar results were obtained in 3 different enteroid lines. Scale bar, 20 μm.
Figure 3
Figure 3
Na+/H+ exchange in human enteroids. A single donor was used for all experiments in Figure 3. (A) A typical NHE3 activity assay in enteroids as a function of Na+-dependent pHi recovery. (B) NHE3 activity in undifferentiated and differentiated duodenal enteroids. n = 3 enteroids, each taken from a separate passage. (C) Representative traces show the effect of NHE family inhibitors in differentiated duodenal enteroids. (D) Average rate of realkalinization with inhibitors in (C). Results are mean ± SEM; **P <0.01; n = 3 enteroids, each taken from a separate passage. (E) Representative immunoblot of NHE3 protein expression in scrambled shRNA control (Scr), wild-type (WT), and knock-down (KD) confirmed >90% knock-down of expressed NHE3 using this approach, and the knock-down persisted for >10 passages. n=3 blots, each taken from a separate passage. (F) NHE3 activity in wild type (WT) and NHE3 knock-down (KD) differentiated duodenal enteroids. Results are mean ± SEM; **P <0.01; n = 3 enteroids, each taken from a separate passage.
Figure 3
Figure 3
Na+/H+ exchange in human enteroids. A single donor was used for all experiments in Figure 3. (A) A typical NHE3 activity assay in enteroids as a function of Na+-dependent pHi recovery. (B) NHE3 activity in undifferentiated and differentiated duodenal enteroids. n = 3 enteroids, each taken from a separate passage. (C) Representative traces show the effect of NHE family inhibitors in differentiated duodenal enteroids. (D) Average rate of realkalinization with inhibitors in (C). Results are mean ± SEM; **P <0.01; n = 3 enteroids, each taken from a separate passage. (E) Representative immunoblot of NHE3 protein expression in scrambled shRNA control (Scr), wild-type (WT), and knock-down (KD) confirmed >90% knock-down of expressed NHE3 using this approach, and the knock-down persisted for >10 passages. n=3 blots, each taken from a separate passage. (F) NHE3 activity in wild type (WT) and NHE3 knock-down (KD) differentiated duodenal enteroids. Results are mean ± SEM; **P <0.01; n = 3 enteroids, each taken from a separate passage.
Figure 4
Figure 4
Microbial enterotoxins, cAMP, and cGMP inhibit NHE3 in differentiated enteroids. (A) Effect of cGMP elevation by 8-pCPT-cGMP or cAMP elevation via 8-Br-cAMP or forskolin in duodenal enteroids. Results are mean ± SEM;**P <0.01; n = 3 different enteroid lines. (B) Effect of STa or CTX in jejunal enteroids. Results are mean ± SEM;**P <0.01; n = 3 different enteroid lines.
Figure 4
Figure 4
Microbial enterotoxins, cAMP, and cGMP inhibit NHE3 in differentiated enteroids. (A) Effect of cGMP elevation by 8-pCPT-cGMP or cAMP elevation via 8-Br-cAMP or forskolin in duodenal enteroids. Results are mean ± SEM;**P <0.01; n = 3 different enteroid lines. (B) Effect of STa or CTX in jejunal enteroids. Results are mean ± SEM;**P <0.01; n = 3 different enteroid lines.
Figure 5
Figure 5
Ion transporters contribute to forskolin-induced apical fluid secretion. (A) Representative FIS time course in undifferentiated or differentiated duodenal enteroids. Results are mean ± SEM, n ≥ 10 enteroids for each condition. (B) Contribution to the FIS rate by inhibition of each transporter calculated relative to the inhibitor-free forskolin-stimulated condition. Results are mean ± SEM;**P <0.01; n = 3 different enteroid lines.
Figure 5
Figure 5
Ion transporters contribute to forskolin-induced apical fluid secretion. (A) Representative FIS time course in undifferentiated or differentiated duodenal enteroids. Results are mean ± SEM, n ≥ 10 enteroids for each condition. (B) Contribution to the FIS rate by inhibition of each transporter calculated relative to the inhibitor-free forskolin-stimulated condition. Results are mean ± SEM;**P <0.01; n = 3 different enteroid lines.
Figure 6
Figure 6
Role of HCO3 and ion transporters in forskolin-induced pHi changes. (A–C) pHichanges in differentiated duodenal enteroids after forskolin treatment in HEPES buffer with (A) CFTRinh-172, H-89, ATZ, or (B) EIPA, or in HCO3 buffer with (C) DIDS, S0859, ATZ, CFTRinh-172, or bumetanide. Representative traces from individual experiments are shown. (D) Average rate of ΔpHi under conditions in (A) and (C). n = 3 different enteroid lines for each condition. (E) Model of stimulated duodenal HCO3 transport based on studies in Figure 6. HCO3 secretion requires NBCe1 to replace HCO3 lost via CFTR. CA is not essential to maintain intracellular HCO3, and limiting Cl uptake by NKCC1 inhibition does not affect the ability of CFTR to conduct HCO3.
Figure 6
Figure 6
Role of HCO3 and ion transporters in forskolin-induced pHi changes. (A–C) pHichanges in differentiated duodenal enteroids after forskolin treatment in HEPES buffer with (A) CFTRinh-172, H-89, ATZ, or (B) EIPA, or in HCO3 buffer with (C) DIDS, S0859, ATZ, CFTRinh-172, or bumetanide. Representative traces from individual experiments are shown. (D) Average rate of ΔpHi under conditions in (A) and (C). n = 3 different enteroid lines for each condition. (E) Model of stimulated duodenal HCO3 transport based on studies in Figure 6. HCO3 secretion requires NBCe1 to replace HCO3 lost via CFTR. CA is not essential to maintain intracellular HCO3, and limiting Cl uptake by NKCC1 inhibition does not affect the ability of CFTR to conduct HCO3.

References

    1. Sato T, Vries RG, Snippert HJ, et al. Single Lgr5 stem cells build crypt-villus structures in vitro without a mesenchymal niche. Nature. 2009;459:262–265. - PubMed
    1. Sato T, Stange DE, Ferrante M, et al. Long-term Expansion of Epithelial Organoids From Human Colon, Adenoma, Adenocarcinoma, and Barrett’s Epithelium. Gastroenterology. 2011;141:1762–1772. - PubMed
    1. Foulke-Abel J, In J, Kovbasnjuk O, et al. Human enteroids as an ex-vivo model of host–pathogen interactions in the gastrointestinal tract. Exp Biol Med (Maywood) 2014;239:1124–1134. - PMC - PubMed
    1. Kovbasnjuk O, Zachos N, In J, et al. Human enteroids: preclinical models of non-inflammatory diarrhea. Stem Cell Res Ther. 2013;4:S3. - PMC - PubMed
    1. Middendorp S, Schneeberger K, Wiegerinck CL, et al. Adult stem cells in the small intestine are intrinsically programmed with their location-specific function. Stem Cells. 2014;32:1083–1091. - PubMed

Publication types

MeSH terms