. 2016 Apr;150(4):918-30.e13.
doi: 10.1053/j.gastro.2015.11.049. Epub 2015 Dec 8.

Expression of Activated Ras in Gastric Chief Cells of Mice Leads to the Full Spectrum of Metaplastic Lineage Transitions

Affiliations

Expression of Activated Ras in Gastric Chief Cells of Mice Leads to the Full Spectrum of Metaplastic Lineage Transitions

Eunyoung Choi et al. Gastroenterology. 2016 Apr.

Abstract

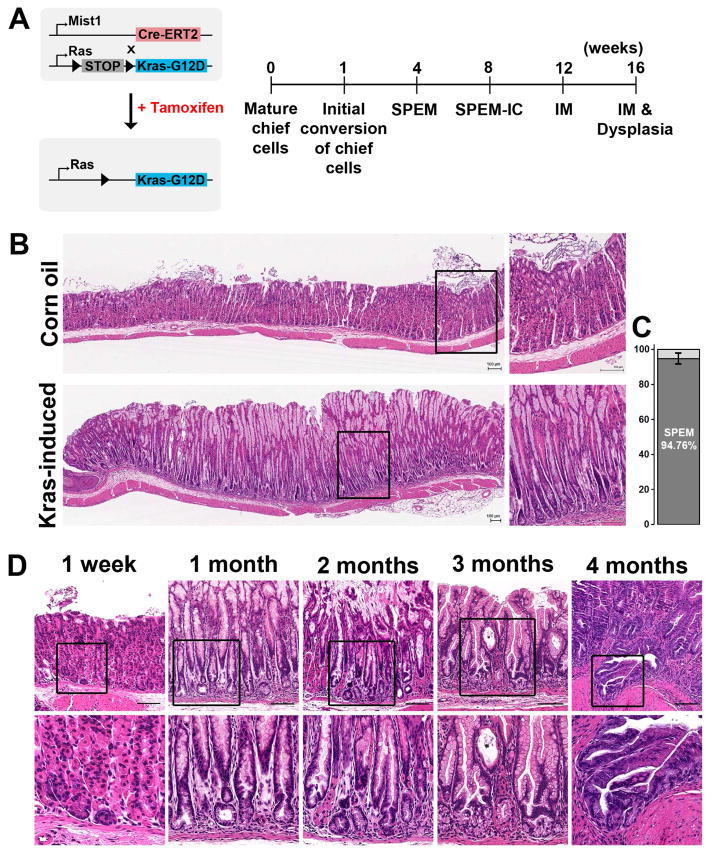
Background & aims: Gastric cancer develops in the context of parietal cell loss, spasmolytic polypeptide-expressing metaplasia (SPEM), and intestinal metaplasia (IM). We investigated whether expression of the activated form of Ras in gastric chief cells of mice leads to the development of SPEM, as well as progression of metaplasia.

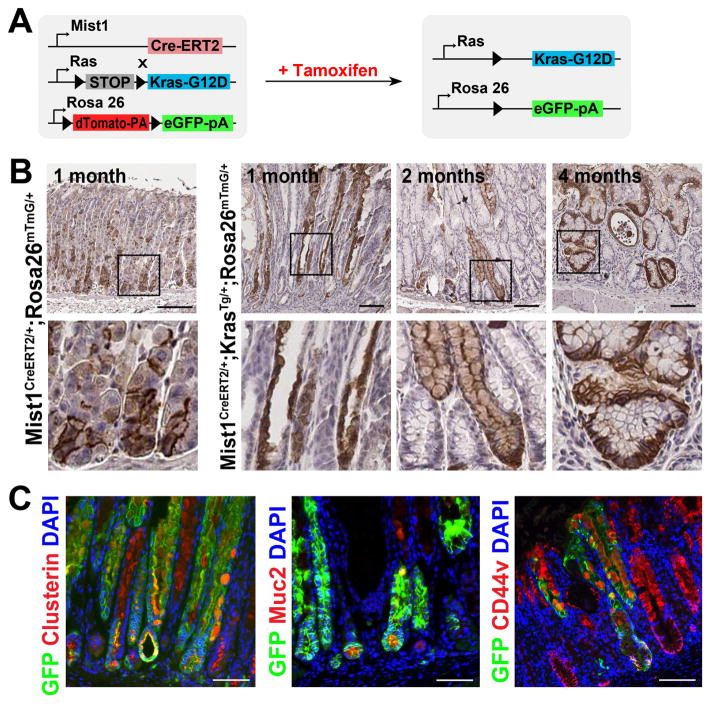
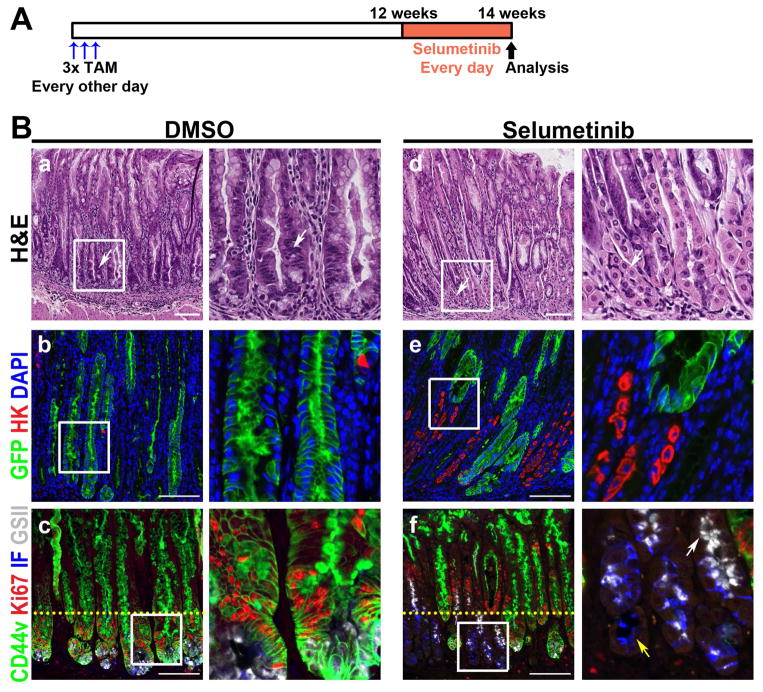
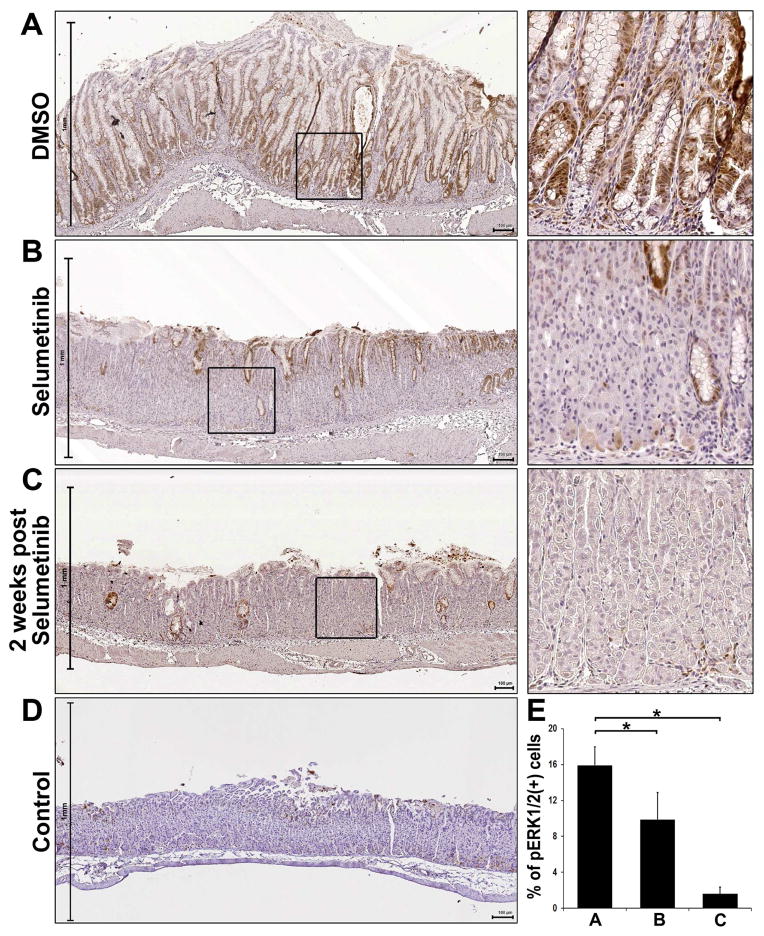
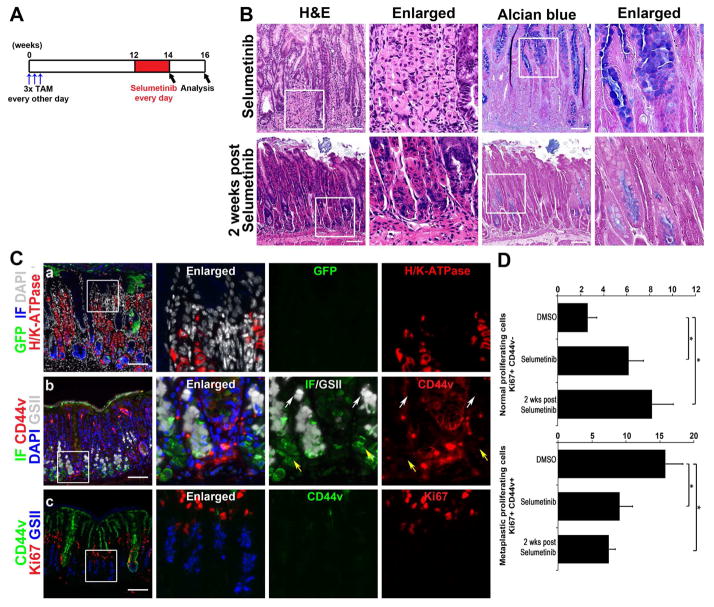
Methods: We studied Mist1-CreERT2Tg/+;LSL-K-Ras(G12D)Tg/+ (Mist1-Kras) mice, which express the active form of Kras in chief cells on tamoxifen exposure. We studied Mist1-CreERT2Tg/+;LSL-KRas (G12D)Tg/+;R26RmTmG/+ (Mist1-Kras-mTmG) mice to examine whether chief cells that express active Kras give rise to SPEM and IM. Some mice received intraperitoneal injections of the Mitogen-activated protein kinase kinase (MEK) inhibitor, selumetinib, for 14 consecutive days. Gastric tissues were collected and analyzed by immunohistochemistry, immunofluorescence, and quantitative polymerase chain reaction.

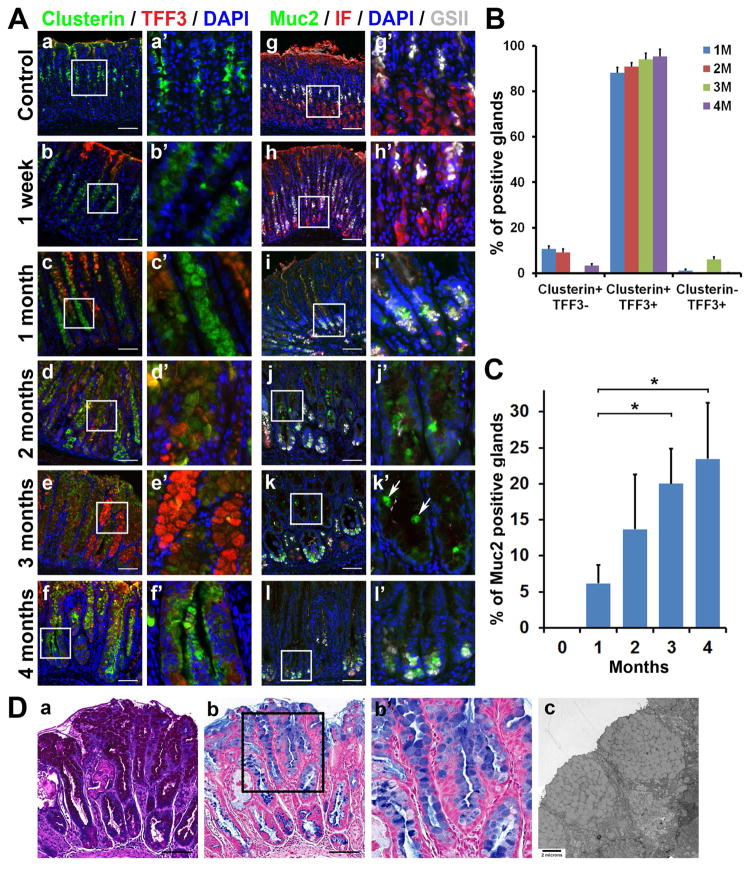
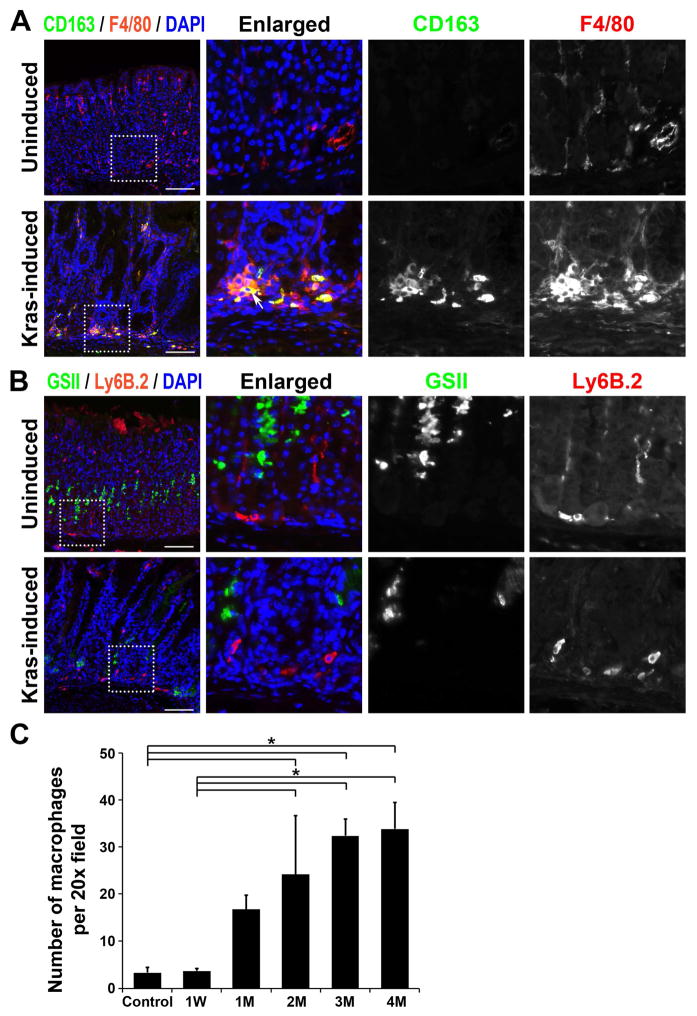
Results: Mist1-Kras mice developed metaplastic glands, which completely replaced normal fundic lineages and progressed to IM within 3-4 months after tamoxifen injection. The metaplastic glands expressed markers of SPEM and IM, and were infiltrated by macrophages. Lineage tracing studies confirmed that the metaplasia developed directly from Kras (G12D)-induced chief cells. Selumetinib induced persistent regression of SPEM and IM, and re-established normal mucosal cells, which were derived from normal gastric progenitor cells.

Conclusions: Expression of activated Ras in chief cells of Mist1-Kras mice led to the full range of metaplastic lineage transitions, including SPEM and IM. Inhibition of Ras signaling by inhibition of MEK might reverse preneoplastic metaplasia in the stomach.

Keywords: Carcinogenesis; Differentiation; MAP Kinase; Signal Transduction.


Conflict of interest statement

The authors have no conflicts of interest.

Figures

Figure 1
Figure 1. Mist1Cre-mediated active Kras expression in chief cells
A) Experimental strategy of Cre-mediated recombination in the (Mist1-Kras) mouse stomachs. Active Kras(G12D) expression was induced after STOP cassette excision by tamoxifen treatment. B) Histological staining of the stomachs of Mist1-Kras mice. Sections from Mist1-Kras mouse stomachs at 1 month post vehicle control or tamoxifen (induced) injection were examined by hematoxylin and eosin (H&E) staining. Dotted boxes indicate regions enlarged. C) 150 glands in the proximal region of corpus were examined in each group (n=7). 94.76% of glands showed parietal cells loss and SPEM. D) Key metaplastic stages were defined after active Kras induction. Data are representative of n = 3 mice for 1 week time point and n = 10 to15 mice per time point between 1 and 4 months. Dotted boxes denote regions enlarged in the second row. Scale bars are 100 μm.
Figure 2
Figure 2. Development of metaplasia in the Mist1-Kras mouse
A) Co-immunostaining for various SPEM and IM markers in the corpus of stomach sections from mice corn oil control, 1 week and 1 to 4 months post tamoxifen treatment (n=3). Clusterin (green) was observed in the mucous neck cells in corn oil control mouse stomachs and at 1-week post tamoxifen treatment, and also in SPEM or IM cells beginning at 1 month post tamoxifen treatment. TFF3 (red) was observed in the metaplastic glands beginning at 1 month. Intrinsic factor (IF, red) and GSII-Lectin (GSII, gray)-positive cells indicate SPEM. Muc2-positive Goblet cells (green) were present in the middle of metaplastic glands beginning at 2 months post tamoxifen treatment (white arrows). B) Quantitation of immunohistochemical analysis of SPEM (Clusterin) and/or IM (TFF3) marker-expressing glands in Mist1-Kras mouse stomachs from 1 to 4 months. C) Quantitation of immunochemical analysis of glands with Muc2-positive Goblet cells in Mist1-Kras mouse stomachs from control (0) to 4 months. * = p< 0.05. D) Sections from Mist1-Kras mouse stomachs at 3 months after tamoxifen injection were examined by periodic acid–Schiff (PAS) or Alcian blue staining (AB). Transmission electron micrograph of the metaplastic glands showing Goblet cells filled with mucus granules. 6500x. Boxes indicate regions enlarged. Scale bars = 100 μm.
Figure 3
Figure 3. Immunofluorescence staining of macrophage markers in Mist1-Kras mouse stomachs
A and B) Corpus regions from uninduced wild type mouse stomachs (control) or Mist1-Kras mouse stomachs (Mist1-Kras) at 4 months post tamoxifen treatment were co-immunostained with antibodies against macrophage M2 marker, CD163 (green), and macrophage and dendritic cell marker, F4/80 (red) (A) or with antibodies against neutrophil and polymorphonuclear cell marker, Ly6B.2 (red), and GSII-lectin (B). The F4/80-positive macrophages were observed in the Mist1-Kras mouse stomachs and were co-positive for CD163 (white arrow). The Ly6B.2-positive neutrophils were observed both in the control and the Mist1-Kras mouse stomachs. DAPI was used for nuclear staining (blue). Dotted box indicates regions enlarged. Scale bars = 100 μm. * = p<0.05. C) CD163-positive macrophages were counted per 20X field of images taken in the corpus from corn oil control, 1 week, and 1 to 4 months after tamoxifen treatment (n=3 to 4). * = p<0.05.
Figure 4
Figure 4. Lineage mapping of Cre-induced chief cells in Mist1-mTmG and Mist1-Kras-mTmG mice
A) Experimental strategy of Cre-mediated recombination in the Mist1-Kras-mTmG mouse stomachs. The R26RmTmG/+ allele expresses red fluorescent protein in the membrane prior to Cre recombinase-mediated excision (mT). However, after Cre-dependent excision, cells express green fluorescent protein in the membrane (mG). B) Immunohistochemistry for GFP in stomach sections of control Mist1-mTmG mice (no Kras) or Mist1-Kras-mTmG mice. C) The GFP (+) metaplastic glands in the corpus were co-immunostained with antibodies against Clusterin, Muc2, or CD44v from Mist1-Kras-mTmG mouse stomachs at 2 months after tamoxifen injection. DAPI was used for nuclear staining. Boxes indicate regions enlarged. Scale bars = 100 μm.
Figure 5
Figure 5. Regression of Kras-induced metaplasia by MEK inhibition
A) Selumetinib treatment schematic. At 3 months post tamoxifen treatment, Mist1-Kras-mTmG mice were treated with either DMSO (n=5) or 2 mg/kg Selumetinib (n=4) once daily for 2 weeks. B) Top row: H&E stained stomachs from mice treated with DMSO or with Selumetinib. DMSO treated mice showed severe metaplasia (arrow), but normal mucosal cells were observed in glands of Selumetinib-treated mice (arrows). Sections of the corpus from DMSO or Selumetinib treated mouse stomachs were immunostained with antibodies against GFP (green) and H/K-ATPase (red) (middle row) or with antibodies against CD44v (green), Ki67 (red) and intrinsic factor (blue), and GSII-lectin (white) (bottom row). DAPI was used for nuclear staining. Mucous neck cells (GSII+/CD44v−, white arrow) and chief cells (IF+/CD44v−, yellow arrow) were also observed in the Selumetinib-treated mice. Yellow dotted lines indicate the junction of zones between proliferating metaplastic cells and normal progenitor cells. Boxes indicate regions enlarged. Scale bars = 100 μm.
Figure 6
Figure 6. Immunohistochemistry of phospho-ERK1/2 in Selumetinib treated mouse stomachs
Sections of the fundic glands from Mist1-Kras-mTmG mice treated at 3 months after tamoxifen treatment with DMSO, Selumetinib-treated, or 2 weeks post Selumetinib treatment and wild type mouse (control) were examined for phospho-ERK1/2 immunostaining. A) The stomachs from Mist1-Kras-mTmG mice treated with DMSO showed strong phospho-ERK1/2 staining throughout the metaplastic glands. The stomachs from Mist1-Kras-mTmG mice treated with Selumetinib (B) or at 2 weeks post Selumetinib treatment (C) showed decreases in phospho-ERK1/2 compared to the DMSO treated mice. D) In the control mouse stomachs, phosphorylation of ERK1/2 was occasionally observed in the foveolar or progenitor cells in the neck region. Boxes indicate regions enlarged. Scale bars = 100 μm. E) The phospho-ERK1/2 (+) cells were counted in all mucosal areas of corpus from DMSO- (n=5), Selumetinib-treated (n=4) or at 2 weeks post Selumetinib treatment (n=3) mice. *p< 0.05.
Figure 7
Figure 7. Continued re-establishment of normal gastric lineages after Selumetinib withdrawal
A) Selumetinib treatment schematic. At 3 months after tamoxifen treatment, Mist1-Kras-mTmG mice were examined at the end of 2 weeks of Selumetinib treatment (n=4) or two weeks following cessation of Selumetinib (n=3). B) H&E stained stomachs from mice treated with Selumetinib or 2 weeks post Selumetinib treatment. C) Sections of the corpus from the mouse stomachs 2 weeks after cessation of Selumetinib treatment were immunostained with antibodies against GFP (green), H/K-ATPase (red), DAPI (white) and IF (blue) (top row), or against IF (green), CD44v (red), DAPI (blue) and GSII-lectin (white) (middle row), or against CD44v (green), Ki67 (red) and GSII-Lectin (blue) (bottom row). Several mucous neck cells (GSII+/CD44v−, white arrows) and chief cells (IF+/CD44v−, yellow arrows) were observed. Boxes indicate regions enlarged. Scale bars = 100 μm. D) Quantitation of proliferating cells in Selumetinib-treated Mist1-Kras-mTmG mouse stomachs. Two classes of Ki67-positive cells, Normal proliferating cells (Ki67+/CD44v−) and Metaplastic proliferating cells (Ki67+/CD44v+), were counted in glands in the corpus from DMSO- (n=5) or Selumetinib-treated (n=4), or 2 weeks post Selumetinib-treated (n=3) mouse stomachs. *p<0.05.

References

    1. Parkin DM, Bray FI, Devesa SS. Cancer burden in the year 2000. The global picture. Eur J Cancer. 2001;37(Suppl 8):S4–66. - PubMed
    1. Weis VG, Goldenring JR. Current understanding of SPEM and its standing in the preneoplastic process. Gastric Cancer. 2009;12:189–97. - PMC - PubMed
    1. Goldenring JR, Nam KT, Wang TC, et al. Spasmolytic polypeptide-expressing metaplasia and intestinal metaplasia: time for reevaluation of metaplasias and the origins of gastric cancer. Gastroenterology. 2010;138:2207–10. 2210 e1. - PMC - PubMed
    1. Goldenring JR, Nomura S. Differentiation of the Gastric Mucosa III. Animal models of oxyntic atrophy and metaplasia. Am J Physiol Gastrointest Liver Physiol. 2006;291:G999–G1004. - PubMed
    1. Correa P, Houghton J. Carcinogenesis of Helicobacter pylori. Gastroenterology. 2007;133:659–72. - PubMed

Publication types

MeSH terms