. 2015 Dec 18:5:18404.
doi: 10.1038/srep18404.

Mechanism for attenuated outward conductance induced by mutations in the cytoplasmic pore of Kir2.1 channels

Affiliations

Mechanism for attenuated outward conductance induced by mutations in the cytoplasmic pore of Kir2.1 channels

Hsueh-Kai Chang et al. Sci Rep. .

Abstract

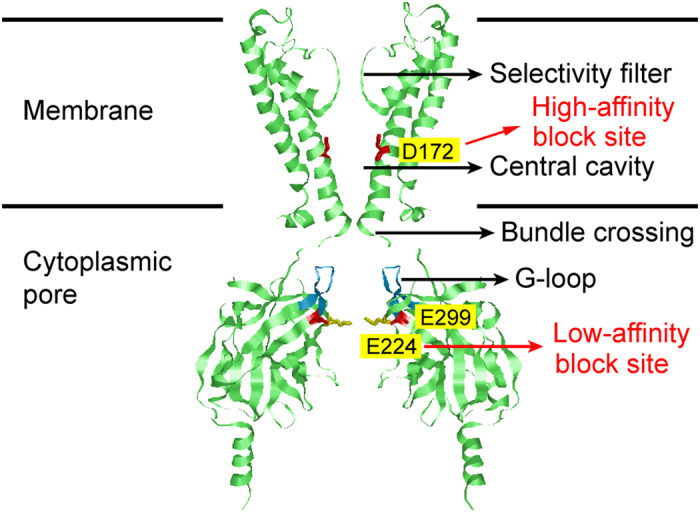
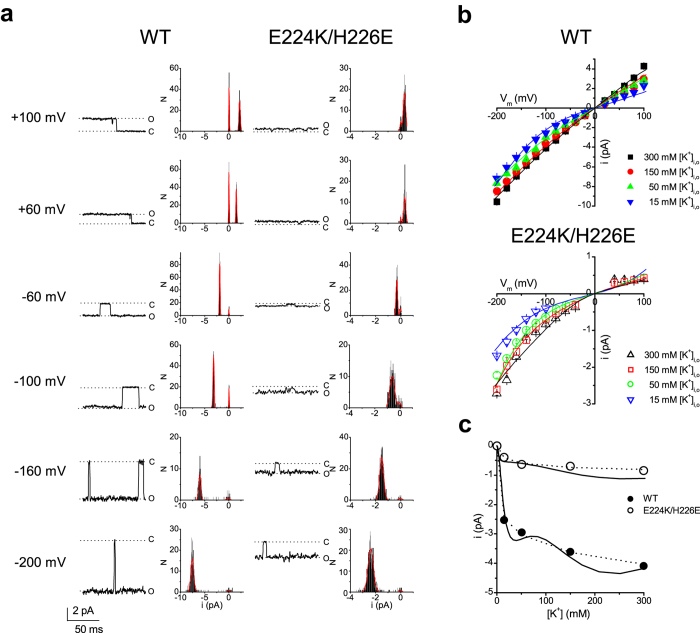
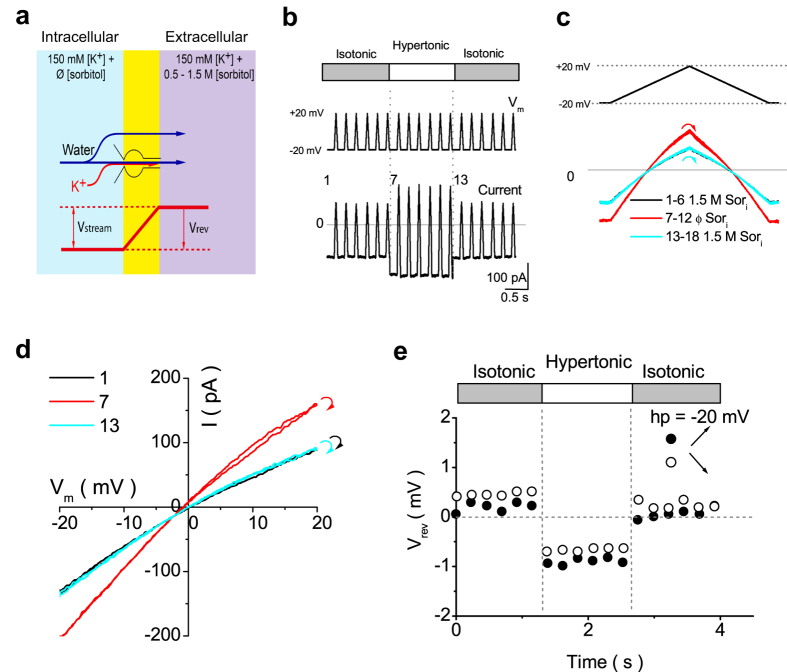
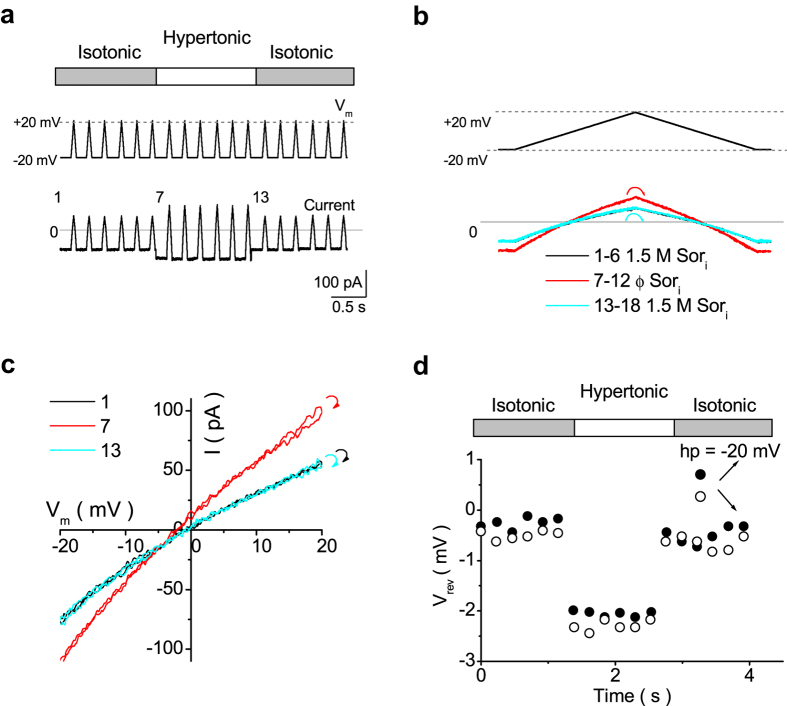
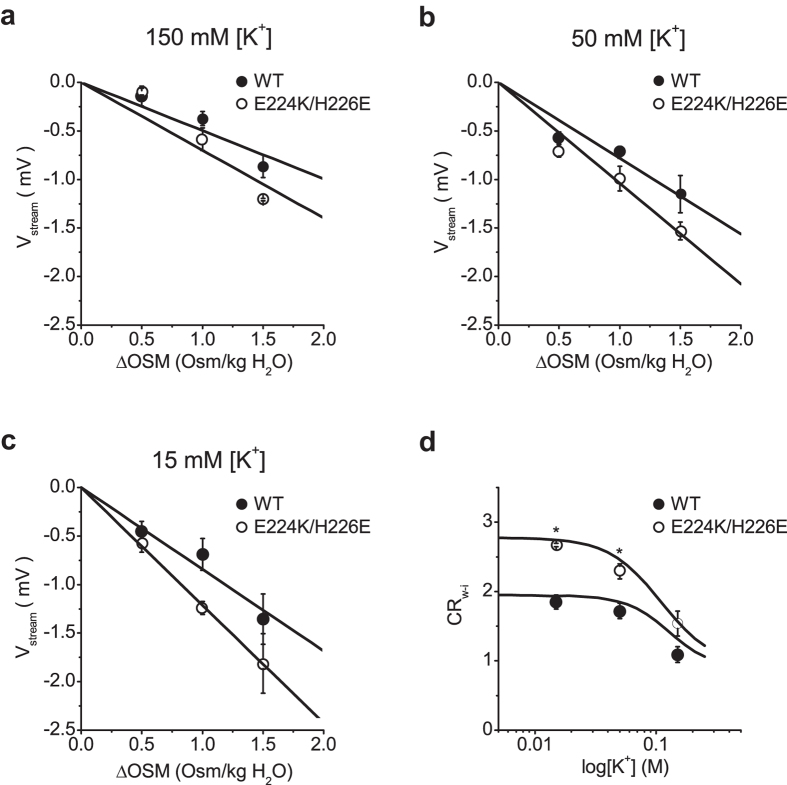
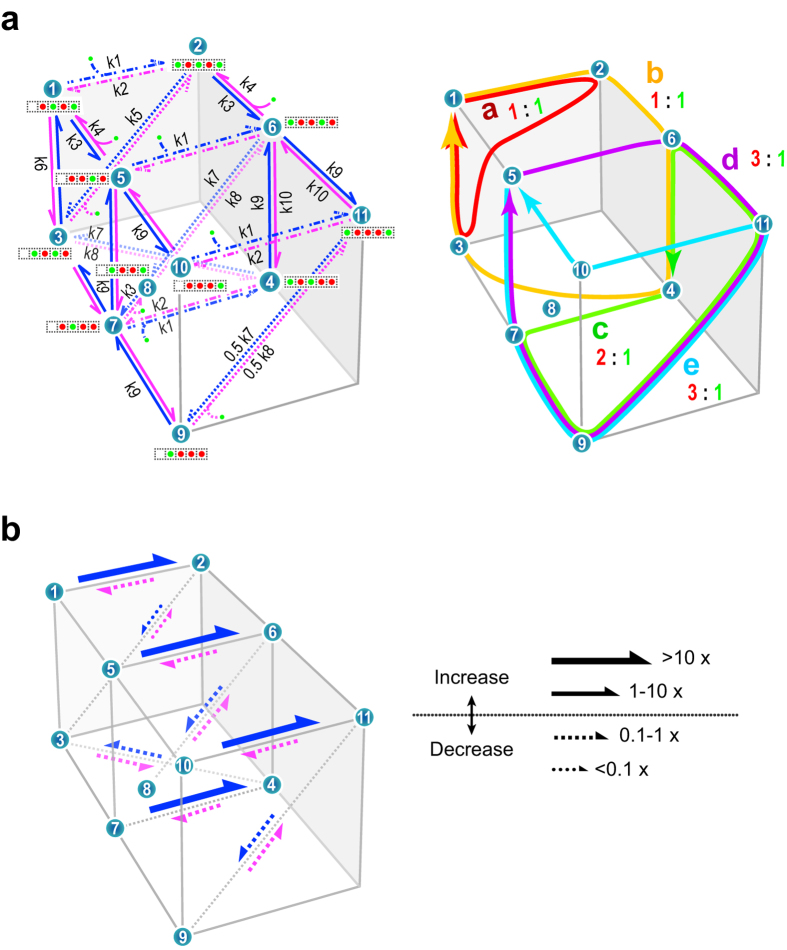
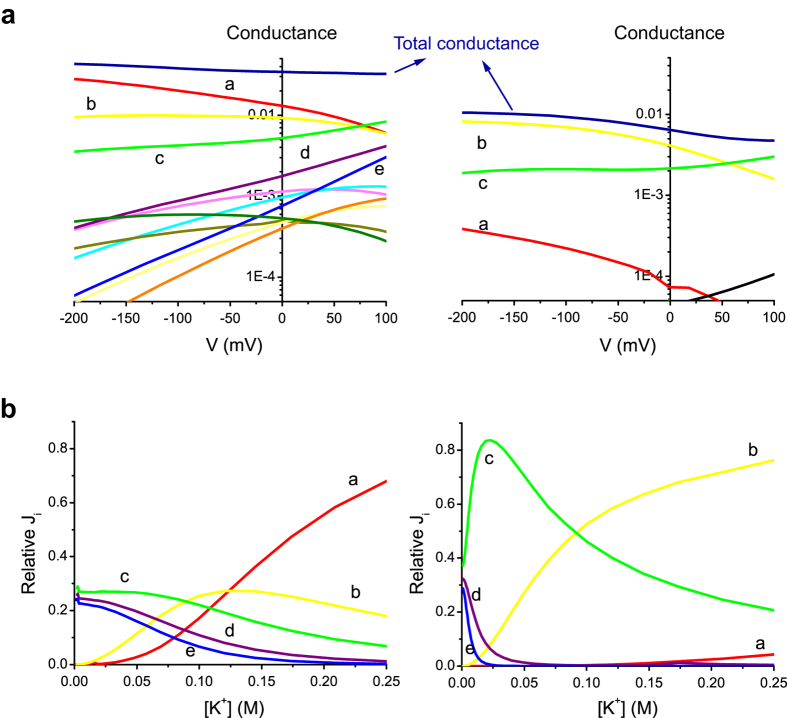
Outward currents through Kir2.1 channels regulate the electrical properties of excitable cells. These currents are subject to voltage-dependent attenuation by the binding of polyamines to high- and low-affinity sites, which leads to inward rectification, thereby controlling cell excitability. To examine the effects of positive charges at the low-affinity site in the cytoplasmic pore on inward rectification, we studied a mutant Kir channel (E224K/H226E) and measured single-channel currents and streaming potentials (Vstream), the latter provide the ratio of water to ions queued in a single-file permeation process in the selectivity filter. The water-ion coupling ratio was near one at a high K(+) concentration ([K(+)]) for the wild-type channel and increased substantially as [K(+)] decreased. On the other hand, fewer ions occupied the selectivity filter in the mutant at all [K(+)]. A model for the Kir channel involving a K(+) binding site in the wide pore was introduced. Model analyses revealed that the rate constants associated with the binding and release to and from the wide-pore K(+) binding site was modified in the mutant. These effects lead to the reduced contribution of a conventional two-ion permeation mode to total conductance, especially at positive potentials, thereby inward rectification.


Figures

Figure 1
Figure 1. Homology model of Kir2.1 channels.
(A) Construction of the model was based on a sequence alignment with the structure of a Kir2.2 channel. Two of the four subunits of the Kir2.1 channel are shown. The channel pore consists of the indicated selectivity filter, central cavity and cytoplasmic pore. Residues involved in polyamine binding are shown in ball-and-chain models and are highlighted by yellow markers.
Figure 2
Figure 2. Comparison of single-channel conductance in wild-type Kir2.1 channels and E224K/H226E mutants.
(a) Current traces and the all-point-histograms of the wild-type and the E224K/H226E mutant at the indicated voltages. At all of the voltages tested, the single-channel current (i, left panels) was smaller in the mutant than in the wild-type channel. However, the probability of the opening of the E224K/H226E channel (right panels) did not seem to be different from that of the wild-type channel. (b) Single-channel current−voltage (i-Vm) relationships at varying K+ concentrations. At low K+ concentrations, the current−voltage curve displays strong inward rectification in the E224K/H226 mutant and mild inward rectification in the wild-type. Symbols (squares, circles and triangles) represent experimental data, and the lines depict the model’s fit to the data. n = 2–6 for both the wild-type and mutant. (c) The [K+]-dependence of the single-channel conductance at −100 mV. The broken lines and solid lines are the fit of the Michaelis-Menten equation and the permeation model (Fig. 6), respectively, to the data with the value at 300 mM as the maximum.
Figure 3
Figure 3. Measurements of Vstream in the wild-type Kir2.1 channel.
(a) The experimental configuration of the coupled water-K+ movement and the resultant negative shift of Vrev when the intracellular osmotic pressure is lower than the extracellular osmotic pressure. (b) Voltage protocol and a set of representative current traces. From a holding potential (hp) of −20 mV, a train of ramp voltage (−20 to +20 mV, rate of change 1 mV/ms) was applied before, during, and after the osmotic pulse. (c) The enlargement of a ramp set (positive and negative ramps) and current traces. Currents recorded under the same intracellular sorbitol concentration (Sori) overlapped with one another. The current−voltage curves obtained from the negative and positive ramps were nearly identical to each other, and the two traces crossed at the same Vrev. (d) Current−voltage relationships (of both ramp branches) at ramp 1, 7 and 13. The curved arrows at the end of the data at +20 mV indicate the transition from the positive to negative ramp. e. The time course of Vrev. Filled and open circles denote data obtained from the positive (●) and negative ramps (○), respectively. The average Vstream values are −1.57± 0.26 mV at 15 mM [K+], with ΔOsm = 1.5 M.
Figure 4
Figure 4. Measurement of Vstream in the E224K/H226E mutant.
(a) Ramp protocol and a set of representative current traces. (b) The enlargement of a ramp set and current traces. Currents recorded under the same intracellular sorbitol concentration (Sori) overlapped one another. (c) Current−voltage relationships (of both ramp branches) at ramps 1, 7 and 13. The curved arrows at the end of the data at +20 mV indicate the transitions from the positive to negative ramp. (d) The time course of Vrev. Filled and open circles denote data obtained from the positive (●) and negative ramps (○).
Figure 5
Figure 5. Dependence of Vstream on ΔOsm and [K+].
(a) The two Vstream – ΔOsm relationships were linear, with slope values of −0.63 ± 0.02 (mean ± standard error) and −0.83 ± 0.07 mV/Osm/kg in the wild-type and the mutant, respectively, at 150 mM [K+]. The line appeared to be steeper in the mutant than in the wild type, although there was no significant difference between the two regression lines (p = 0.07). (b) At 50 mM [K+], the two slope values were significantly different, with −0.82 ± 0.01 in the wild-type and −1.08 ± 0.02 mV/Osm/kg in the mutant (p < 0.05). (c) At 15 mM [K+], the slope value further increased, to −0.98 ± 0.07 and −1.35 ± 0.03 mV/Osm/kg for the wild-type and the mutant, respectively. The two slopes were significantly different (p < 0.05). (d) The relationship between CRw-i and log[K+]. The CRw-i value decreased from 2.15 ± 0.15 at 15 mM [K+] to 1.39 ± 0.04 at 150 mM [K+] (1.80 ± 0.03 at 50 mM [K+]) for the wild-type channel. The CRw-i values for the E224K/H226E mutant changed from 2.98 ± 0.07 at 15 mM [K+] to 1.84 ± 0.15 at 150 mM [K+] (2.37 ± 0.04 at 50 mM [K+]). The black curves were calculated from the model using cycle flux algebra. n = 3 to 6 for wild type; 3 to 4 for E224K/H226E.
Figure 6
Figure 6. Permeation model, parameters and permeation features for the wild-type and mutant channels.
(a) Left panel: The eleven-state permeation diagram for K+ (green circle) and water (red circle) permeation through a Kir2.1 channel (left side, intracellular). Each green channel cartoon represents a K+-water-occupied state in the selectivity filter and cytoplasmic pore. Arrows denote states transitions, which accompany shift movements of K+-water columns. Blue and magenta arrows indicate transitions for the efflux and influx, respectively. Curved lines represent K+ entering from either side to the cavity or the selectivity filter, while curved arrows represent K+ exiting from them. k1 through k10 represent the rate constants for the state transitions. Right panel: Cyclic paths on the permeation diagram. Each cycle was drawn by connecting states, and by completing a cycle, a net transport of K+ and water occurred. In each cycle, the ratio of the coupled movements of water (red number) and K+ (green number) molecules is indicated. For example, cycle a exhibits a coupling ratio of 1:1 and cycle c, 2:1. (b) The affected path and the degree of modification of rate constants in the mutant channel. Solid arrows indicate transition paths with increased rate constants, whereas broken arrows indicate those with decreased rate constants.
Figure 7
Figure 7. Permeation features for the wild-type and mutant channels.
(a) The conductance of the wild-type (left) and mutant (right) channels as a function of the membrane potential at 150 mM K+. The total conductance is nearly flat for the wild-type channel, but it is attenuated at the positive potentials or inward-rectified for the mutant channel. In the wild-type channel, the underlying conductances of the cycle fluxes indicate that the voltage-dependent increasing (cycle c) and decreasing (cycle a and b) cycles compensate for yielding a nearly constant conductance. In the mutant channel, cycle a is attenuated substantially, and the remaining cycles b and c generate attenuated conductance at positive potentials. (b) The relative flux contributions to conductance by various cycles in the wild-type (left) and mutant (right) channels at various [K+].

Similar articles

Cited by

References

    1. Constanti A. & Galvan M. Fast inward-rectifying current accounts for anomalous rectification in olfactory cortex neurones. The Journal of physiology 335, 153–178 (1983). - PMC - PubMed
    1. Hume J. R. & Uehara A. Ionic basis of the different action potential configurations of single guinea-pig atrial and ventricular myocytes. The Journal of physiology 368, 525–544 (1985). - PMC - PubMed
    1. Noble D. in The initiation of the heart beat. (Oxford University Press, 1979).
    1. Day M. et al. Dendritic excitability of mouse frontal cortex pyramidal neurons is shaped by the interaction among HCN, Kir2, and Kleak channels. J Neurosci. 25, 8776–8787 (2005). - PMC - PubMed
    1. Dhamoon A. S. et al. Unique Kir2.x properties determine regional and species differences in the cardiac inward rectifier K+ current. Circ Res 94, 1332–1339 (2004). - PubMed

Publication types

LinkOut - more resources