. 2015 Dec 18:5:18494.
doi: 10.1038/srep18494.

Using activation status of signaling pathways as mechanism-based biomarkers to predict drug sensitivity

Affiliations

Using activation status of signaling pathways as mechanism-based biomarkers to predict drug sensitivity

Alicia Amadoz et al. Sci Rep. .

Abstract

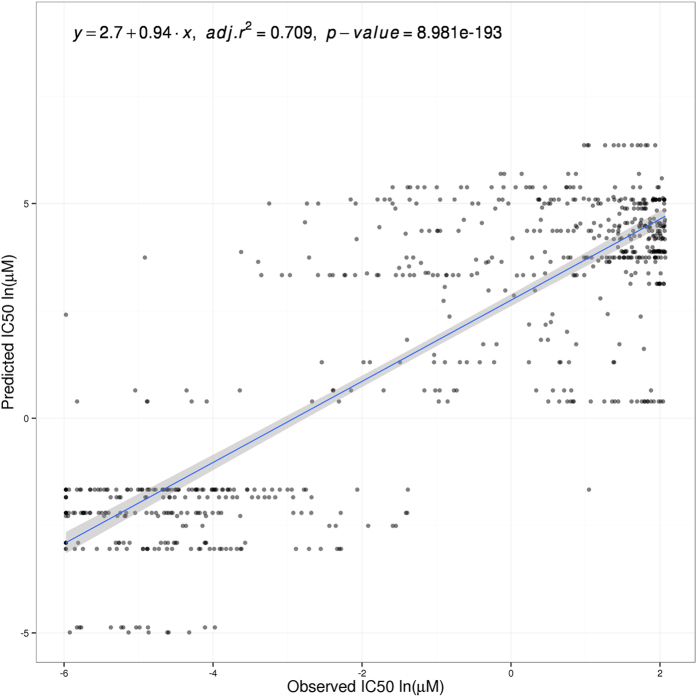
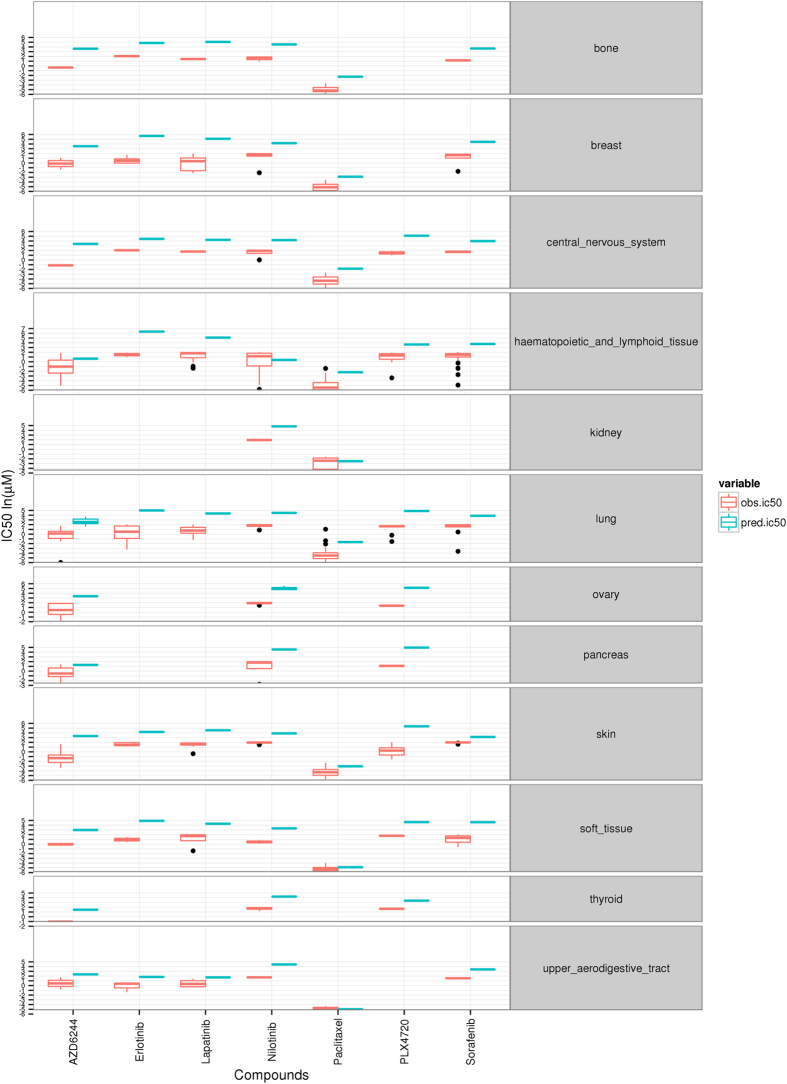
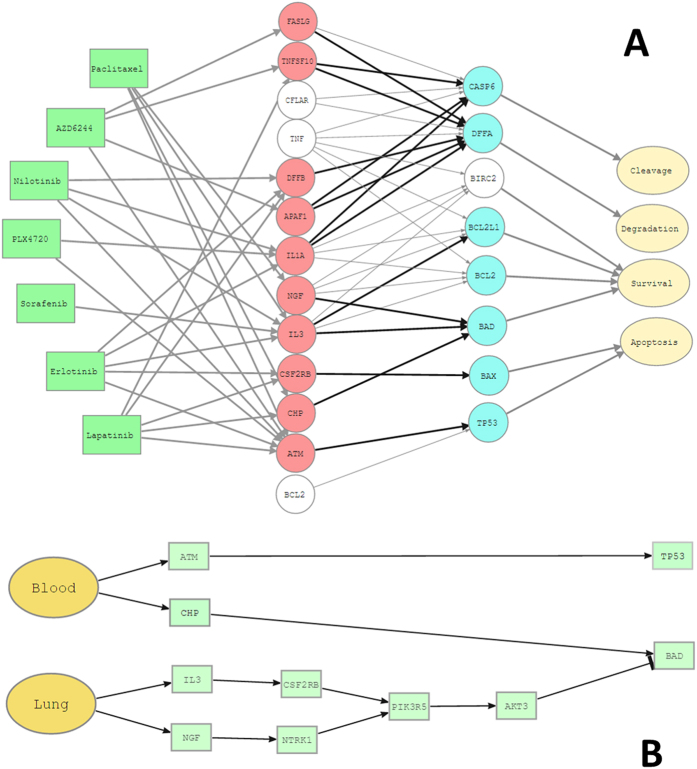
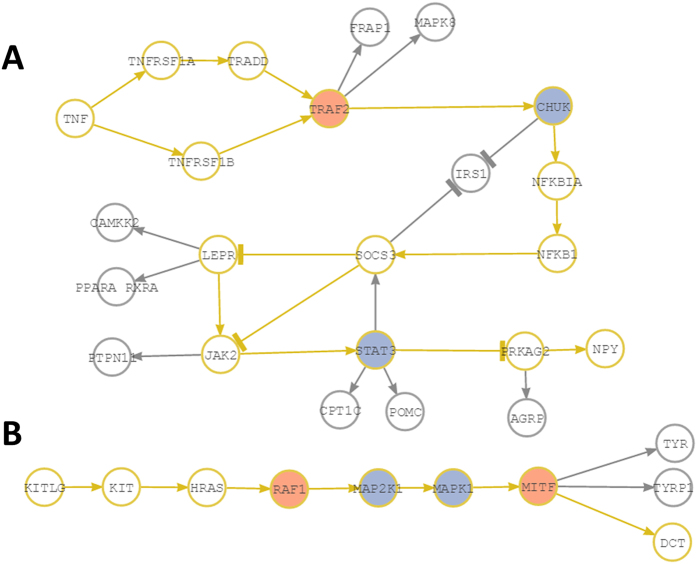
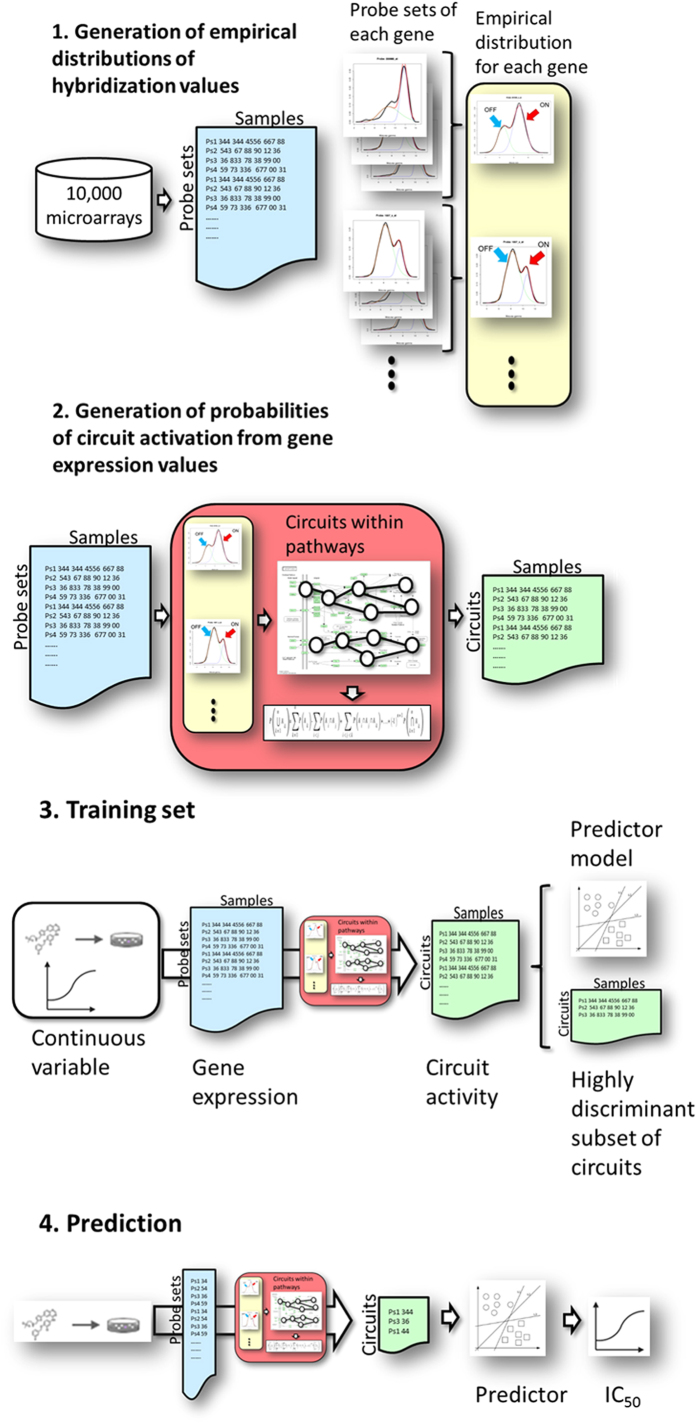
Many complex traits, as drug response, are associated with changes in biological pathways rather than being caused by single gene alterations. Here, a predictive framework is presented in which gene expression data are recoded into activity statuses of signal transduction circuits (sub-pathways within signaling pathways that connect receptor proteins to final effector proteins that trigger cell actions). Such activity values are used as features by a prediction algorithm which can efficiently predict a continuous variable such as the IC50 value. The main advantage of this prediction method is that the features selected by the predictor, the signaling circuits, are themselves rich-informative, mechanism-based biomarkers which provide insight into or drug molecular mechanisms of action (MoA).


Figures

Figure 1
Figure 1. Predicted versus actual CCLE IC50 values using signaling circuit activities as features.
Values are represented per cell line and compound (418 cell lines, 7 compounds and 6 cancers). Data values are in natural logarithm of micro-Molar units. Linear regression is specified with intercept and slope values. Adjusted R-squared and p-value are also included.
Figure 2
Figure 2. CCLE predicted and observed IC50 values per cancer and drug.
Figure 3
Figure 3. Predicted versus actual CCLE IC50 values using normalized gene expression values as features.
Values are represented per cell line and compound (418 cell lines, 7 compounds and 6 cancers). Data values are in natural logarithm of micro-Molar units. Linear regression is specified with intercept and slope values. Adjusted R-squared and p-value are also included.
Figure 4
Figure 4. Possible mechanism of action (MoA) of the different drugs in the apoptosis pathway as suggested by the signaling circuits selected by the predictor.
(A) Drugs (left in green) that act over the different circuits defined by the receptor (in red) and effector (in blue) proteins, respectively. Cell functionalities triggered by the circuits are labeled in pale yellow. The circuits not affected by any of the drugs are dimmed in gray. (B) Specific circuits over which the Paclitaxel drug acts in both Blood and Lung cancer cell lines. The circuits affected trigger survival and apoptosis.
Figure 5
Figure 5. Two examples of circuits selected by the predictor.
The circuits are represented in yellow. Arrowheads indicate activations and “T” heads indicate inhibitions. (A) Circuit TNF-NPY from the Adipocytokine signaling pathway (hsa04920). (B) Circuit SCF(KITLG)-DCT from the Melanogenesis pathway (hsa04916). Nodes in red contain proteins found to be hyperphosphorylated when comparing treated versus untreated lung cancer cells. Nodes in blue contain proteins found to be dephosphorylated in the same comparison.
Figure 6
Figure 6. Steps for the generation and use of predictors based on signaling circuit activities.
Step 1: generation of the empirical distribution of probeset values. A collection of more than 10,000 microarrays representing an enormous diversity of conditions is collected from the GEO database. For any of the probesets, an empirical distribution is derived and a mixture model is used to define the highest value peak, which corresponds to an active probe (ON), and the lowest peak that correspond to the probeset (OFF). Gene values can be obtained by summarizing the corresponding probeset values. Step 2: Given one or several microarrays, the probeset values can be contrasted with the empirical distribution values to obtain the corresponding activity probabilities which are used to derive gene activity probabilities. These, within the context of the circuits defined, are used to estimate circuit activity probabilities. Step 3: an initial training set is required to derive obtain the predictor. Gene expression values from individuals from two classes, or from different treatments (dosage, time, etc.) are obtained and transformed (as described in step 2) into the corresponding profiles of signaling activities. Then, a feature selection method obtain a sub list of highly discriminative circuits which is used to train the predictor (see below). Step 4: once the predictor is trained it can be used to predict class membership for an unknown sample (or to predict a continuous value from gene expression measurements). Gene expression values from the sample are transformed into the corresponding pattern of signaling circuit activities (see step 2) of the sample. The predictor is then used to predict the class to which most likely the sample belongs to. Identically, gene expression values of a series of conditions can be used to predict the corresponding continuous value (not shown in the figure).

References

    1. Ma Q. & Lu A. Y. Pharmacogenetics, pharmacogenomics, and individualized medicine. Pharmacol Rev 63, 437–459, 10.1124/pr.110.003533 (2011). - DOI - PubMed
    1. Staunton J. E. et al. Chemosensitivity prediction by transcriptional profiling. Proc Natl Acad Sci USA 98, 10787–10792, 10.1073/pnas.191368598 (2001). - DOI - PMC - PubMed
    1. Lee J. K. et al. A strategy for predicting the chemosensitivity of human cancers and its application to drug discovery. Proc Natl Acad Sci USA 104, 13086–13091, 10.1073/pnas.0610292104 (2007). - DOI - PMC - PubMed
    1. Mori S., Chang J. T., Andrechek E. R., Potti A. & Nevins J. R. Utilization of genomic signatures to identify phenotype-specific drugs. PLoS ONE 4, e6772, 10.1371/journal.pone.0006772 (2009). - DOI - PMC - PubMed
    1. Riddick G. et al. Predicting in vitro drug sensitivity using Random Forests. Bioinformatics 27, 220–224, 10.1093/bioinformatics/btq628 (2011). - DOI - PMC - PubMed

Publication types