. 2016 Jan;7(1):46-62.
doi: 10.1007/s13238-015-0229-2. Epub 2015 Dec 17.

A local-optimization refinement algorithm in single particle analysis for macromolecular complex with multiple rigid modules

Affiliations

A local-optimization refinement algorithm in single particle analysis for macromolecular complex with multiple rigid modules

Hong Shan et al. Protein Cell. 2016 Jan.

Abstract

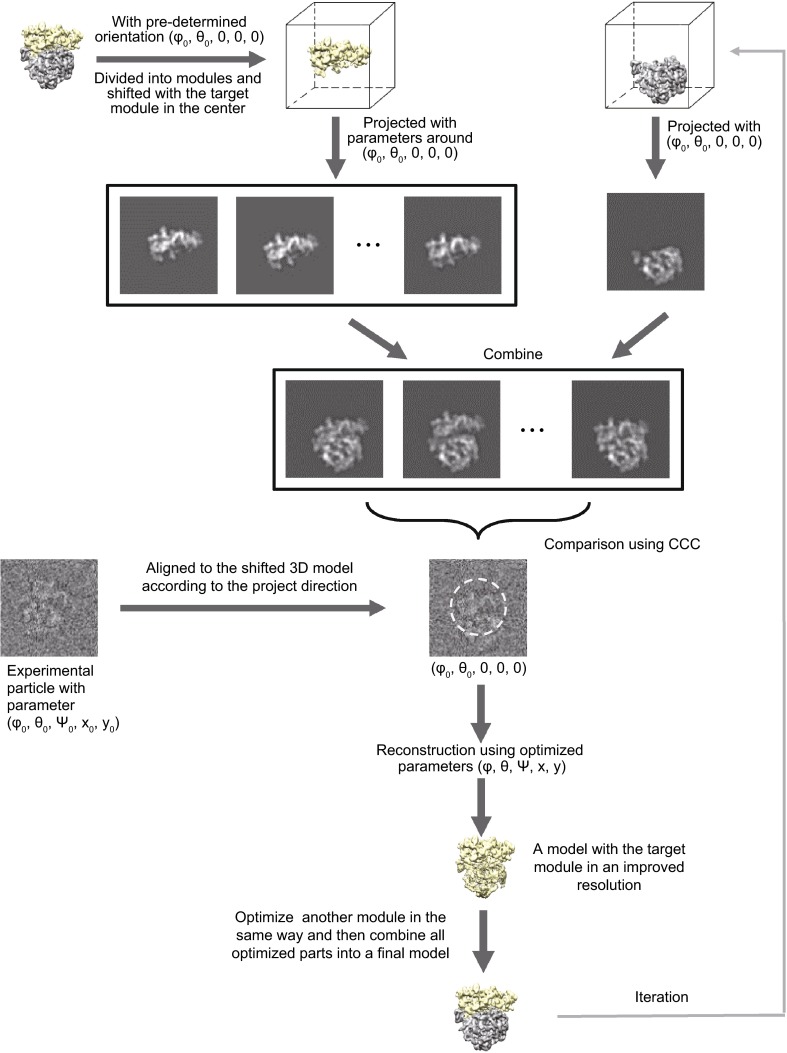
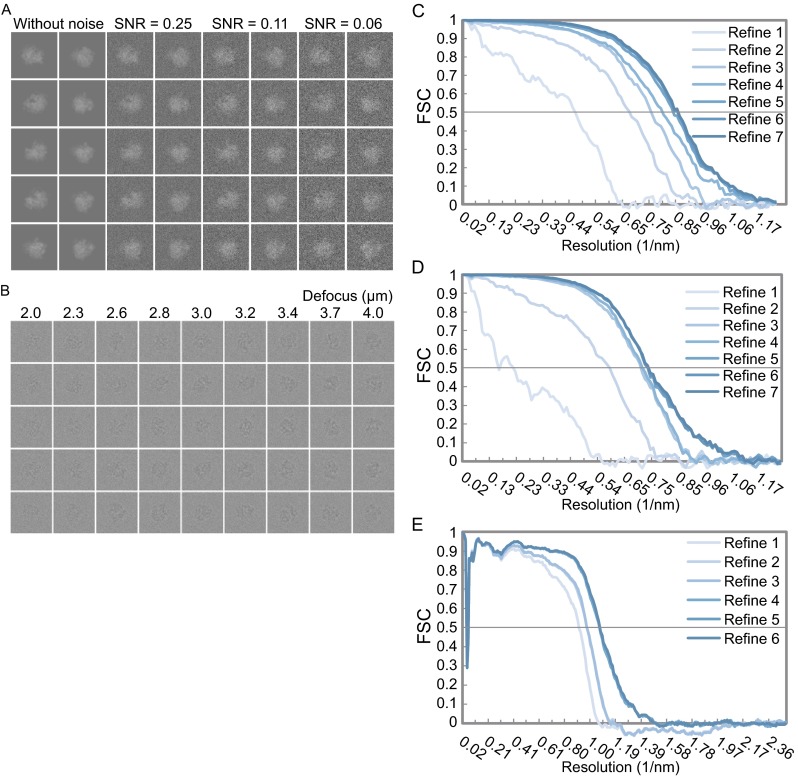
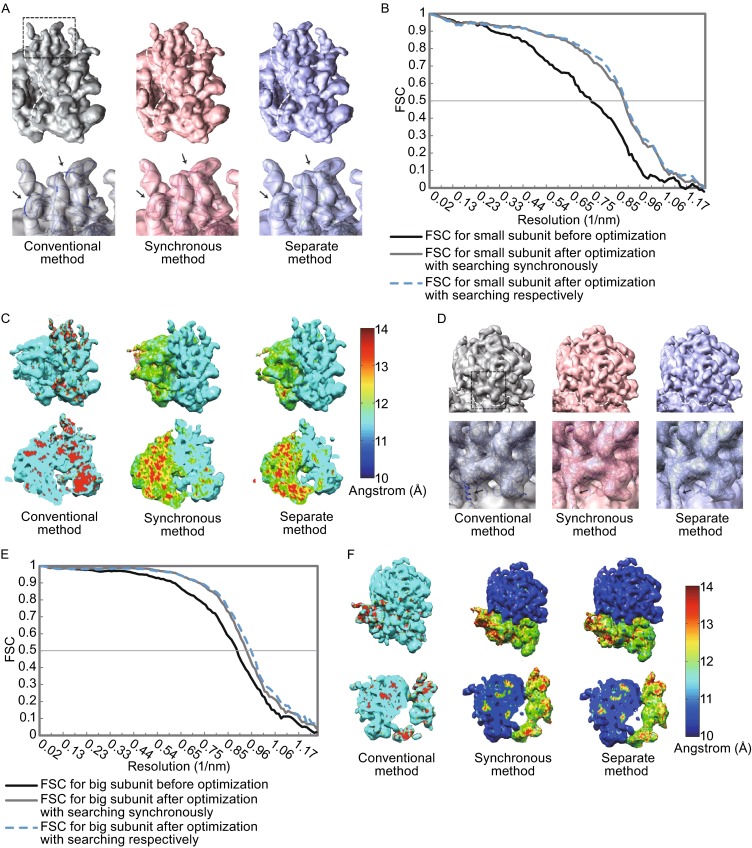
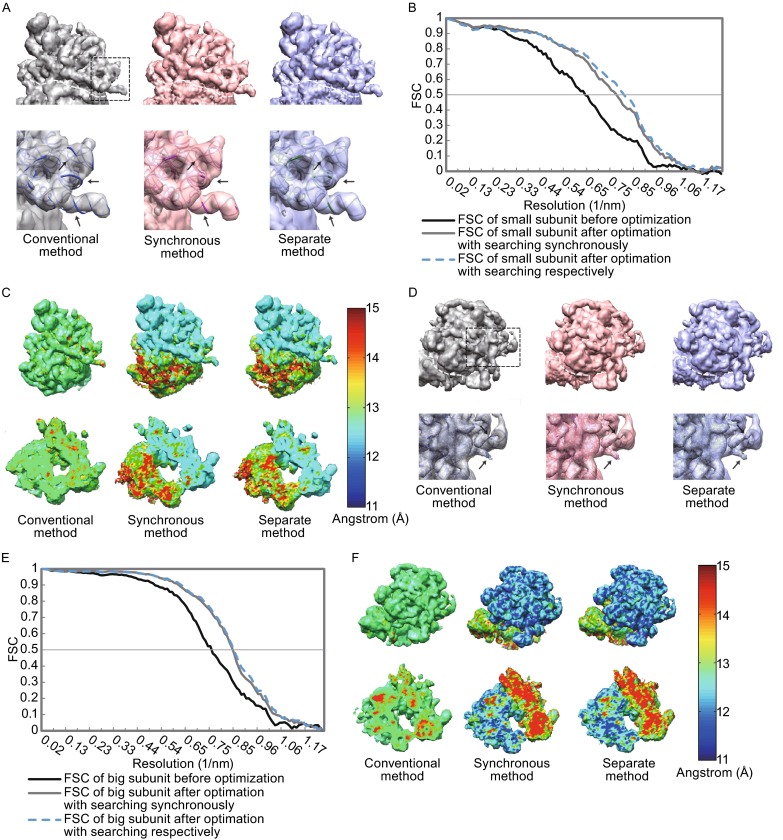
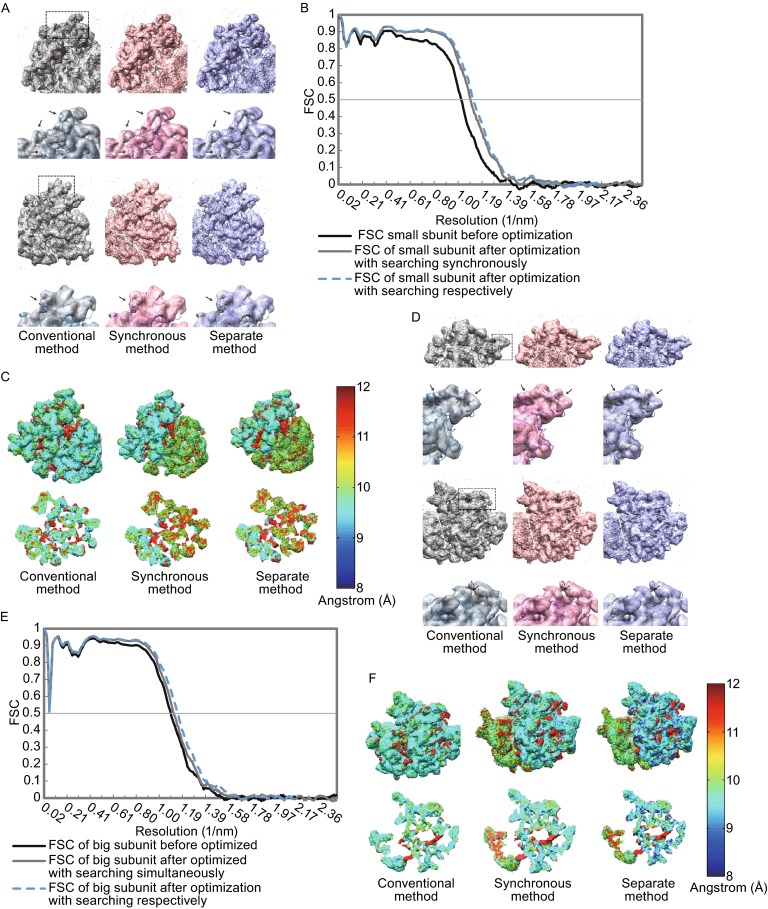
Single particle analysis, which can be regarded as an average of signals from thousands or even millions of particle projections, is an efficient method to study the three-dimensional structures of biological macromolecules. An intrinsic assumption in single particle analysis is that all the analyzed particles must have identical composition and conformation. Thus specimen heterogeneity in either composition or conformation has raised great challenges for high-resolution analysis. For particles with multiple conformations, inaccurate alignments and orientation parameters will yield an averaged map with diminished resolution and smeared density. Besides extensive classification approaches, here based on the assumption that the macromolecular complex is made up of multiple rigid modules whose relative orientations and positions are in slight fluctuation around equilibriums, we propose a new method called as local optimization refinement to address this conformational heterogeneity for an improved resolution. The key idea is to optimize the orientation and shift parameters of each rigid module and then reconstruct their three-dimensional structures individually. Using simulated data of 80S/70S ribosomes with relative fluctuations between the large (60S/50S) and the small (40S/30S) subunits, we tested this algorithm and found that the resolutions of both subunits are significantly improved. Our method provides a proof-of-principle solution for high-resolution single particle analysis of macromolecular complexes with dynamic conformations.

Keywords: conformational heterogeneity; cryo-electron microscopy; local optimization refinement; rigid module; single particle analysis.


Figures

Figure 1
Figure 1
Schematic illustration of the LO-refinement method. The model reconstructed from the last iteration of conventional SPA is split into modules. Then the model is shifted with the target module in the center. Thereafter, the target module is projected with the parameters around the preliminary determined ones while the other module is projected with the preliminary determined parameters. Then the projections are combined into a set of simulated projections. A comparison using cross correlation coefficient (CCC) between the simulated and experiment projections is performed and only the region inside the mask of the target module is counted. The refined parameters of the target module are determined with the highest CCC. A new reconstruction is performed using these newly refined parameters. The same procedure is performed for the other modules and all the refined modules are combined together to yield an update model for the next iteration
Figure 2
Figure 2
Coordinate system used for searching the optimized orientation of the target module. (A) Definition of the position and orientation of a moving camera in the coordinate system with the object fixed at the origin. The camera plane is assumed perpendicular to the projection direction (OB). Therefore, the position of the camera can be defined by the angle pair (φ, θ) or the spherical unit vector e r, and its relative in-plane rotation can be defined by the angle ψ between the camera and the meridian (AB). (B) With the preliminary projection direction of OB, the search range of the camera direction is defined by a cone with the semi-angle α0 around the preliminary direction OB. When the position of the camera changes from B to C, the direct way for the camera’s moving is along the great arc BC by keeping its angle with the arc unchanged (parallel condition) during move. The difference between the relative in-plane rotation angles ψ0 and ψi is equal to the difference between the angles of ∠DCE and ∠DBE
Figure 3
Figure 3
Diagram showing the local optimization procedures with two different strategies. (A) The procedure for searching the shift (x, y) and angle parameters (φ, θ, ψ) simultaneously and exhaustively. (B) The procedure for searching the shift (x, y) and angle parameters (φ, θ, ψ) separately
Figure 4
Figure 4
Simulated datasets and their FSC convergences during reconstruction refinements by conventional SPA procedure. (A) Every two columns represent the simulated projections of artificial ribosome with Gaussian noise added in different SNR levels. The left two columns represent the original projections. (B) Simulated projections of artificial ribosome generated from InSilicoTEM (Vulovic et al., 2013) in different defocus from −2.0 μm to −4.0 μm. (C), (D) and (E) The FSC curves of those simulated datasets ((C) is for the dataset in (A) with SNR of 0.25, (D) for the one in (A) with SNR of 0.11 and (E) for the one in (B)) during reconstruction refinement iterations by conventional SPA procedure. The FSC was calculated between the reconstructed map and the ground-truth map generated from PDB files (PDB code 4V7H for the datasets with Gaussian noise in (A), and PDB codes 4V7C for the dataset generated from InSilicoTEM in (B)). The final assessed resolutions at FSC = 0.5 by the conventional SPA procedure are indicated and also shown in Table 1
Figure 5
Figure 5
The improvement by the LO-refinement procedure for the dataset with Gaussian noise of SNR = 0.25. All the density maps for comparison are shown in the same threshold. (A) Comparison of the small subunit maps reconstructed from conventional SPA procedure (left in grey), LO-refinement procedure with the simultaneous parameter-searching strategy (middle in red, see also Fig. 3A) and the LO-refinement procedure with the separate parameter-searching strategy (right in blue, see also Fig. 3B). Top, 3D density maps of small subunits and the edges between small and large subunits are depicted with white dashed lines. Bottom, a zoom-in view of the reconstructed small subunit at the area indicated with the black dashed lines on the top. The maps are corrected with EM-BFACTOR (Fernandez et al., 2008) to 11.1 Å for emphasizing the information near the target resolution and then fitted with the crystal structures. The improvements of the density quality after LO-refinement are indicated with black arrows. (B) The FSC curves between the reconstructed map of the small subunit and the ground-truth map generated from the PDB file (PDB entry 4V7H). (C) Local resolution analysis of the reconstructed density map. The map (up row) is colored according to the corresponded local resolution that is computed by ResMap (Kucukelbir et al., 2014). One representative slice of the map with local resolution colored is shown below accordingly. (D) Comparison of the large subunit maps reconstructed from conventional SPA procedure (left in grey), LO-refinement procedure with the simultaneous parameter-searching strategy (middle in red, see also Fig. 3A) and the LO-refinement procedure with the separate parameter-searching strategy (right in blue, see also Fig. 3B). Top, 3D density maps of large subunits and the edges between large and small subunits are depicted with white dashed lines. Bottom, a zoom-in view of the reconstructed large subunit at the area indicated with the black dashed lines on the top. The maps are corrected with EM-BFACTOR (Fernandez et al., 2008) to 10.4 Å for emphasizing the information near the target resolution and then fitted with the crystal structures. The improvements of the density quality after LO-refinement are indicated with black arrows. (E) The FSC curves between the reconstructed map of the large subunit and the ground-truth map generated from the PDB file (PDB entry 4V7H). The assessed resolutions at FSC = 0.5 by different procedures are indicated and also shown in Table 1. (F) Local resolution analysis of the reconstructed density map with the same scheme in (C)
Figure 6
Figure 6
The improvement by the LO-refinement procedure for the dataset with Gaussian noise of SNR = 0.11. The scenario is same as that in Fig. 5. In brief, (A) and (D) are the comparisons of reconstructions for small subunits (A) and large subunits (D). (B) and (E) are the corresponding FSC curves respectively. (C) and (F) are the local resolution analyzes of the reconstructed density maps. For detailed descriptions, see Fig. 5
Figure 7
Figure 7
The improvement by the LO-refinement procedure for the dataset generated by InSilicoTEM. The scenario is same as that in Fig. 5. In brief, (A) and (D) are the comparisons of reconstructions in different views for small subunits (A) and large subunits (D). (B) and (E) are the corresponding FSC curves respectively. (C) and (F) are the local resolution analyzes of the reconstructed density maps. Differently, the ground-truth structures here are from another PDB file (PDB entry 3J5T) for the small subunit (A and B) and the one (PDB entry 3J5U) for the large subunit (D and E). The maps at the second and fourth row in (A) and (D) are corrected with EM-BFACTOR (Fernandez et al., 2008) to 8.9 Å and 8.7 Å respectively for emphasizing the information near the target resolution. The significant fluctuations in the low frequency part of FSC curves in (B) and (E) are due to the oscillation of contrast transfer function. For detailed descriptions, see Fig. 5

References

    1. Azubel M, Wolf SG, Sperling J, Sperling R. Three-dimensional structure of the native spliceosome by cryo-electron microscopy. Mol Cell. 2004;15:833–839. doi: 10.1016/j.molcel.2004.07.022. - DOI - PubMed
    1. Bai XC, Fernandez IS, McMullan G, Scheres SHW. Ribosome structures to near-atomic resolution from thirty thousand cryo-EM particles. Elife. 2013;2:e00461. doi: 10.7554/eLife.00461. - DOI - PMC - PubMed
    1. Bangliang S, Yiheng Z, Lihui P, Danya Y, Baofen Z. The use of simultaneous iterative reconstruction technique for electrical capacitance tomography. Chem Eng J. 2000;77:37–41. doi: 10.1016/S1385-8947(99)00134-5. - DOI
    1. Baxter WT, Grassucci RA, Gao HX, Frank J. Determination of signal-to-noise ratios and spectral SNRs in cryo-EM low-dose imaging of molecules. J Struct Biol. 2009;166:126–132. doi: 10.1016/j.jsb.2009.02.012. - DOI - PMC - PubMed
    1. Brilot AF, Korostelev AA, Ermolenko DN, Grigorieff N. Structure of the ribosome with elongation factor G trapped in the pretranslocation state. Proc Natl Acad Sci USA. 2013;110:20994–20999. doi: 10.1073/pnas.1311423110. - DOI - PMC - PubMed

Substances