

ORBiT: Oak Ridge biosurveillance toolkit for public health dynamics
- PMID: 26679008
- PMCID: PMC4674898
- DOI: 10.1186/1471-2105-16-S17-S4
ORBiT: Oak Ridge biosurveillance toolkit for public health dynamics
Abstract
Background: The digitization of health-related information through electronic health records (EHR) and electronic healthcare reimbursement claims and the continued growth of self-reported health information through social media provides both tremendous opportunities and challenges in developing effective biosurveillance tools. With novel emerging infectious diseases being reported across different parts of the world, there is a need to build systems that can track, monitor and report such events in a timely manner. Further, it is also important to identify susceptible geographic regions and populations where emerging diseases may have a significant impact.
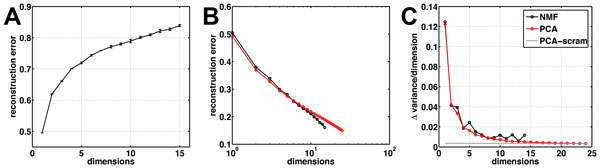
Methods: In this paper, we present an overview of Oak Ridge Biosurveillance Toolkit (ORBiT), which we have developed specifically to address data analytic challenges in the realm of public health surveillance. In particular, ORBiT provides an extensible environment to pull together diverse, large-scale datasets and analyze them to identify spatial and temporal patterns for various biosurveillance-related tasks.
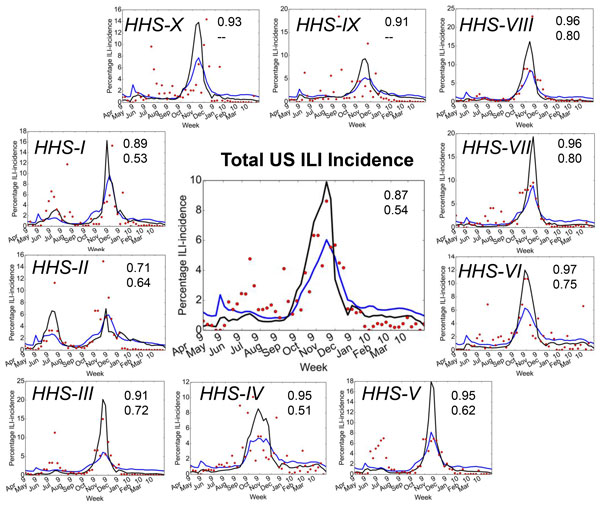
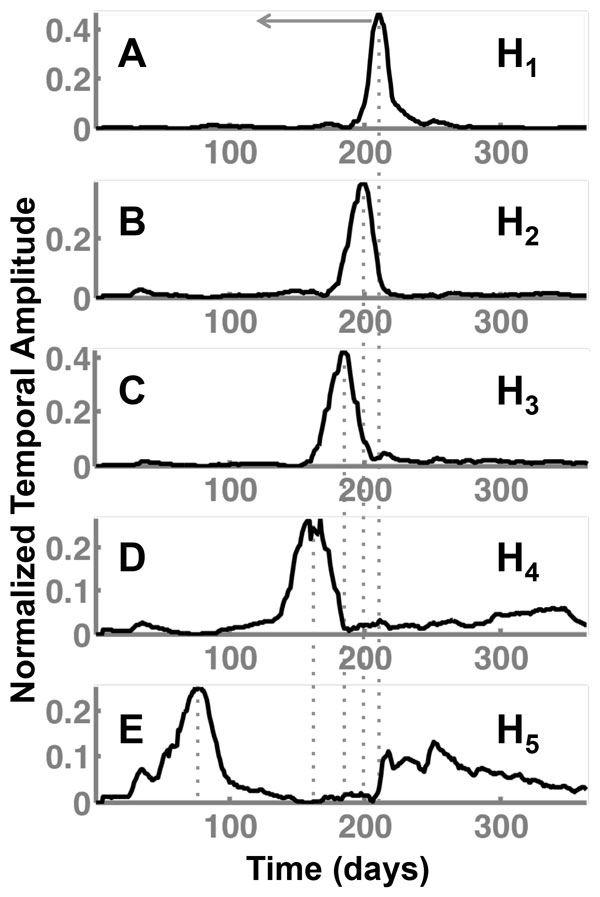
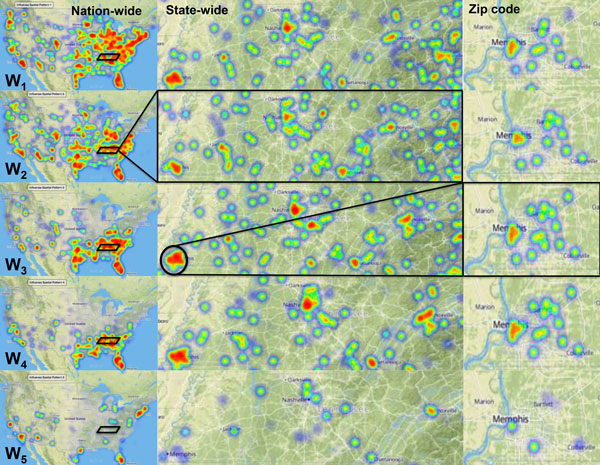
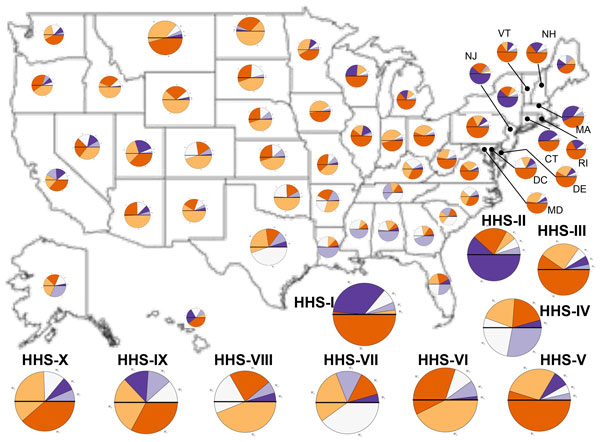
Results: We demonstrate the utility of ORBiT in automatically extracting a small number of spatial and temporal patterns during the 2009-2010 pandemic H1N1 flu season using claims data. These patterns provide quantitative insights into the dynamics of how the pandemic flu spread across different parts of the country. We discovered that the claims data exhibits multi-scale patterns from which we could identify a small number of states in the United States (US) that act as "bridge regions" contributing to one or more specific influenza spread patterns. Similar to previous studies, the patterns show that the south-eastern regions of the US were widely affected by the H1N1 flu pandemic. Several of these south-eastern states act as bridge regions, which connect the north-east and central US in terms of flu occurrences.
Conclusions: These quantitative insights show how the claims data combined with novel analytical techniques can provide important information to decision makers when an epidemic spreads throughout the country. Taken together ORBiT provides a scalable and extensible platform for public health surveillance.
Figures
Similar articles
-
Discovering Multi-Scale Co-Occurrence Patterns of Asthma and Influenza with Oak Ridge Bio-Surveillance Toolkit.Front Public Health. 2015 Aug 3;3:182. doi: 10.3389/fpubh.2015.00182. eCollection 2015. Front Public Health. 2015. PMID: 26284230 Free PMC article.
-
Effective detection of the 2009 H1N1 influenza pandemic in U.S. Veterans Affairs medical centers using a national electronic biosurveillance system.PLoS One. 2010 Mar 4;5(3):e9533. doi: 10.1371/journal.pone.0009533. PLoS One. 2010. PMID: 20209055 Free PMC article.
-
Event-based biosurveillance of respiratory disease in Mexico, 2007-2009: connection to the 2009 influenza A(H1N1) pandemic?Euro Surveill. 2010 Jul 29;15(30):19626. Euro Surveill. 2010. PMID: 20684815
-
Historical and clinical aspects of the 1918 H1N1 pandemic in the United States.Virology. 2019 Jan 15;527:32-37. doi: 10.1016/j.virol.2018.10.019. Epub 2018 Nov 16. Virology. 2019. PMID: 30453209 Review.
-
A review of evaluations of electronic event-based biosurveillance systems.PLoS One. 2014 Oct 20;9(10):e111222. doi: 10.1371/journal.pone.0111222. eCollection 2014. PLoS One. 2014. PMID: 25329886 Free PMC article. Review.
Cited by
-
Discovering Multi-Scale Co-Occurrence Patterns of Asthma and Influenza with Oak Ridge Bio-Surveillance Toolkit.Front Public Health. 2015 Aug 3;3:182. doi: 10.3389/fpubh.2015.00182. eCollection 2015. Front Public Health. 2015. PMID: 26284230 Free PMC article.
-
A systematic review of spatial decision support systems in public health informatics supporting the identification of high risk areas for zoonotic disease outbreaks.Int J Health Geogr. 2018 Oct 30;17(1):38. doi: 10.1186/s12942-018-0157-5. Int J Health Geogr. 2018. PMID: 30376842 Free PMC article.
References
-
- Jamison DT, Breman JG, Measham AR, Alleyne G, Claeson M, Evans DB, Disease Control Priorities in Developing Countries. World Bank, Washington DC; 2006. - PubMed
-
- Gatherer D. The 2014 Ebola virus disease outbreak in West Africa. J Gen Virol. 2014;95(Pt 8):1619–1624. - PubMed
-
- Bradley CA, Rolka H, Walker DW, Loonsk J. BioSense: implementation of a national early event detection and situational awareness system. Biosense Morb Mor Wkly Rep. 2005;54(Suppl):11–19. - PubMed
-
- Mawudeku A, Blench M, Boily L, St. John R, Andraghetti R, Ruben M. The Global Public Health Intelligence Network. John Wiley and Sons; 2013. pp. 457–469.
Publication types
MeSH terms
LinkOut - more resources
Full Text Sources
