. 2016 Mar;37(3):1103-19.
doi: 10.1002/hbm.23090. Epub 2015 Dec 17.

In vivo MRI signatures of hippocampal subfield pathology in intractable epilepsy

Affiliations

In vivo MRI signatures of hippocampal subfield pathology in intractable epilepsy

Maged Goubran et al. Hum Brain Mapp. 2016 Mar.

Abstract

Objectives: Our aim is to assess the subfield-specific histopathological correlates of hippocampal volume and intensity changes (T1, T2) as well as diff!usion MRI markers in TLE, and investigate the efficacy of quantitative MRI measures in predicting histopathology in vivo.

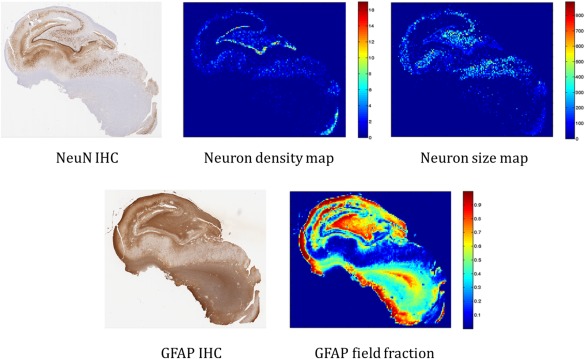
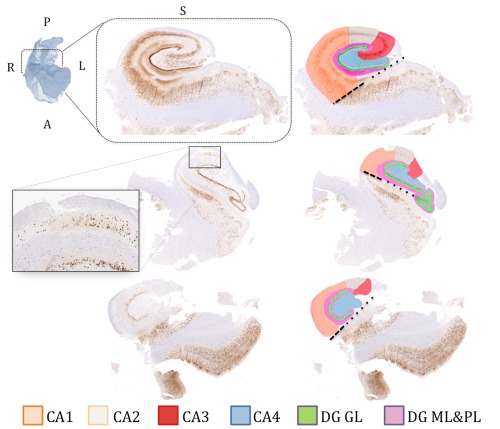
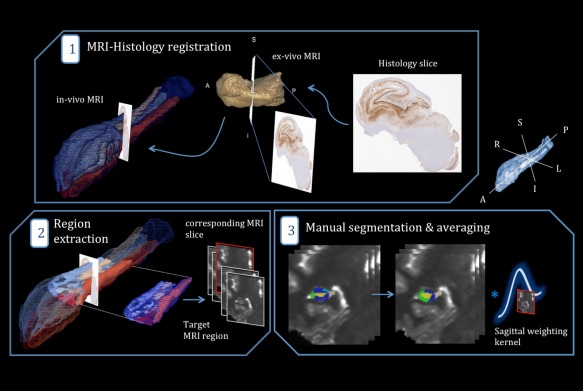
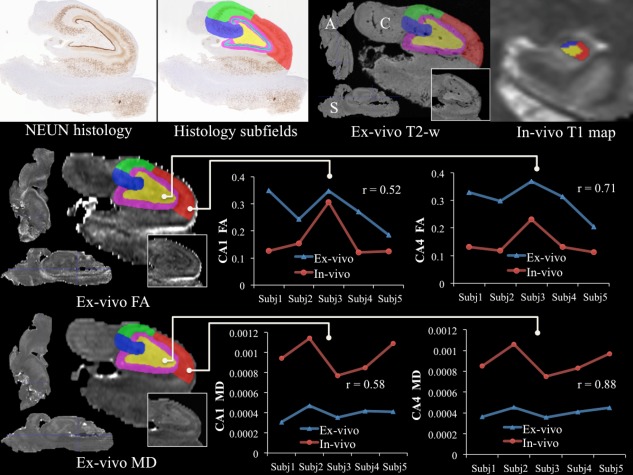
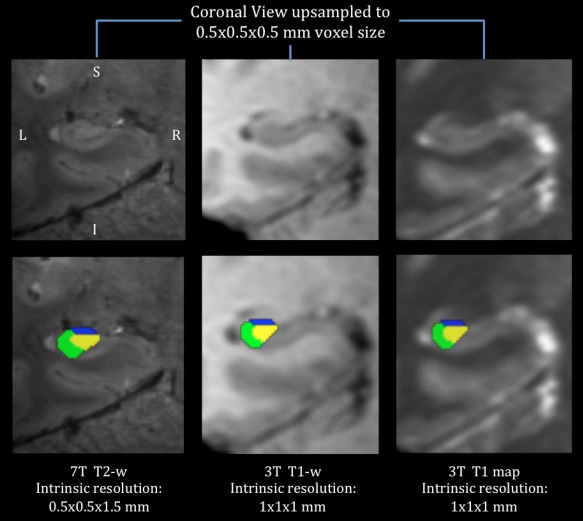
Experimental design: We correlated in vivo volumetry, T2 signal, quantitative T1 mapping, as well as diffusion MRI parameters with histological features of hippocampal sclerosis in a subfield-specific manner. We made use of on an advanced co-registration pipeline that provided a seamless integration of preoperative 3 T MRI with postoperative histopathological data, on which metrics of cell loss and gliosis were quantitatively assessed in CA1, CA2/3, and CA4/DG.

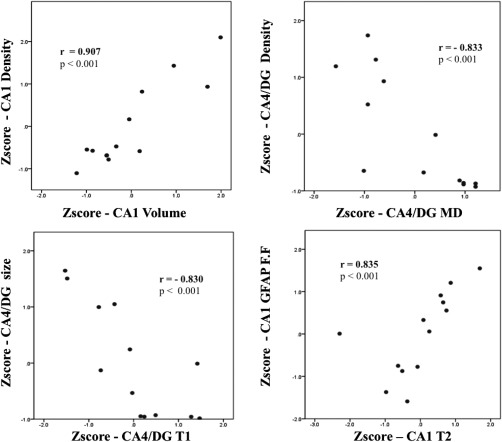
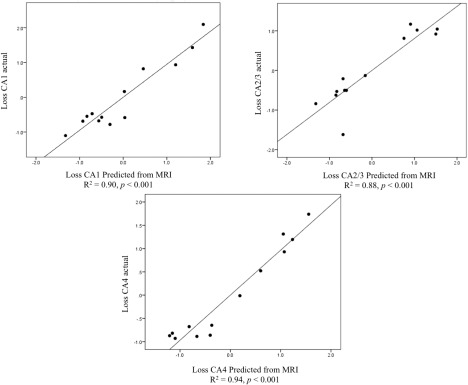
Principal observations: MRI volumes across all subfields were positively correlated with neuronal density and size. Higher T2 intensity related to increased GFAP fraction in CA1, while quantitative T1 and diffusion MRI parameters showed negative correlations with neuronal density in CA4 and DG. Multiple linear regression analysis revealed that in vivo multiparametric MRI can predict neuronal loss in all the analyzed subfields with up to 90% accuracy.

Conclusion: Our results, based on an accurate co-registration pipeline and a subfield-specific analysis of MRI and histology, demonstrate the potential of MRI volumetry, diffusion, and quantitative T1 as accurate in vivo biomarkers of hippocampal pathology.

Keywords: DTI; MRI; hippocampal sclerosis; hippocampal subfields; histology; temporal lobe epilepsy; volumetry.


Figures

Figure 1
Figure 1
Overview of some of the automated, quantitative histological features. Top row left: original NeuN immunohistochemistry. Top middle: quantitative neuron density map. Top right: mean neuron size map. Bottom row left: original GFAP IHC. Bottom right: quantitative GFAP field fraction. [Color figure can be viewed in the online issue, which is available at http://wileyonlinelibrary.com.]
Figure 2
Figure 2
Manual subfield delineation on histology slices (left column: without segmentations, right: with segmentations) from three patients from our cohort showing different examples across the gliosis spectrum (top: mild sclerosis, middle: moderate sclerosis, bottom: severe sclerosis). The labeling scheme (colour representing each subfield) is described at the bottom of the figure. The dashed black line represents the boundary between CA1 and subiculum, extending horizontally from the inferior border of the dentate gyrus and the hippocampal sulcus (dotted lines). CA (1‐4): cornu ammonis, DG GL: dentate gyrus granular layer, DG ML and PL: dentate gyrus molecular and polymorphic layers. [Color figure can be viewed in the online issue, which is available at http://wileyonlinelibrary.com.]
Figure 3
Figure 3
Schematic outline of MRI parameter extraction in the subfields. (1) Determination of the MRI slice best corresponding to a histology cut by employing a MRI‐histology co‐registration pipeline (with the ex vivo MRI as an intermediate step). (2) Extraction of a subject‐specific, target region surrounding the “corresponding MRI slice,” to model registration and sectioning uncertainty. (3) Manual delineation of the subfields within the chosen target region and application of a sinc sagittal weighting kernel (producing lower weighting away from the corresponding slice). [Color figure can be viewed in the online issue, which is available at http://wileyonlinelibrary.com.]
Figure 4
Figure 4
Selection of significant associations from Spearman's correlation analysis for subfield‐specific MRI parameters with histological features.
Figure 5
Figure 5
Multiple linear regression results for subfield‐specific parameters depicting predicted vs. actual percent neuron loss for each of the four CA subfields.
Figure 6
Figure 6
High‐resolution ex vivo validation of in vivo DTI measurements. The top row depicts warping of the subfields from histology to the registered ex vivo space for one subject and compares them to the in vivo subfield segmentation (A: axial, S: sagittal, C: coronal). Rows two and three demonstrate the comparison between in vivo and ex vivo DTI parameters [fractional anisotropy (FA) (middle row) and mean diffusivity (MD) (bottom row)] for both CA1 (middle) and CA4 (right). [Color figure can be viewed in the online issue, which is available at http://wileyonlinelibrary.com.]
Figure 7
Figure 7
An example subject from the 7 T validation of our 3 T hippocampal segmentation protocol, showing the higher resolution 7 T T2‐w scan (left), the 3 T T1‐w (middle) and T1 map (right) of the same slice (with the segmentations overlaid ‘bottom’). [Color figure can be viewed in the online issue, which is available at http://wileyonlinelibrary.com.]

References

    1. Adler DH, Pluta J, Kadivar S, Craige C, Gee JC, Avants BB, Yushkevich PA (2014): Histology‐derived volumetric annotation of the human hippocampal subfields in postmortem MRI. Neuroimage 84:505–523. - PMC - PubMed
    1. Al Sufiani F, Ang LC (2012): Neuropathology of temporal lobe epilepsy. Epilepsy Res Treat 2012:1–13. - PMC - PubMed
    1. Ali R, Goubran M, Choudhri O, Zeineh MM (2015): Seven‐Tesla MRI and neuroimaging biomarkers for Alzheimer's disease. Neurosurg Focus 39:E4. - PubMed
    1. Beg MF, Miller MI, Trouvé A, Younes L (2005): Computing large deformation metric mappings via geodesic flows of diffeomorphisms. Int J Comput Vis 61:139–157.
    1. Bernhardt BC, Hong SJ, Bernasconi A, Bernasconi N (2015): Magnetic resonance imaging pattern learning in temporal lobe epilepsy: Classification and prognostics. Ann Neurol 77:436–446. - PubMed

Publication types