. 2015 Dec 17:16:282.
doi: 10.1186/s13059-015-0848-1.

Transcriptome-wide RNA processing kinetics revealed using extremely short 4tU labeling

Affiliations

Transcriptome-wide RNA processing kinetics revealed using extremely short 4tU labeling

J David Barrass et al. Genome Biol. .

Abstract

Background: RNA levels detected at steady state are the consequence of multiple dynamic processes within the cell. In addition to synthesis and decay, transcripts undergo processing. Metabolic tagging with a nucleotide analog is one way of determining the relative contributions of synthesis, decay and conversion processes globally.

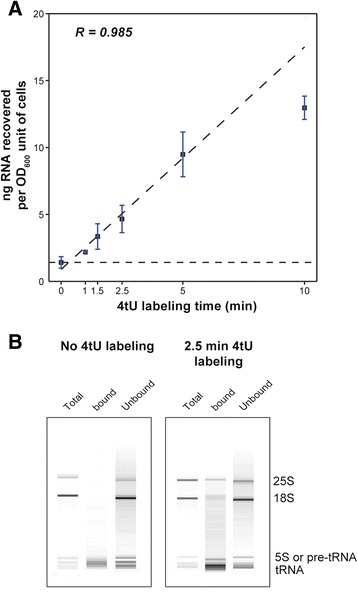
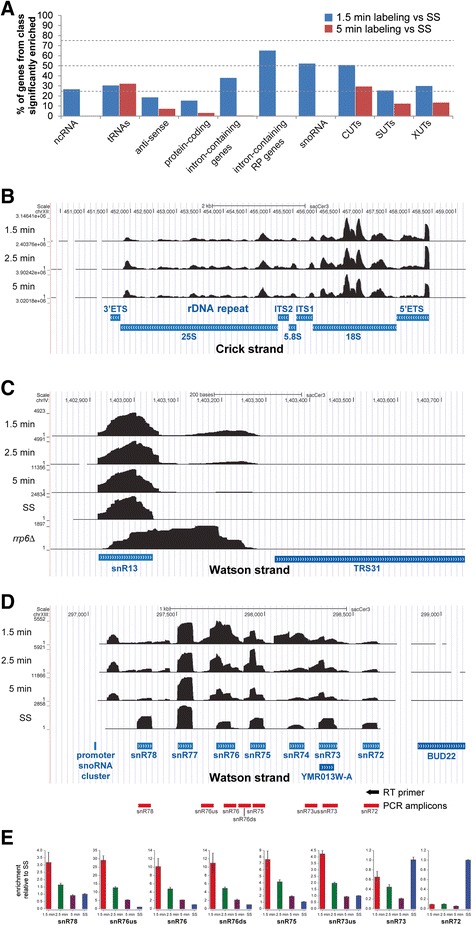
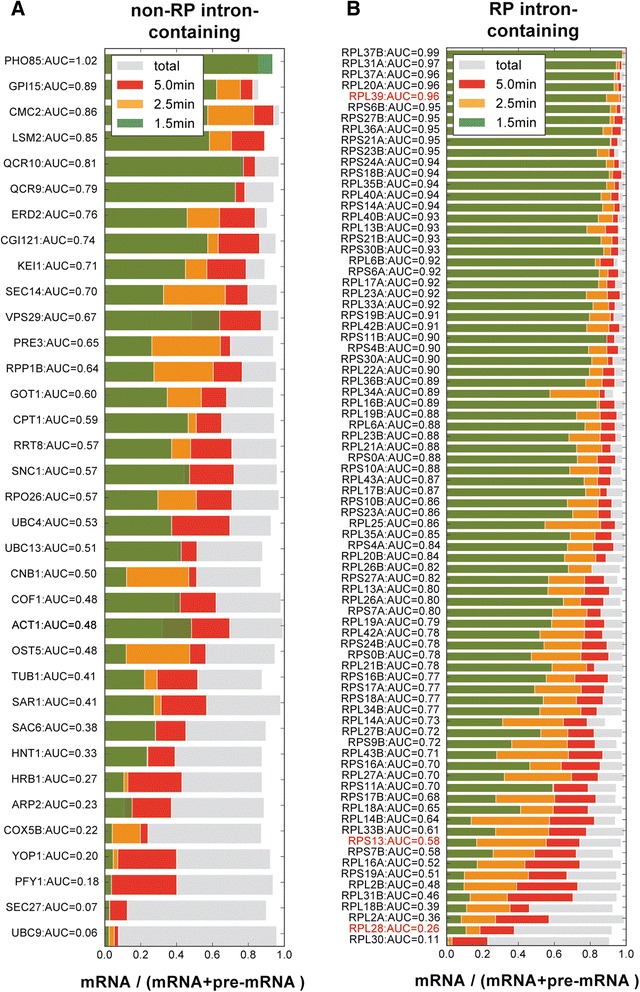
Results: By improving 4-thiouracil labeling of RNA in Saccharomyces cerevisiae we were able to isolate RNA produced during as little as 1 minute, allowing the detection of nascent pervasive transcription. Nascent RNA labeled for 1.5, 2.5 or 5 minutes was isolated and analyzed by reverse transcriptase-quantitative polymerase chain reaction and RNA sequencing. High kinetic resolution enabled detection and analysis of short-lived non-coding RNAs as well as intron-containing pre-mRNAs in wild-type yeast. From these data we measured the relative stability of pre-mRNA species with different high turnover rates and investigated potential correlations with sequence features.

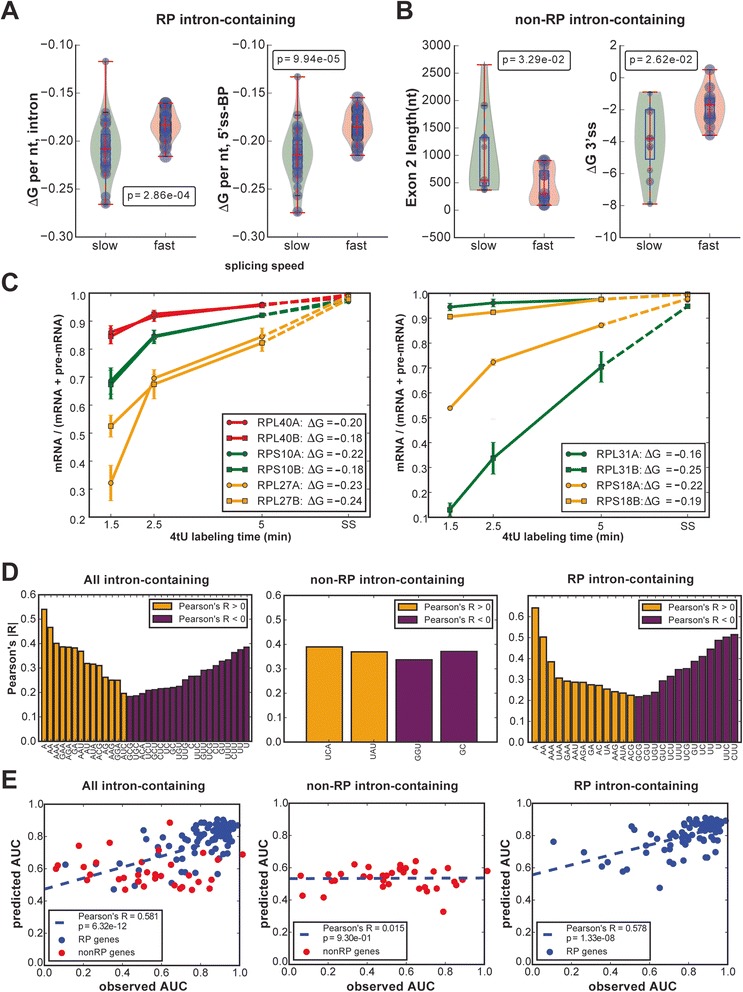
Conclusions: Our analysis of non-coding RNAs reveals a highly significant association between non-coding RNA stability, transcript length and predicted secondary structure. Our quantitative analysis of the kinetics of pre-mRNA splicing in yeast reveals that ribosomal protein transcripts are more efficiently spliced if they contain intron secondary structures that are predicted to be less stable. These data, in combination with previous results, indicate that there is an optimal range of stability of intron secondary structures that allows for rapid splicing.


Figures

Fig. 1
Fig. 1
RNA yield increases with labeling time. a Plot of total yield of RNA recovered in nanograms per OD600 unit of cells against labeling time in minutes. During the first five minutes of labeling, yield increases linearly with labeling time (R2 = 0.985). Some RNA is recovered when 4-thiouracil (4tU) is not added to the culture (0 min). This is essentially background RNA that non-specifically bound to the magnetic beads during the isolation procedure. The horizontal dashed line indicates the level of background for this experiment. The actual amounts of RNA recovered from 600 ml culture (average of two experiments; R2 = 0.960) were: 0.50 μg (0 min), 0.77 μg (1 min), 1.16 μg (1.5 min), 3.30 μg (5 min) and 4.52 μg (10 min). b Agilent Bioanalyzer trace demonstrating the qualitative differences between the different fractions produced during the isolation of newly synthesized RNA. The left panel displays the results when no 4tU is added while the right panel shows 2.5 min labeling. The nonspecific background can be seen to be different from the total RNA comprising mostly short fragments. tRNA transfer RNA. 25S, 18S and 5S indicate mature ribosomal RNA species.
Fig. 2
Fig. 2
Short labeling times proportionally enrich unstable transcripts. a DESeq2 [19] was used to identify features significantly enriched in 4tU-seq data from short labeling times (1.5 min and 5 min) compared to total RNA. The figure displays the percentage of transcripts in each category that was found to be significantly enriched (DESeq2 adjusted p < 0.05). For the DESeq analyses, all reads were considered. Thus for the intron-containing mRNAs we used reads that mapped to both introns and exons. b-d UCSC genome browser screen shots showing the change in distribution of reads at different labeling times (Y-axis), with annotation below in blue. SS indicates steady-state levels, generated by sequencing total RNA. b 4tU detects pre-rRNA precursors. Note that the total RNA sample is not shown because it was rRNA depleted. c 4tU-seq detects 3′ extended snR13 species. Data from an rrp6Δ strain are displayed for qualitative comparison. d Polycistronic precursor from which multiple snoRNAs are processed. Blue boxes represent the annotated mature snoRNAs. e Real time (RT) quantitative polymerase chain reaction (PCR) validation of the 4tU-seq results shown in (d). For the RT reaction, a reverse transcriptase primer was used that was complementary to the 3′ end of the snR72 snoRNA. This cDNA was then used to amplify the different amplicons shown below each bar plot (see the illustration in (d) for what each amplicon represents). The data were then normalized to the results obtained with rRNA-depleted total RNA (SS). 5'ETS 5' external transcribed spacer, 3' ETS 3' external transcribed spacer, 4tU 4-thiouracil, CUTs cryptic unstable transcripts, ITS internal transcribed spacer, ncRNA non-coding RNA, RP ribosomal protein, snRNA small nuclear RNA, snoRNA small nucleolar RNA, SUTs stable unannotated transcripts, tRNA transfer RNA
Fig. 3
Fig. 3
Cryptic unstable transcripts (CUTs) and stable unannotated transcripts (SUTs). a Heat map of fragments per kilobase per million reads (FPKM) at log2 scale for 887 CUTs at 1.5 min, 2.5 min, 5.0 min and steady state (SS). The hierarchical clustering is based on complete similarity between the FPKMs of two CUTs at the four time points. b The same heat map for 823 SUTs. c Comparison between log2 FPKM of 887 CUTs and 823 SUTs at 1.5 min, 2.5 min, 5.0 min and steady state. The levels of CUTs and SUTs are similar at initial time points but significantly different at steady states. d FPKM changes for three example CUTs measured by RNA-seq. e Levels of the same three CUTs relative to steady state, measured by reverse transcription quantitative polymerase chain reaction (RT-qPCR). 4tU 4-thiouracil
Fig. 4
Fig. 4
Analysis of degradation of cryptic unstable transcripts (CUTs) and stable unannotated transcripts (SUTs). a The log2 scaled ratio of CUTs fragments per kilobase per million reads (FPKM) normalized to the steady state (SS) levels. These ratios were used to quantify the degradation rate. A weighted average of the three nascent ratios was used to quantify the degradation rate, that is, the higher the ratio at the nascent points, the faster the degradation. b Comparison of features between the fastest-degrading third and slowest-degrading third of CUTs/SUTs. Features include average secondary structure free folding energy for each nucleotide, and transcript length. c SUTs are significantly longer than CUTs. Comparison of CUT and SUT transcript length distribution using the Kolmogorov–Smirnov (K–S) test. d The binary classification between the fastest-degrading third of transcripts and the slowest-degrading third of transcripts using ΔG per nucleotide (nt), transcript length, ΔG of ±15 nt around the start site and ΔG of ±15 nt around the stop site. The receiver operating characteristic (ROC) curves shows the data for the CUTs, SUTs or both with 10-folder cross-validation via a naive Bayes classifier. The area under the curve (AUC) is used to represent the prediction performance
Fig. 5
Fig. 5
The splicing speed and associated features. The mRNA proportions at 1.5 min, 2.5 min, 5.0 min and steady state for 35 non-ribosomal protein (RP) intron-containing genes (a) and 82 RP intron-containing genes (b). The proportion of mRNA is estimated using the probabilistic model described in Additional file 1: Data and Methods RNA-seq data, and the area under the curve (AUC) score denotes the splicing speed as defined in the “Methods” section. Faster splicing transcripts cluster at the top, and slower splicing transcripts at the bottom. Red transcripts were also validated by reverse-transcription quantitative polymerase chain reaction (Fig. 6). All four colored bars are overlapping
Fig. 6
Fig. 6
Reverse transcription quantitative polymerase chain reaction (RT-qPCR) analysis of splicing status shows differences between transcripts. a Diagram showing the location of diagnostic amplicons. Exons are denoted by blue boxes and the intron is represented by a black line. Amplicons are indicated by lines below. Pre-mRNAs were detected using oligonucleotides that amplify the exon–intron boundary at the 5′ splice site. b Relative pre-mRNA levels of three transcripts, RPL28, RPL39 and RPS13, analyzed by RT-qPCR, normalized relative to steady state (SS) levels. Data show how the level of each amplicon approaches the level detected at steady state as labeling time increases. Data were normalized to the levels of exon 2 and steady state to account for different RNA yields obtained at each labeling time. Different transcripts show different rates of splicing. c-e UCSC genome browser screen shots showing the change in distribution of reads at different labeling times (y-axis) for RPL28, RPL39 and RPS13, with annotation below in blue. Exons are represented by blue boxes and intron indicated by a blue line. SS indicates steady-state levels, generated by sequencing total RNA
Fig. 7
Fig. 7
Features associated with splicing speed and comparison of paralogs. a Comparison of secondary structure scores (ΔG; y-axis) for the fastest-splicing and slowest-splicing thirds of 82 ribosomal protein (RP) intron-containing genes (x-axis). The violin plots show the distribution of the features, and the blue dots represent individual RP genes, with dot size corresponding to the splicing speed. The p-value was obtained using Wilcoxon’s test. b Comparison of exon 2 length and secondary structure at the 3′ splice site (3′ss) (y-axis) for 35 non-ribosomal protein (non-RP) intron-containing genes to splicing speed (x-axis). The violin plots show the distribution of the features, and the blue dots represent individual genes, with dot size corresponding to the splicing speed. The p-value was obtained using Wilcoxon’s test. c The mRNA proportion changes of three pairs of paralogs, each pair of which show a similar splicing rate (left panel) and of three pairs of paralogs, each pair of which shows different splicing rates (right panel). The proportion of mRNA is estimated using the probabilistic model described in Additional file 1: Data and Methods from 4-thiouracil (4tU) data. The ΔG per nucleotide values (see “Methods” section) between the 5′ss and branch point are stated in the inset boxes. d Pearson’s correlations between splicing speed and sequence patterns show the significantly correlated features (p < 0.05) to splicing speeds for all 117 intron-containing genes (left panel), 35 non-RP intron-containing genes (middle panel), and 82 RP intron-containing genes (right panel). The features are the occurrence of the specific base or bases in the intron. Yellow represents positive correlation with splicing speed and purple represents negative correlation. e Scatterplot of observed and predicted splicing speeds from the associated features. The features are listed in Additional file 1: Tables S8 and S9, and include secondary structures, splice site scores, intron length and exon length. The predictions are obtained by random forest regression with automatic feature selection. AUC area under the curve

References

    1. Jensen TH, Jacquier A, Libri D. Dealing with pervasive transcription. Mol Cell. 2013;52:473–84. doi: 10.1016/j.molcel.2013.10.032. - DOI - PubMed
    1. Tuck AC, Tollervey D. RNA in pieces. Trends Genet. 2011;27:422–32. doi: 10.1016/j.tig.2011.06.001. - DOI - PubMed
    1. Yamashita A, Shichino Y, Yamamoto M. The long non-coding RNA world in yeasts. Biochim Biophys Acta. 2015. doi:10.1016/j.bbagrm.2015.08.003. - PubMed
    1. Tudek A, Candelli T, Libri D. Non-coding transcription by RNA polymerase II in yeast: Hasard or nécessité? Biochimie. 2015;117:28–36. doi: 10.1016/j.biochi.2015.04.020. - DOI - PubMed
    1. van Dijk EL, Chen CL, d'Aubenton-Carafa Y, Gourvennec S, Kwapisz M, Roche V, et al. XUTs are a class of Xrn1-sensitive antisense regulatory non-coding RNA in yeast. Nature. 2011;475:114–7. doi: 10.1038/nature10118. - DOI - PubMed

Publication types