. 2015 Dec 18:5:18542.
doi: 10.1038/srep18542.

Deformability of Tumor Cells versus Blood Cells

Affiliations

Deformability of Tumor Cells versus Blood Cells

Josephine Shaw Bagnall et al. Sci Rep. .

Abstract

The potential for circulating tumor cells (CTCs) to elucidate the process of cancer metastasis and inform clinical decision-making has made their isolation of great importance. However, CTCs are rare in the blood, and universal properties with which to identify them remain elusive. As technological advancements have made single-cell deformability measurements increasingly routine, the assessment of physical distinctions between tumor cells and blood cells may provide insight into the feasibility of deformability-based methods for identifying CTCs in patient blood. To this end, we present an initial study assessing deformability differences between tumor cells and blood cells, indicated by the length of time required for them to pass through a microfluidic constriction. Here, we demonstrate that deformability changes in tumor cells that have undergone phenotypic shifts are small compared to differences between tumor cell lines and blood cells. Additionally, in a syngeneic mouse tumor model, cells that are able to exit a tumor and enter circulation are not required to be more deformable than the cells that were first injected into the mouse. However, a limited study of metastatic prostate cancer patients provides evidence that some CTCs may be more mechanically similar to blood cells than to typical tumor cell lines.


Conflict of interest statement

The authors declare no competing financial interests.

Figures

Figure 1
Figure 1. Measuring deformability differences between tumor cells and blood cells.
The deformability of tumor cells is compared to that of blood cells of the same size. Single-cell deformability is measured by the SMR as a passage time, which is the amount of time it takes the cell to squeeze through a 6 μm wide microfluidic constriction. Simultaneously, as the cell traverses through the SMR cantilever, its buoyant mass is measured as a metric for cell size.
Figure 2
Figure 2. Deformability changes in tumor cells having undergone a phenotypic shift.
(A) FACS sorted epithelial (EpCAMhiYFPlo) and mesenchymal (EpCAMloYFPhi) populations of the MMTV-PyMT tumor cell line were cultured for two days to confirm differences in morphology prior to measurement in the SMR. Phase contrast micrographs indicate that the mesenchymal population has decreased intercellular adhesion and is more elongated than the epithelial population. (B) Passage time versus volume, comparing the epithelial and mesenchymal subpopulations of the MMTV-PyMT cell line. (C) A zoomed-in region of data from (B) with volumes greater than 1000 μm3, demonstrating a passage time ratio calculation, taking the difference in y-intercepts (Δ) as the exponent of 10 (Supplementary Methods). Here, the intercept offset is significantly different from zero (p < 2 × 10−16) based on the linear regression. (D) Phase contrast micrographs of control EP5 cells (treated with buffer) and EP5 cells treated with platelets. Cells were treated on day 0 after images were taken. Images taken on subsequent days reveal morphological changes in the platelet-treated cells undergoing an EMT-like transition. (E) SMR measurements of the buffer-treated EP5 cells and the platelet-treated EP5 cells after two days of co-incubation with platelets. (F) Passage time ratios were calculated for three replicates of each control experiment (different plates of buffer-treated EP5 cells compared to one another: Control, No EMT), three replicates of the MMTV-PyMT epithelial versus mesenchymal comparison (Spontaneous EMT), and three replicates of the buffer-treated versus platelet-treated EP5 cell comparison (Platelet Treatment). Each passage time ratio represents the passage time of the cells with an altered phenotype (EMT or co-incubation with platelets) to that of the control population. In both comparisons of mesenchymal or platelet-treated cells to control cells, the y-intercepts of the linear fits were found to be significantly different (p < 3.4 × 10−16). Error bars for each point correspond to the 95% confidence interval of the passage time ratio based on the intercept offsets of the linear fits. The shaded region is based on the extent of change seen in control experiments, and is a symmetric region drawn about a passage time ratio of 1.0, indicating no change.
Figure 3
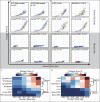
Figure 3. Passage time and buoyant mass of blood cells versus epithelial and mesenchymal cell lines.
Passage time versus buoyant mass plots demonstrate the distinct difference between tumor cell lines and blood cells, regardless of the epithelial or mesenchymal phenotype of the tumor cells. (A) The same murine cell lines (EP5, EpCAMhiYFPlo, EpCAMloYFPhi) from Fig. 2 are shown here in comparison with blood cells: human red blood cells, human peripheral blood mononuclear cells (PBMC), human polymorphonuclear (PMN) leukocytes, and a mouse lymphoblast cell line (L1210), measured under the same flow conditions (0.9 psi applied pressure). (B) Four human cancer cell lines corresponding to lung (H1975), breast (MDA-MB-231, SKBR), and prostate cancers (PC3-9) compared to blood cells: human red blood cells, human PBMC, mouse white blood cells (WBCs) and L1210 cells, under faster flow conditions (1.5 psi applied pressure) portray that the same distinction in passage time profiles. For (A,B), the dotted grid lines on the X-axis are at 10 pg and 100 pg, while dotted grid lines on the Y-axis are at 0.001 s, 0.01 s, 0.1 s, 1 s, 10 s, and 100 s. Also, the color of the scatter plots corresponds to the density of data points, with red being the highest and blue being the lowest density. (C) The passage time data in (A) for buoyant masses between 30 pg and 150 pg are placed into 6 bins based on buoyant mass (log scale). The median of the log10 values of the passage times within each bin is shown in the heat map, where color assignment is on a log scale. The passage times are grouped using agglomerative clustering, with the dendrogram shown to the right of the heat map. The reported buoyant mass bin centers and passage time values are converted from log10 values. (D) Similar to (C), the passage time data in (B) for buoyant masses between 30 pg and 180 pg are plotted in a heat map of passage time values, showing a dendrogram of the clustering to the right.
Figure 4
Figure 4. Mouse CTC deformability.
(A) Mouse lungs were imaged seven days after tail vein injection of one million 4T1-ZSGreen cells to confirm presence of metastatic lesions. (B) Mouse blood, after lysing the erythrocytes, was run through FACS to sort out tumor cells having green fluorescence, and then measured in the SMR. The red triangles indicate each signal detected by the SMR while measuring CTCs. 4T1-ZSGreen control cells kept in culture after the initial injection were run through FACS for a comparison, and are shown as gray points in the background. (C) The distributions of passage times for the 4T1-ZSGreen control cells, CTCs, and BALB/c leukocytes (same data as in Fig. 3B) are plotted for cells with a buoyant mass ranging from 40 pg to 120 pg, eliminating debris, aggregates, or stray blood cells sorted during FACS while focusing on cells large enough to interact with the constriction. The control cell line and the CTCs have similar passage time distributions (p = 0.412). P-values were obtained from two-sided Wilcoxon rank-sum tests. (D) Data from three replicates of the experiment are pooled to compare passage times in the given mass range. The heat map colors correspond to the passage time value, with the color assignments on a log scale. The binned passage time values were grouped by agglomerative clustering, with the dendrogram shown to the right of the heat map. (E) CTC data from three replicates are pooled and compared to murine tumor cell lines other than the control 4T1 cell line, including EP5, EpCAMhiYFPlo, EpCAMloYFPhi, and B16F10, evaluated under the same flow conditions (1.5 psi applied pressure). Also included for comparison are the blood cells from Fig. 3B. The passage times are plotted in the heat map and the dendrogram from clustering analysis is shown on the right. For (D,E), the reported buoyant mass bin centers and passage time values are converted from log10 values.
Figure 5
Figure 5. Human patient CTC deformability.
(A) SMR measurement of prostate cancer Patient 1 blood sample, after having been processed in the CTC-iChip. (B) Based on fluorescence images, the diameter of each CTC was converted to an approximate buoyant mass value to visualize where they fall among the data measured by the SMR as shown in (A). Each point represents one cell. (C) A sampling of fluorescence images of CTCs and a white blood cell (WBC) taken from the same prostate cancer patient sample after it was measured in the SMR. (D) SMR measurement of prostate cancer Patient 2 blood sample, after having been processed in the CTC-iChip. (E) Based on fluorescence images, the diameter of each CTC was converted to an approximate buoyant mass value. Each point represents one cell. (F) A sampling of fluorescence images of CTCs and a WBC from the same patient sample. False color overlays were applied for composite fluorescence images.

References

    1. Allard W. J. et al. Tumor cells circulate in the peripheral blood of all major carcinomas but not in healthy subjects or patients with nonmalignant diseases. Clin. Cancer Res. 10, 6897–904 (2004). - PubMed
    1. Alix-Panabieŕes C. & Pantel K. Circulating tumor cells: Liquid biopsy of cancer. Clin. Chem. 59, 110–118 (2013). - PubMed
    1. Yu M., Stott S., Toner M., Maheswaran S. & Haber D. A. Circulating tumor cells: approaches to isolation and characterization. J. Cell Biol. 192, 373–82 (2011). - PMC - PubMed
    1. Alunni-fabbroni M. & Teresa M. Circulating tumour cells in clinical practice: Methods of detection and possible characterization. Methods 50, 289–297 (2010). - PubMed
    1. Nagrath S. et al. Isolation of rare circulating tumour cells in cancer patients by microchip technology. Nature 450, 1235–9 (2007). - PMC - PubMed

Publication types