. 2015 Dec 18:6:10181.
doi: 10.1038/ncomms10181.

Rabphilin 3A retains NMDA receptors at synaptic sites through interaction with GluN2A/PSD-95 complex

Affiliations

Rabphilin 3A retains NMDA receptors at synaptic sites through interaction with GluN2A/PSD-95 complex

Jennifer Stanic et al. Nat Commun. .

Abstract

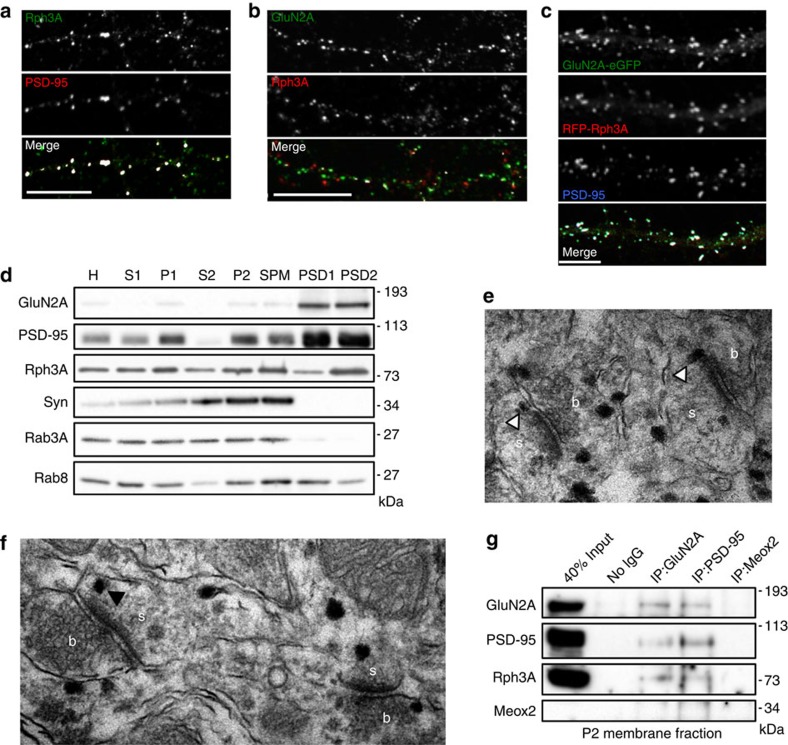
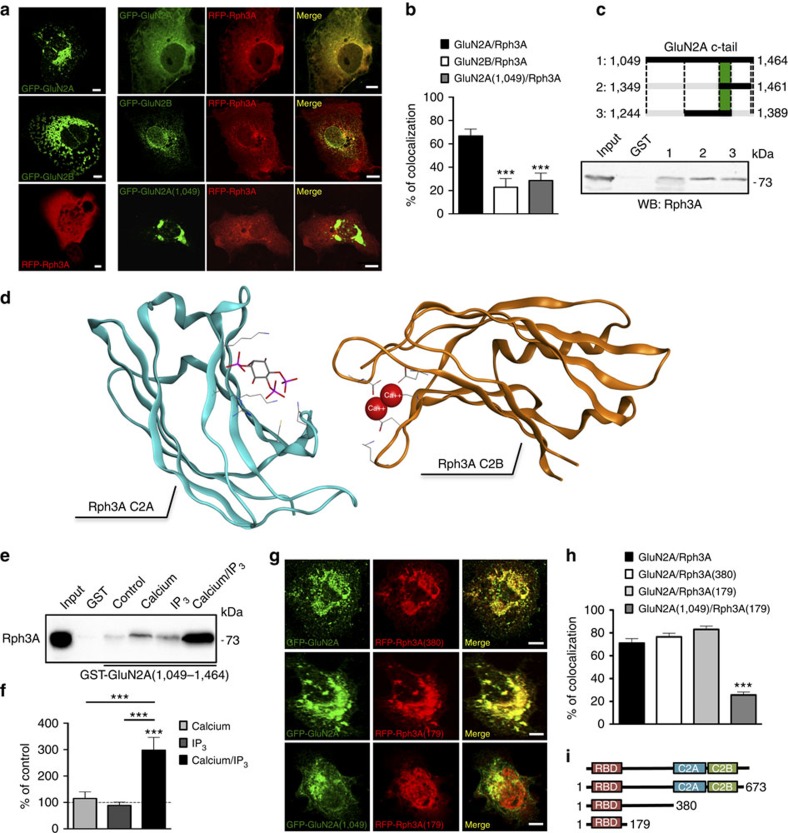
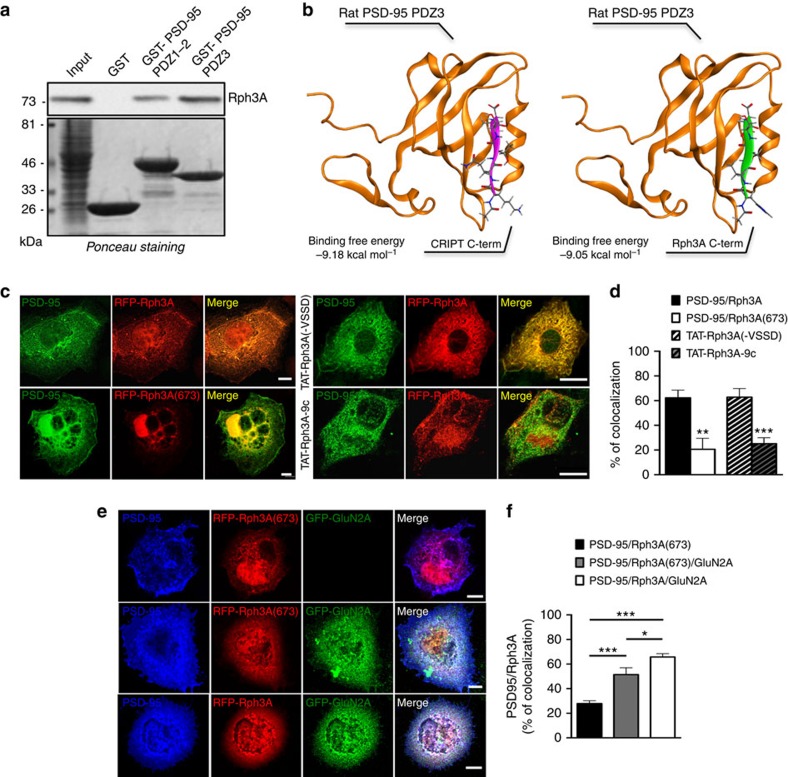
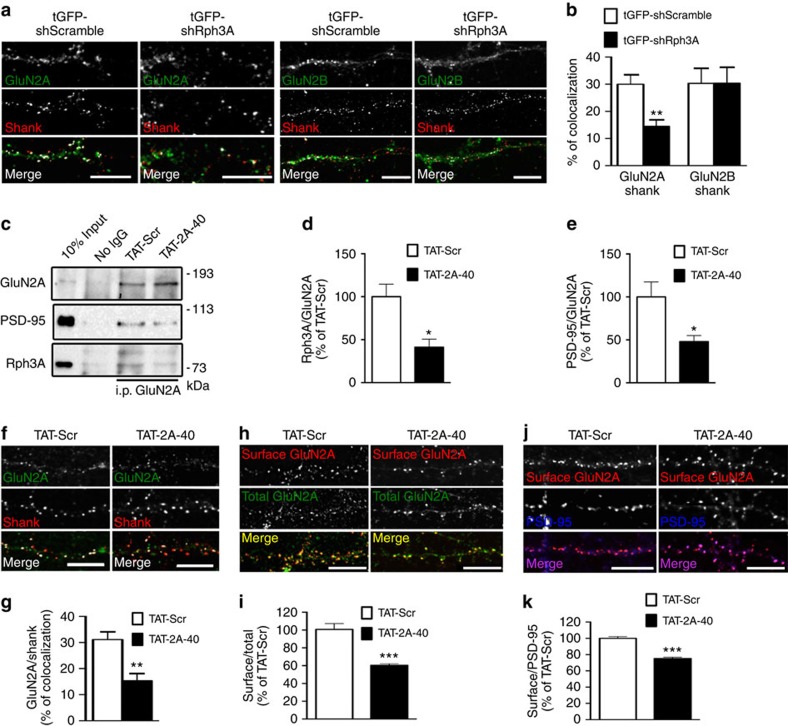
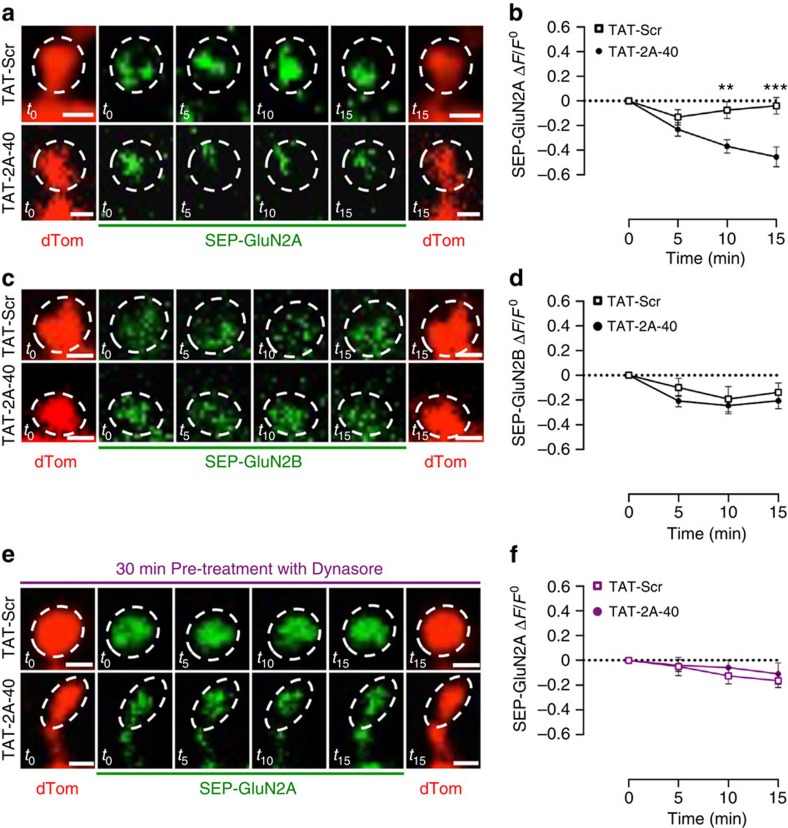
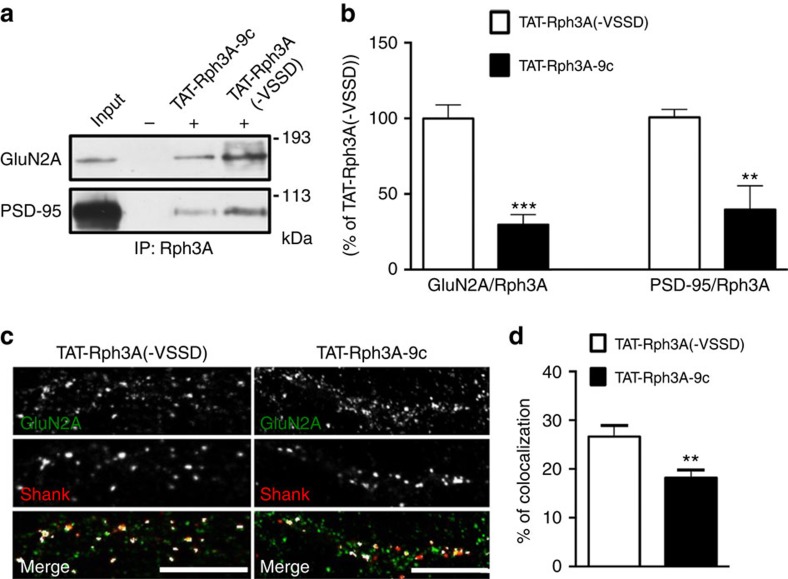
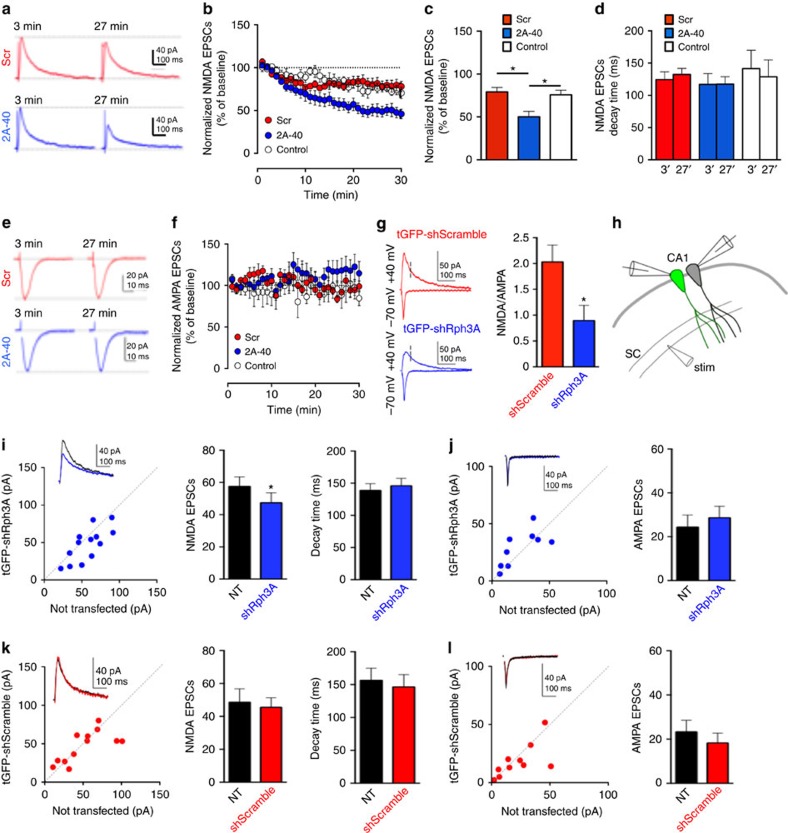
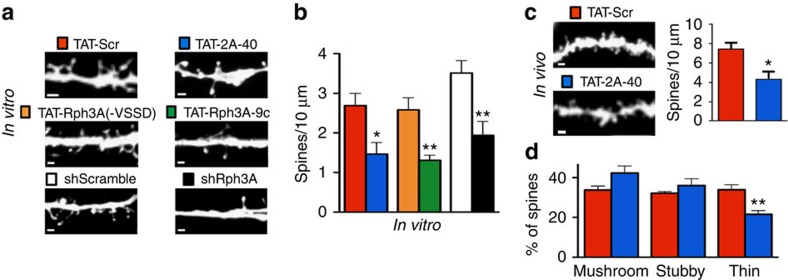
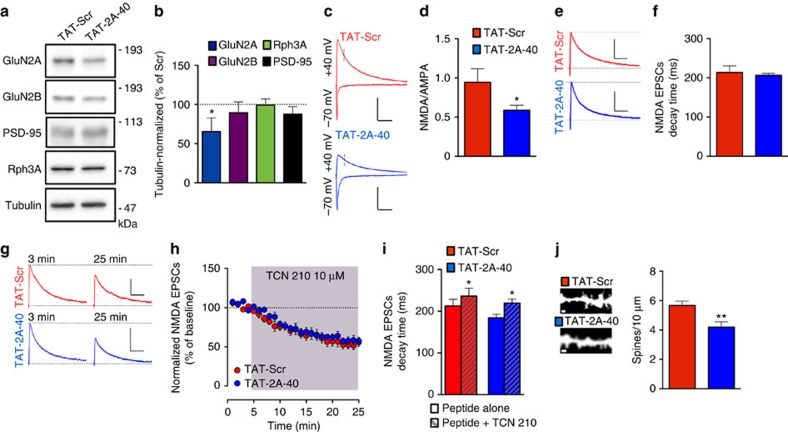
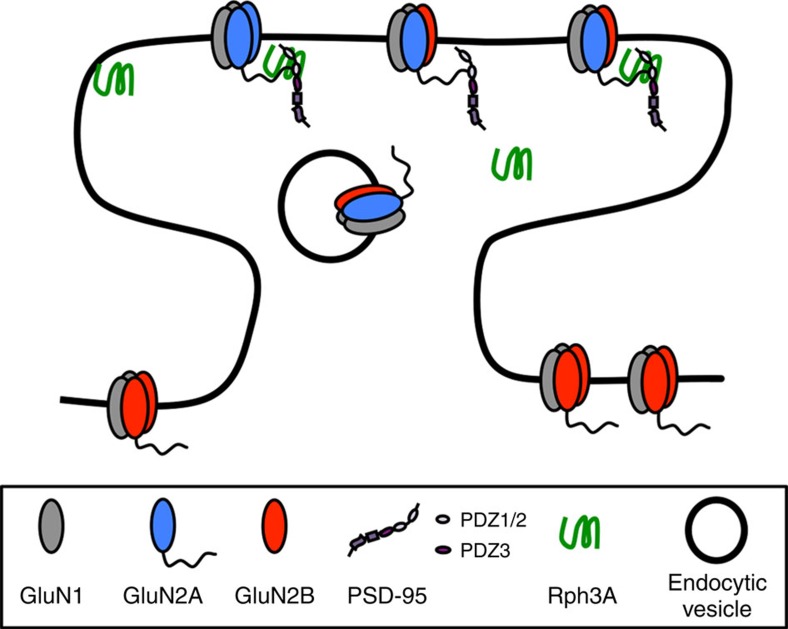
NMDA receptor (NMDAR) composition and synaptic retention represent pivotal features in the physiology and pathology of excitatory synapses. Here, we identify Rabphilin 3A (Rph3A) as a new GluN2A subunit-binding partner. Rph3A is known as a synaptic vesicle-associated protein involved in the regulation of exo- and endocytosis processes at presynaptic sites. We find that Rph3A is enriched at dendritic spines. Protein-protein interaction assays reveals that Rph3A N-terminal domain interacts with GluN2A(1349-1389) as well as with PSD-95(PDZ3) domains, creating a ternary complex. Rph3A silencing in neurons reduces the surface localization of synaptic GluN2A and NMDAR currents. Moreover, perturbing GluN2A/Rph3A interaction with interfering peptides in organotypic slices or in vivo induces a decrease of the amplitude of NMDAR-mediated currents and GluN2A density at dendritic spines. In conclusion, Rph3A interacts with GluN2A and PSD-95 forming a complex that regulates NMDARs stabilization at postsynaptic membranes.


Figures

Figure 1
Figure 1. Subcellular distribution of Rph3A and interaction with GluN2A and PSD-95.
(a) Fluorescence immunocytochemistry of Rph3A (green) and PSD-95 (red) in DIV15 primary hippocampal neurons. On last panel (merge), co-localization points are shown in white. Scale bar, 10 μm. (b) Fluorescence immunocytochemistry of GluN2A (green) and Rph3A (red) in DIV15 primary hippocampal neurons. On last panel (merge), co-localization points are shown in white. Scale bar, 10 μm. (c) Fluorescence immunocytochemistry of eGFP-GluN2A (green), RFP-Rph3A (red) and endogenous PSD-95 (blue) in DIV15 primary hippocampal neurons transfected with eGFP-GluN2A and RFP-Rph3A (DIV9). Scale bar, 10 μm. (d) Subcellular expression of GluN2A, PSD-95, Synaptophysin (Syn), Rph3A, Rab3A and Rab8 in rat hippocampus. H, homogenate; S1/2, supernatant 1/2; P1/2, pellet 1/2; SPM, synaptosomal plasma membrane; PSD1/2, postsynaptic density fraction 1/2. (e,f) Immunolabelling of Rph3A in dendritic spines of pyramidal cells in the CA1 stratum radiatum of the hippocampus. Electron microscopy images show that Rph3A is found lateral to the PSD (white arrowheads) and at different positions in dendritic spines (white arrowheads). b, bouton, s, spine. (g) Co-immunoprecipitation experiments on rat hippocampal P2 fractions using polyclonal GluN2A, monoclonal PSD-95 and irrelevant monoclonal Meox2 antibodies show that Rph3A is associated with both GluN2A and PSD-95.
Figure 2
Figure 2. Rph3A interacts with GluN2A.
(a) Confocal imaging of COS7 cells transfected with eGFP-GluN2A (green), eGFP-GluN2B (green) or RFP-Rph3A (red) and cells co-transfected with either eGFP-GluN2A, eGFP-GluN2B and RFP-Rph3A or eGFP-GluN2A(1,049) (green) and RFP-Rph3A. Scale bars, 10 μm. (b) Bar graph representing the percentage of co-localization between eGFP-GluN2A and RFP-Rph3A, eGFP-GluN2B and RFP-Rph3A, eGFP-GluN2A(1,049) and RFP-Rph3A. Data are presented as mean±s.e.m., n=5–9, ***P<0.001, unpaired Student's t-test. (c) GST pull-down assay of Rph3A using C-terminal GluN2A GST fusion protein with different sizes on rat brain extracts. 1, GluN2A (1,049–1,464); 2, GluN2A (1,349–1,461); 3, GluN2A (1,244–1,389). (d) Tridimensional model for the topological arrangement of the C2 domains of Rph3A (C2A in cyan and C2B in orange), modelled on the C2 domains of rat synaptotagmin-3. Each domain can bind both IP3 and 2 calcium ions; however, in the selected crystallographic structures, IP3 (stick rendering and CPK colouring) was solved only with the C2A and calcium (red spheres) with the C2B domain. The topological arrangement of the Rab-binding domain with respect to the C2 domains cannot be accurately modelled. (e,f) GST pull-down assay of Rph3A using C-terminal GluN2A(1,049–1,464) GST fusion protein in the presence or absence of calcium (20 mM) and IP3 (1 mM). The bar graph represents the binding of Rph3A to the fusion protein expressed as percentage of control (in absence of both calcium and IP3). Data are presented as mean±s.e.m., n=6, ***P<0.001; one-way ANOVA followed by Tukey post-hoc test. (g) Confocal imaging of COS7 cells co-transfected with eGFP-GluN2A and RFP-Rph3A(380) (upper panels), eGFP-GluN2A and RFP-Rph3A(179) (middle panels) or eGFP-GluN2A(1,049) and RFP-Rph3A(179) (lower panels). Scale bars, 10 μm. (h) Bar graph representing the percentage of co-localization between GluN2A and RFP-Rph3A constructs. Data are presented as mean±s.e.m., n=10, ***P<0.001; one-way ANOVA followed by Tukey post-hoc test, GluN2A(1,049)/Rph3A(179) versus GluN2A/Rph3A, GluN2A(1,049)/Rph3A(179) versus GluN2A/Rph3A(380), GluN2A(1,049)/Rph3A(179) versus GluN2A/Rph3A(179). (i) Representative schematic of the different mouse Rph3A mutant constructs used.
Figure 3
Figure 3. Rph3A interacts with PSD-95.
(a) GST pull-down assay of Rph3A using PSD-95 PDZ1–2 or PSD-95 PDZ3 GST fusion proteins on rat brain extracts. Upper panel: WB analysis performed by using Rph3A antibody. Lower panel: Ponceau staining showing the amount of proteins loaded in each lane. (b) Left panel: complex between the PDZ3 domain of the rat PSD-95 (in orange) and the CRIPT protein C-terminus (in purple); right panel: complex between the PDZ 3 domain of the rat PSD-95 (in orange) and the Rph3A C-terminus (in green). Proteins are rendered as ribbons, peptides both as ribbons and sticks (with CPK colouring). The beta-sheet augmentation, typical of the PDZ domain molecular recognition mechanism, can be appreciated in both complexes. Binding free energies are reported for each complex. (c) Confocal imaging of COS7 cells co-transfected with PSD-95 (green) and RFP-Rph3A (red) in the presence or absence of TAT-Rph3A-9c or TAT-Rph3A(−VSSD), or PSD-95 and RFP-Rph3A(673) (red). Scale bars, 10 μm. (d) Bar graph representing the percentage of co-localization between PSD-95 and RFP-Rph3A in the presence or absence of TAT-Rph3A-9c or TAT-Rph3A(−VSSD), and PSD-95 and RFP-Rph3A(673) (n=5–10; unpaired Student's t test). (e) Confocal imaging of COS7 cells co-transfected with PSD-95 (blue), RFP-Rph3A or RFP-Rph3A(673) (red) in the presence or absence of GFP-GluN2A (green). Scale bar, 10 μm. (f) The bar graph represents the percentage of co-localization between PSD-95 and RFP-Rph3A constructs (n=8; one-way ANOVA followed by Tukey post-hoc test). All data are presented as mean±s.e.m., *P<0.05, **P<0.01, ***P<0.001.
Figure 4
Figure 4. Effect of GluN2A/Rph3A complex on GluN2A synaptic availability in hippocampal neurons.
(a) Fluorescence immunocytochemistry of GluN2A (green) and Shank (red) or GluN2B (green) and Shank in DIV15 neurons transfected with tGFP-shScramble or tGFP-shRph3A (DIV9). (b) Bar graph representing the percentage of co-localization of GluN2A or GluN2B with Shank (n=10–19). (ce) Co-immunoprecipitation of GluN2A with PSD-95 and Rph3A in P2 fractions from primary hippocampal neurons (DIV15) treated with TAT-2A-40 10 μM 30 min, showing a reduction of the interaction compared with animals treated with the control peptide TAT-Scr. The bar graphs show Rph3A/GluN2A (d) and PSD-95/GluN2A (e) co-immunoprecipitation expressed as % of TAT-Scr (n=4). (f) Fluorescence immunocytochemistry of GluN2A (green) and Shank (red) in DIV15 neurons treated with TAT-Scr or 10 μM TAT-2A-40 for 30 min. (g) Bar graph representing the percentage of co-localization of GluN2A with Shank (n=7–14). (h) Fluorescence immunocytochemistry of surface GluN2A (red) and total GluN2A (green) in DIV15 hippocampal neurons treated for 30 min with 10 μM TAT-Scr or TAT-2A-40. (i) Bar graph representation of the percentage of integrated density ratio GluN2A surface/total compared with the mean of TAT-Scr (n=119–144). (j) Fluorescence immunocytochemistry of surface GluN2A (red) and PSD-95 (blue) in DIV15 hippocampal neurons treated for 30 min with TAT-Scr or TAT-2A-40 10 μM. (k) Bar graph representation of the percentage of integrated density ratio surface GluN2A/PSD-95 compared with the mean of TAT-Scr (n=119–150). All data are presented as mean±s.e.m.; *P<0.05, **P<0.01, ***P<0.001; unpaired Student's t tests. All scale bars represent 10 μm.
Figure 5
Figure 5. Effect of GluN2A/Rph3A complex on SEP-GluN2A membrane expression in spines of hippocampal neurons.
(a) Live imaging of DIV16 hippocampal neurons co-transfected with SEP-GluN2A (green) and dTom (red) after 0 min (t0), 5 min (t5), 10 min (t10) and 15 min (t15) of treatment with 10 μM TAT-Scr or TAT-2A-40. Scale bars, 1 μm. (b) XY graph representing the ΔF/F0 of SEP-GluN2A over time. Data are presented as mean±s.e.m., n=17–22, **P<0.01 and ***P<0.001; unpaired Student's t-test. (c) Live imaging of DIV16 hippocampal neurons co-transfected with SEP-GluN2B (green) and dTom (red) after 0 min (t0), 5 min (t5), 10 min (t10) and 15 min (t15) of treatment with 10 μM TAT-Scr or TAT-2A-40. Scale bars, 1 μm. (d) XY graph representing the ΔF/F0 of SEP-GluN2B over time. Data are presented as mean±s.e.m., n=19. (e) Live imaging of pre-treated with Dynasore 80 μM for 30 min DIV16 hippocampal neurons co-transfected with SEP-GluN2A (green) and dTom (red) after 0 min (t0), 5 min (t5), 10 min (t10) and 15 min (t15) of treatment with 10 μM TAT-Scr or TAT-2A-40. Scale bars, 1 μm. (f) XY graph representing the ΔF/F0 of SEP-GluN2A over time. Data are presented as mean±s.e.m., n=19–20.
Figure 6
Figure 6. Effect of PSD-95/Rph3A complex on GluN2A synaptic availability in hippocampal neurons.
(ac) Co-immunoprecipitation of Rph3A with GluN2A and PSD-95 from P2 fraction from forebrain of mice 2 h after injection with TAT-Rph3A-9c (3 nmol g−1, i.p.) showing a reduction of both interactions compared with mice treated with the control peptide TAT-Rph3A(−VSSD). The bar graphs show GluN2A/Rph3A (left columns) and PSD-95/Rph3A (right columns) co-immunoprecipitation expressed as % of TAT-Rph3A(−VSSD); **P<0.01, n=3; ***P<0.001, n=5; unpaired Student's t-test. (c) Fluorescence immunocytochemistry of GluN2A (green) and Shank (red) in DIV15 neurons treated with 10 μM TAT-Rph3A(−VSSD) or TAT-Rph3A-9c for 30 min. Scale bars, 10 μm. (d) Bar graph representing the percentage of co-localization of GluN2A with Shank. Data are presented as mean±s.e.m., n=10, **P<0.01; unpaired Student's t-test.
Figure 7
Figure 7. Effect of GluN2A/Rph3A interaction on NMDAR currents.
(a) Sample traces showing the effect of intracellular perfusion of the non-permeable 2A-40 or its scramble peptides on pharmacologically isolated NMDAR-mediated EPSCs (+30 mV) recorded from a CA1 pyramidal cell. Traces represent the average of 6–9 responses with a scale of 40 pA over 100 ms. (b) Summary graph illustrating the time course of the effect of 2A-40 or its scramble on the peak amplitude of NMDAR-EPSCs. For comparison, the amplitude of NMDAR-EPSCs in the absence of any peptide in the intracellular solution (open circles) were also plotted (n=5–9). (c,d) Bar graphs summarizing the effect on the amplitude of NMDAR-EPSCs (c; Mann–Whitney test) and decay time (d) of the peptides (n=5–9). (e) Sample traces show the effect of intracellular perfusion of the non-permeable 2A-40 or its scramble control peptides on pharmacologically isolated AMPAR-mediated EPSCs (−70 mV). Traces represent the average of 6–9 responses with a scale of 20 pA over 10 ms. (f) Summary graph illustrating the time course of the effect of 2A-40 or its scramble on the peak amplitude of AMPAR-EPSCs. For comparison, it is also plotted (open circles) the amplitude of AMPAR-EPSCs in the absence of any peptide in the intracellular solution, n=6–7. (g) Sample traces and summary graphs illustrating that transfection of tGFP-shRNA-Rph3A induced a significant reduction in the NMDA/AMPA ratio when compared with cells transfected with tGFP-shRNA-Scramble (tGFP-shRNA-Scramble: 2.03±0.32; n=9; tGFP-shRNA-Rph3A: 0.89±0.29, n=8; Mann–Whitney test). (h) Schematic illustrating paired recordings from neighbouring transfected and non-transfected neurons. (i) Sample traces shown in the inset (not transfected (NT): n=13; tGFP-shRNA-Rph3A: n=13; Mann–Whitney test). (j) Amplitude of AMPAR-mediates EPSCs at SC-CA1 (recorded at −70 mV; NT: n=9; tGFP-shRNA-Rph3A: n=9). (k) Transfection with tGFP-shRNA-Scramble did not modify the amplitude or decay time of NMDAR-mediated EPSCs at SC-CA1 synapse (NT: n=12; tGFP-shRNA-Scramble: n=12). (l) Transfection with tGFP-shRNA-Scramble did not reduce the amplitude of AMPAR-mediated EPSCs at SC-CA1 (NT: n=10; tGFP-shRNA-Scramble: n=10). All data are represented as mean±s.e.m. *P<0.05.
Figure 8
Figure 8. Effect of GluN2A/Rph3A interaction on spine morphology.
(a) Representative images show dendrites of DIV15 hippocampal neurons treated with TAT-Scr (red), TAT-2A-40 (blue), TAT-Rph3A(−VSSD; orange) or TAT-Rph3A-9c (green) or transfected with tGFP-shScramble (white) or tGFP-shRph3A (black) at DIV9. (b) Bar graph representing the respective spine densities in these neurons (n=6–8; unpaired Student's t-test). (c) Representative images show dendrites of adult mouse CA1 neurons 2 h after injection of either TAT-Scr (red) or TAT-2A-40 (blue), both 3 nmol g−1 i.p. Bar graph represents the respective spine densities in these neurons (n=5; unpaired Student's t-test). (d) Bar graph representing the different spine types percentage compared with the total spines (mushroom, stubby and thin; n=5; unpaired Student's t-test). All data are presented as mean±s.e.m. *P<0.05, **P<0.01, ***P<0.001. Scale bars, 1 μm.
Figure 9
Figure 9. Modulation of GluN2A-containing NMDAR expression at synapses in the developing rat hippocampus.
(a) Western blot analysis of GluN2A, GluN2B, PSD-95, Rph3A and tubulin of TIF from treated rat pups hippocampus. (b) Bar graph representing the percentage of tubulin normalized integrated density of GluN2A, GluN2B, Rph3A and PSD-95 WB bands from TIF samples compared with their respective TIF purification TAT-Scr control (n=3–5; unpaired Student's t-test). (c) Sample traces illustrating a decreased NMDA/AMPA in TAT-2A-40-treated animals (blue) compared with TAT-Scr-treated (red) animals at Schaffer collaterals to CA1 pyramidal cell synapses in acute hippocampal slices with 100 pA over 100 ms scale. (d) Bar graph summarizes the significant decrease in NMDA/AMPA in TAT-2A-40-treated animals (blue) compared with TAT-Scr-treated (red) animals (n=9–12; Mann–Whitney test). (e,f) Sample traces (e) and summary bar graph (f) illustrating that the decay time of pharmacologically isolated NMDAR-EPSCs does not differ between TAT-Scr-treated (red) and TAT-2A-40-treated (blue) animals (n=10–14) with 40 pA over 100 ms scale. (gi) Sample traces (g) and summary graphs illustrating that the amplitude (h) and decay time (i) of the pharmacologically isolated NMDAR-EPSCs are equally modulated by application of TCN 210 in both conditions (n=6–7; Wilcoxon test) with 50 pA over 200 ms scale. (j) Representative images show dendrites of P15 rat pups CA1 neuron either treated with TAT-Scr (red) or TAT-2A-40 (blue), both 3 nmol g−1 s.c. chronically from P6 to P14. Bar graph represents the respective spine densities (n=10–11; unpaired Student's t test). All data are presented as mean±s.e.m. *P<0.05, **P<0.01, ***P<0.001. Scale bars, 1 μm.
Figure 10
Figure 10. Schematic of GluN2A/Rph3A/PSD-95 ternary complex at the PSD.
Rph3A is involved in a ternary complex with GluN2A and PSD-95 to help stabilize GluN2A-containing NMDARs at the synaptic membrane. Rph3A localized at the lateral domain of the PSD interacts with the cytoplasmic C-terminal tail of GluN2A and the PDZ3 domain of PSD-95, whereas GluN2A can bind to PDZ1 or PDZ2 of PSD-95. Disruption of one of these interactions is enough to reduce the amount of GluN2A-containing NMDARs at synaptic membranes affecting the overall amplitude of NMDARs response and spine density in the hippocampus.

Similar articles

Cited by

References

    1. Sanz-Clemente A., Nicoll R. A. & Roche K. W. Diversity in NMDA receptor composition: many regulators, many consequences. Neuroscientist 19, 62–75 (2013). - PMC - PubMed
    1. Groc L. et al. NMDA receptor surface mobility depends on NR2A-2B subunits. Proc. Natl Acad. Sci. USA 103, 18769–18774 (2006). - PMC - PubMed
    1. Bard L. et al. Dynamic and specific interaction between synaptic NR2-NMDA receptor and PDZ proteins. Proc. Natl Acad. Sci. USA 107, 19561–19566 (2010). - PMC - PubMed
    1. Hardingham G. E. & Bading H. Synaptic versus extrasynaptic NMDA receptor signalling: implications for neurodegenerative disorders. Nat. Rev. Neurosci. 11, 682–696 (2010). - PMC - PubMed
    1. Papouin T. et al. Synaptic and extrasynaptic NMDA receptors are gated by different endogenous coagonists. Cell 150, 633–646 (2012). - PubMed

Publication types

MeSH terms

Substances