. 2016 Feb 12;291(7):3371-84.
doi: 10.1074/jbc.M115.686071. Epub 2015 Dec 17.

Type I Interferon Signaling Is Decoupled from Specific Receptor Orientation through Lenient Requirements of the Transmembrane Domain

Affiliations

Type I Interferon Signaling Is Decoupled from Specific Receptor Orientation through Lenient Requirements of the Transmembrane Domain

Nanaocha Sharma et al. J Biol Chem. .

Abstract

Type I interferons serve as the first line of defense against pathogen invasion. Binding of IFNs to its receptors, IFNAR1 and IFNAR2, is leading to activation of the IFN response. To determine whether structural perturbations observed during binding are propagated to the cytoplasmic domain, multiple mutations were introduced into the transmembrane helix and its surroundings. Insertion of one to five alanine residues near either the N or C terminus of the transmembrane domain (TMD) likely promotes a rotation of 100° and a translation of 1.5 Å per added residue. Surprisingly, the added alanines had little effect on the binding affinity of IFN to the cell surface receptors, STAT phosphorylation, or gene induction. Similarly, substitution of the juxtamembrane residues of the TMD with alanines, or replacement of the TMD of IFNAR1 with that of IFNAR2, did not affect IFN binding or activity. Finally, only the addition of 10 serine residues (but not 2 or 4) between the extracellular domain of IFNAR1 and the TMD had some effect on signaling. Bioinformatic analysis shows a correlation between high sequence conservation of TMDs of cytokine receptors and the ability to transmit structural signals. Sequence conservation near the TMD of IFNAR1 is low, suggesting limited functional importance for this region. Our results suggest that IFN binding to the extracellular domains of IFNAR1 and IFNAR2 promotes proximity between the intracellular domains and that differential signaling is a function of duration of activation and affinity of binding rather than specific conformational changes transmitted from the outside to the inside of the cell.

Keywords: cell signaling; cytokine receptor; interferon; mutagenesis; protein-protein interaction; transmembrane domain.


Figures

FIGURE 1.
FIGURE 1.
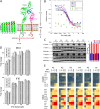
Inserting one to five alanine residues near the N terminus of the TMD of IFNAR1 has little effect on binding and activity. A, ribbon representation of the ternary complex of IFNAR1, IFNAR2, and IFN (based on Protein Data Bank 3SE3) (7) and the location of the additional alanine residues inserted within the transmembrane domain of IFNAR1. To the left is a schematic representation of the expected effect of adding one to five alanine residues (A1–A5). B, in situ binding curves of the different IFNAR1 mutants. Signal emitted from 125I-labeled wild-type IFNα2 was measured after competing with cold IFN-YNS at different concentrations. The y axis represents the fraction of γ signal relative to the signal in the absence of cold competitor. As control, we also measured binding to non-transfected cells and to cells transfected with the IFNAR1 mutant L163C. IC50 values were calculated by fitting the normalized data using KaleidaGraph 4.1. C, A1–A5 mutant IFNAR1 HUH7 cells were treated for 30 min with 1 nm IFNα2 and then analyzed by Western blotting using antibodies for pSTAT1 and pSTAT2. After stripping, the blots were re-analyzed with anti-STAT1 and -STAT2 antibodies. The graph on the right shows the normalized (to total and untreated) levels of phosphorylation. D, gene expressions of transiently transfected HUH7 cells after 16 h of treatment with 0.5–1000 pm IFNα2. qPCR was then performed for IFI6 and MX1 genes as indicated. The data presented are the relative expression levels compared with those of untreated cells, normalized against HPRT1. The results are average and standard error of three independent experiments. E, fold change in gene expression using the Fluidigm system (see “Experimental Procedures”). Cells were treated as in D, and cDNAs (50 ng/ml) were preamplified with all the primers polled and analyzed with the BioMark real time PCR instrument. Data are presented using the NetWalker analysis tool. The upper eight genes are tunable genes, and the lower 12 genes are robust genes (15). The colors represent the value of a given gene (rows) in a specific mutant and concentration of interferon (columns). Genes with a high −ΔΔCt value (high expression) are in red, and genes with a low −ΔΔCt value (low expression) are in blue. Comparisons of the fold changes were done relative to those of untreated cells. Data are representative of two independent experiments.
FIGURE 2.
FIGURE 2.
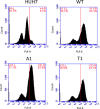
Levels of transfection of wild-type IFNAR1 and two alanine insertion mutants (A1 and T1) relative to non-transfected HUH7 cells as determined by FACS using the anti-IFNAR1 antibody AA3.
FIGURE 3.
FIGURE 3.
Inserting one to four alanine residues near the C terminus of the TMD of IFNAR1 (T1 to T4) has little effect on binding and activity. A, the location of the inserted alanine mutations. B, in situ binding curves of the different IFNAR1 mutants. C, analyzing pSTAT1, pSTAT2, STAT1, and STAT2 levels upon 1 nm IFNα2 induction for 30 min using specific antibodies. D, gene expressions for IFI6 and MX1 upon IFN induction at the given concentrations. E, fold change in gene expression for a set of tunable and robust genes upon IFN induction. Further experimental details are provided in the legend of Fig. 1.
FIGURE 4.
FIGURE 4.
Mutating the immediate surrounding of the TMD of IFNAR1. A, left panel shows insertions of 2, 4, and 10 serine residues between the TMD and the extracellular domain. In addition, the two C-terminal residues of the TMD, Lys-458 and Val-459 were mutated to alanine. Finally, the TMD of IFNAR1 was replaced with that of IFNAR2 (making a homodimeric TMD, right panel). B, in situ binding curves of the different IFNAR1 mutants. Binding of the S10 mutant was 5-fold weaker than wild type and the other mutants analyzed. C, pSTAT1, pSTAT2, STAT1, and STAT2 levels upon 1 nm IFNα2 induction for 30 min using specific antibodies. D, gene expressions for IFI6 and MX1 upon IFN induction at the given concentrations. One asterisk is for a p value of <0.05, and two asterisks is for p values of <0.01 (by one-way analysis of variance). E, fold change in gene expression for a set of tunable and robust genes upon IFN induction. Further experimental details are provided in the legend of Fig. 1.
FIGURE 5.
FIGURE 5.
TOXCAT assay, which measures homodimerization of transmembrane domains through antibiotic resistance to chloramphenicol, was performed on the TMD of IFNAR2. A, although the TMD of ErbB2 drives dimerization (39), the TMD of IFNAR2 is a monomer. B, in addition to activation of STATs, IFNs have been reported to drive phosphorylation of ERK, p38 MAPK, and AKT (43, 44). Western blots using specific antibodies against phosphorylated and total proteins were performed on HUH7 cells harboring the designated IFNAR1 constructs, 30 min after addition of 1 nm IFNα2. As control we used HeLa cells, where the activation of these three proteins are seen.
FIGURE 6.
FIGURE 6.
STAT phosphorylation and gene activation measured at different times of IFN induction. A, WT, S10, TMR1R2, and T3 IFNAR1 constructs were transfected into HUH7 cells, which were treated for 60 min with 1 nm IFNα2 and then analyzed by Western blotting using antibodies for pSTAT1 and pSTAT2. After stripping, the blots were re-analyzed with anti-STAT1 and -STAT2 antibodies. On the right is a comparison with 30 min of IFN activation of WT IFNAR1. B, gene expressions of transiently transfected HUH7 cells with WT, A1, T3, TMR1R2, and S10 IFNAR1 after 8 and 24 h treatment with 0.5 and 10 pm IFNα2. qPCR was then performed for IFI6 and MX1 genes as indicated. The data presented are the relative expression levels compared with those of untreated cells, normalized against HPRT1.
FIGURE 7.
FIGURE 7.
Predicted location and sequence conservation of the TMD of IFNAR1. A, the predicted location of the TMD according to the TOPCONS server (46) of wild-type, A5, and T4 insertions (of five and four Ala residues) and Lys-458 and Val-459 to Ala mutations. B, modeling the structures of IFNAR1-IFNAR2 TMD arrangements using PREDDIMER (47). As input we used the predicted TMD regions, spanning from IW to AA for IFNAR1 (21 amino acids) and from IG to TL for IFNAR2 (21 amino acids, see C and D in red). We used the same boundaries also for modeling the A5 and T4 TMD variants as we cannot be sure of their exact boundaries. Wild type is colored cyan; A5 is magenta; T4 is yellow; and IFNAR2-IFNAR2 homodimer is blue. The three models are of the first three solutions (out of nine for IFNAR1-IFNAR2 TMD), with FSCOREs of 1.1, 0.96, and 0.92, respectively. C, logo of the TMD of IFNAR1 and its surroundings (larger letters represents higher conservation). Sequence alignment was done using ConSurf (50). The sequence below the logo is of human IFNAR1 (residues 418–487), with the last β-strand of the extracellular domain marked in bold blue, the transmembrane domain in red, and Tyr-466 in green. D, as C, but for IFNAR2 (residues 221–280). E, modeling the ternary complex, showing Protein Data Bank code 3SE3 (human IFNω, IFNAR2, and IFNAR1 domain 1–3 as magenta (7)) and mouse IFNβ bound to IFNAR1 (Protein Data Bank code 3WCY (5)) in green. The TMD was modeled as a single transmembrane helix. The residues flanking the TMD are modeled as random coils.
FIGURE 8.
FIGURE 8.
Sequence conservation of cytokine receptor trans-membrane domains and their surroundings. Sequence conservation was determined using ConSurf (50). A, highest to lowest sequence conservation. The underlined positions are of the TMDs. In parentheses are the average ConSurf scores of the TMDs. The cytokine receptors were ordered according to the average sequence conservation of the TMDs (from lowest to highest). B, sequence conservation values as calculated by ConSurf (1–9) were plotted versus their position. The line is a weighted moving average of the individual values as calculated by KaleidaGraph (version 4.1). The plots are ordered according to the degree of conservation of their TMDs (as in A).

Similar articles

Cited by

References

    1. Cohen B., Novick D., Barak S., and Rubinstein M. (1995) Ligand-induced association of the type I interferon receptor components. Mol. Cell. Biol. 15, 4208–4214 - PMC - PubMed
    1. Wilmes S., Beutel O., Li Z., Francois-Newton V., Richter C. P., Janning D., Kroll C., Hanhart P., Hötte K., You C., Uzé G., Pellegrini S., and Piehler J. (2015) Receptor dimerization dynamics as a regulatory valve for plasticity of type I interferon signaling. J. Cell Biol. 209, 579–593 - PMC - PubMed
    1. Atanasova M., and Whitty A. (2012) Understanding cytokine and growth factor receptor activation mechanisms. Crit. Rev. Biochem. Mol. Biol. 47, 502–530 - PMC - PubMed
    1. Hwang S. Y., Hertzog P. J., Holland K. A., Sumarsono S. H., Tymms M. J., Hamilton J. A., Whitty G., Bertoncello I., and Kola I. (1995) A null mutation in the gene encoding a type I interferon receptor component eliminates antiproliferative and antiviral responses to interferons α and β and alters macrophage responses. Proc. Natl. Acad. Sci. U.S.A. 92, 11284–11288 - PMC - PubMed
    1. de Weerd N. A., Vivian J. P., Nguyen T. K., Mangan N. E., Gould J. A., Braniff S. J., Zaker-Tabrizi L., Fung K. Y., Forster S. C., Beddoe T., Reid H. H., Rossjohn J., and Hertzog P. J. (2013) Structural basis of a unique interferon-β signaling axis mediated via the receptor IFNAR1. Nat. Immunol. 14, 901–907 - PubMed

Publication types

MeSH terms

LinkOut - more resources