Comparative Study
. 2016 Mar 4;15(3):766-76.
doi: 10.1021/acs.jproteome.5b00847. Epub 2015 Dec 29.

Integrative Omics Analysis Reveals Post-Transcriptionally Enhanced Protective Host Response in Colorectal Cancers with Microsatellite Instability

Affiliations
Comparative Study

Integrative Omics Analysis Reveals Post-Transcriptionally Enhanced Protective Host Response in Colorectal Cancers with Microsatellite Instability

Qi Liu et al. J Proteome Res. .

Abstract

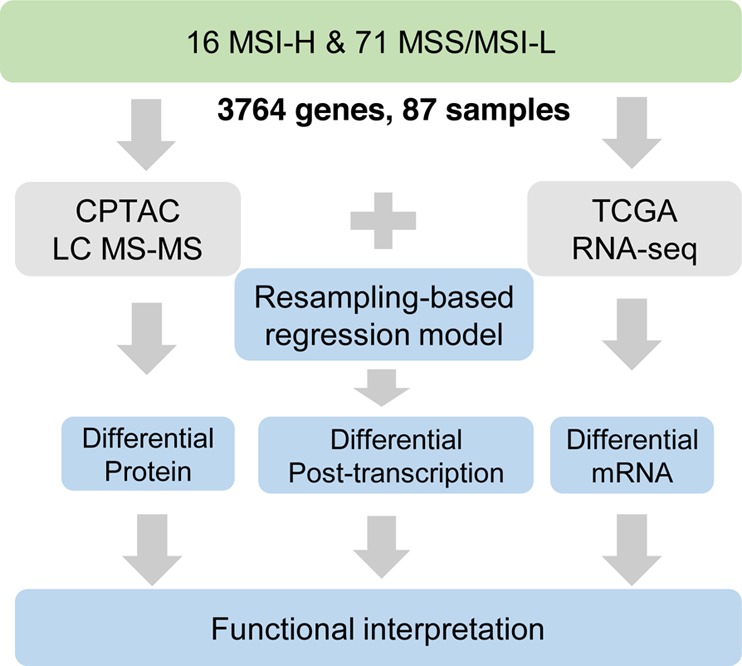
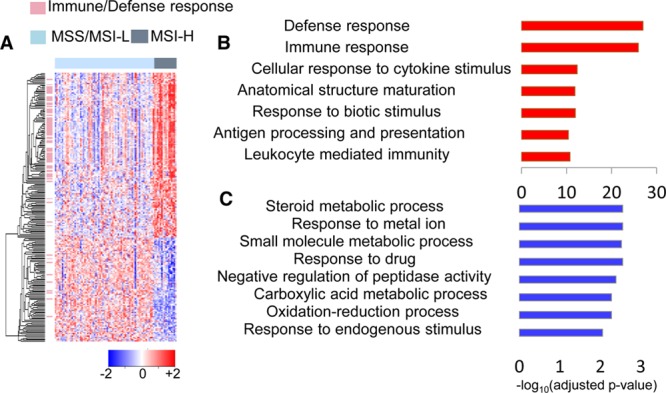
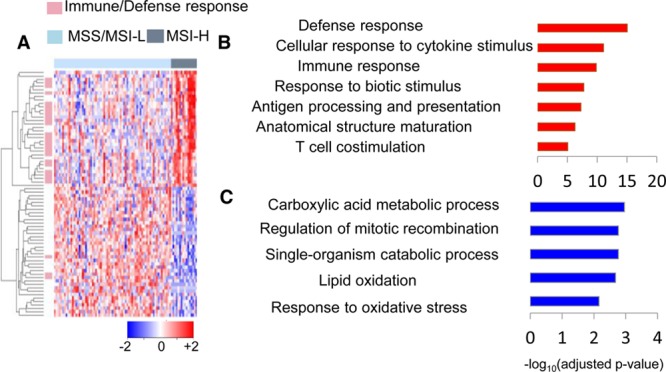
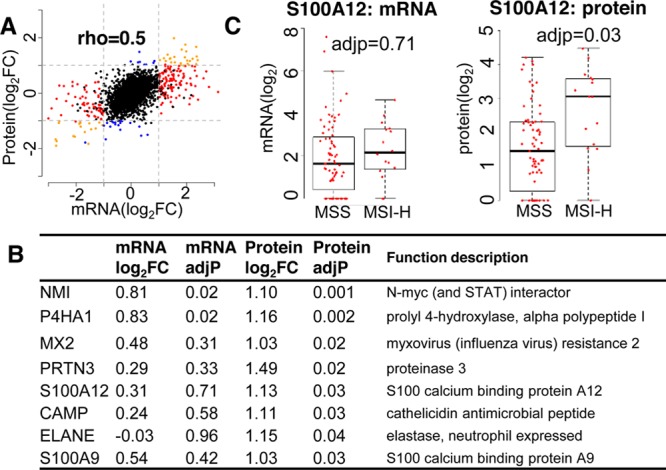
Microsatellite instability (MSI) is a frequent and clinically relevant molecular phenotype in colorectal cancer. MSI cancers have favorable survival compared with microsatellite stable cancers (MSS), possibly due to the pronounced tumor-infiltrating lymphocytes observed in MSI cancers. Consistent with the strong immune response that MSI cancers trigger in the host, previous transcriptome expression studies have identified mRNA signatures characteristic of immune response in MSI cancers. However, proteomics features of MSI cancers and the extent to which the mRNA signatures are reflected at the protein level remain largely unknown. Here, we performed a comprehensive comparison of global proteomics profiles between MSI and MSS colorectal cancers in The Cancer Genome Atlas (TCGA) cohort. We found that protein signatures of MSI are also associated with increased immunogenicity. To reliably quantify post-transcription regulation in MSI cancers, we developed a resampling-based regression method by integrative modeling of transcriptomics and proteomics data sets. Compared with the popular simple method, which detects post-transcriptional regulation by either identifying genes differentially expressed at the mRNA level but not at the protein level or vice versa, our method provided a quantitative, more sensitive, and accurate way to identify genes subject to differential post-transcriptional regulation. With this method, we demonstrated that post-transcriptional regulation, coordinating protein expression with key players, initiates de novo and enhances protective host response in MSI cancers.

Keywords: colorectal cancer; integrative omics analysis; microsatellite instability; post-transcription regulation; protective host response.


Conflict of interest statement

The authors declare no competing financial interest.

Figures

Figure 1
Figure 1
Schema of the integrative analysis pipeline. We performed comparative transcriptomics and proteomics analysis in 16 MSI-H versus 71 MSS/MSI-L cancers for 3,764 genes and developed a resampling-based regression method to detect significant differential post-transcriptional regulation.
Figure 2
Figure 2
mRNA signatures associated with MSI status. (A) Hierarchical clustering of 219 differentially expressed mRNAs in MSI-H versus MSI-L/MSS cancers. Each row represents a single gene and each column represents a single patient. Genes involved in immune/defense response are represented by pink bars on the left side of the heatmap. MSI-L/MSS patients are denoted by light blue bars and MSI-H by dark gray bars on the top of the heatmap. mRNA expression values are gene-wise z-transformed and are colored red for high intensities and blue for low intensities (scale at the right bottom). (B) Enriched GO terms of upregulated mRNAs. (C) Enriched GO terms of downregulated mRNAs. X axis shows the significance of the enrichment −log10(adjusted p-value).
Figure 3
Figure 3
Protein signatures associated with MSI status. (A) Hierarchical clustering of 72 differentially expressed proteins in MSI-H versus MSI-L/MSS cancers. Each row represents a single gene, and each column represents a single patient. Genes involved in immune/defense response are annotated by pink bars on the left side, and gene symbols are labeled on the right side of the heatmap. MSI-L/MSS patients are denoted by light blue bars and MSI-H by dark gray bars on the top of the heatmap. Protein expression values are gene-wise z-transformed and are colored red for high abundances and blue for low abundances (scale at the right bottom). (B) Enriched GO terms of overexpressed proteins. (C) Enriched GO terms of underexpressed proteins. The x axis shows the significance of the enrichment (−log10(adjusted p-value)).
Figure 4
Figure 4
Comparison between mRNA and protein changes in MSI-H versus MSI-L/MSS cancers. (A) Scatterplot of mRNA change versus protein change. Genes differentially expressed at both mRNA and protein levels (|log2FC| > 1 and adjusted p-value < 0.05) (orange), genes detected only at the mRNA level (red), and those identified only at the protein level (blue). (B) List of 8 genes significantly upregulated at the protein level but not at the mRNA level, including fold change, adjusted p-value, and functional description. (C) mRNA and protein abundances of S100A12 in MSI-H and MSS-L/MSS cancers.
Figure 5
Figure 5
Genes with increased post-transcriptional regulation. (A) Hierarchical clustering of genes with upregulation either at mRNA, post-transcriptional, or protein levels. Each row represents a single gene, and each column represents a single level. The value is the regulation change of each gene at each level, which is colored blue (downregulation) or red (upregulation). The color scale is at the top of the heatmap. Three major groups are labeled on the right side: “Maintain” (green), “Gain” (red), and “Lose” (blue). How mRNA, post-transcriptional regulation, and protein changes in these three groups are illustrated beside each group. (B) Differential expression of genes in the “Maintain” (green) and the “Lose” groups (blue) on two independent mRNA expression profiles (GSE13294 and GSE26682). (C) Functional relationship between the “Maintain”, “Gain”, and “Lose” groups on the PPI network. The x axis is the shortest path length, and the y axis is the percentage of pairs with the length. Shortest path between “Gain” and “Maintain” groups are denoted by light blue, whereas the shortest path between “Lose” and “Maintain” groups are denoted by dark blue.

References

    1. Haggar F. A.; Boushey R. P. Colorectal cancer epidemiology: incidence, mortality, survival, and risk factors. Clinics in colon and rectal surgery 2009, 22 (4), 191–7. 10.1055/s-0029-1242458. - DOI - PMC - PubMed
    1. Worthley D. L.; Leggett B. A. Colorectal cancer: molecular features and clinical opportunities. Clinical biochemist. Reviews/Australian Association of Clinical Biochemists 2010, 31 (2), 31–8. - PMC - PubMed
    1. Boland C. R.; Goel A. Microsatellite instability in colorectal cancer. Gastroenterology 2010, 138 (6), 2073–2087 e3. 10.1053/j.gastro.2009.12.064. - DOI - PMC - PubMed
    1. de la Chapelle A.; Hampel H. Clinical relevance of microsatellite instability in colorectal cancer. J. Clin. Oncol. 2010, 28 (20), 3380–7. 10.1200/JCO.2009.27.0652. - DOI - PMC - PubMed
    1. Brueckl W. M.; Jung A.; Wein A.; Brabletz T.; Guenther K.; Nusko G.; Hahn E. G. Microsatellite instability in colorectal adenomas: relevance and clinical importance. International journal of colorectal disease 2000, 15 (4), 189–96. 10.1007/s003840000241. - DOI - PubMed

Publication types