

A test of the additivity of acute toxicity of binary-metal mixtures of ni with Cd, Cu, and Zn to Daphnia magna, using the inflection point of the concentration-response curves
- PMID: 26681657
- PMCID: PMC5764768
- DOI: 10.1002/etc.3342
A test of the additivity of acute toxicity of binary-metal mixtures of ni with Cd, Cu, and Zn to Daphnia magna, using the inflection point of the concentration-response curves
Abstract
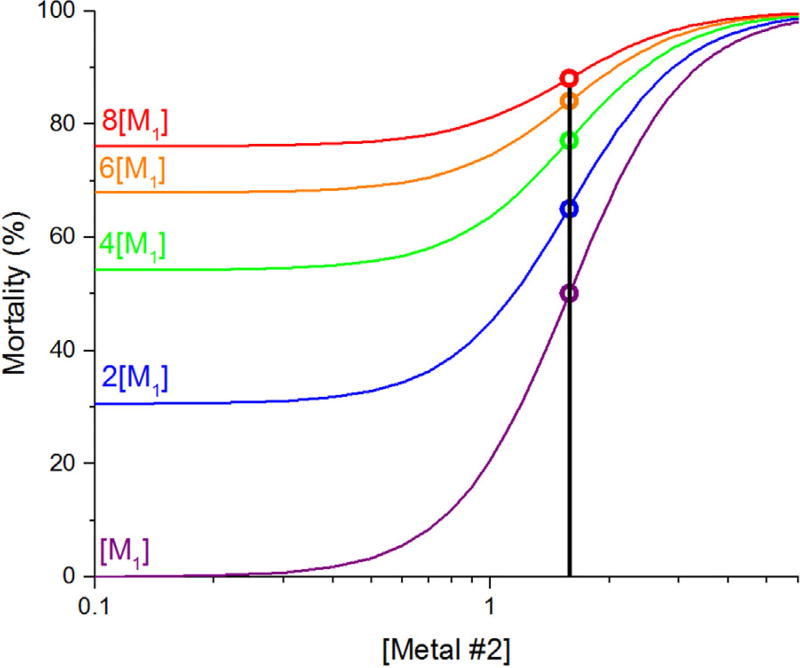
Mixtures of metals are often present in surface waters, leading to toxicity that is difficult to predict. To provide data for development of multimetal toxicity models, Daphnia magna neonates were exposed to individual metals (Cd, Cu, Ni, Zn) and to binary combinations of those metals in standard 48-h lethality tests conducted in US Environmental Protection Agency moderately hard reconstituted water with 3 mg dissolved organic carbon (DOC)/L added as Suwannee River fulvic acid. Toxicity tests were performed with mixtures of Ni and 1) Cd, which is considerably more toxic than Ni; 2) Cu, which is less toxic than Cd but more toxic than Ni; and 3) Zn, which has a toxicity threshold similar to Ni. For each combination of metals in the binary mixtures, the concentration of 1 metal was held constant while the second metal was varied through a series that ranged from nonlethal to lethal concentrations; then the roles of the metals were reversed. Inflection points of the concentration-response curves were compared to test for additivity of toxicity. Sublethal concentrations of Ni caused less-than-additive toxicity with Cd, slightly less-than-additive toxicity with Zn, and greater-than-additive toxicity with Cu. One explanation of these results might be competition among the metals for binding to biological ligands and/or dissolved organic matter. Therefore, models might have to incorporate sometimes competing chemical interactions to accurately predict metal-mixture toxicity. Environ Toxicol Chem 2016;35:1843-1851. © 2015 SETAC.
Keywords: Bioavailability; Independent action; Metal complexation; Metal-metal competition; Response addition.
© 2015 SETAC.
Figures


Similar articles
-
Acute Toxicity of Ternary Cd-Cu-Ni and Cd-Ni-Zn Mixtures to Daphnia magna: Dominant Metal Pairs Change along a Concentration Gradient.Environ Sci Technol. 2017 Apr 18;51(8):4471-4481. doi: 10.1021/acs.est.6b06169. Epub 2017 Apr 5. Environ Sci Technol. 2017. PMID: 28329444 Free PMC article.
-
Effect of age on acute toxicity of cadmium, copper, nickel, and zinc in individual-metal exposures to Daphnia magna neonates.Environ Toxicol Chem. 2017 Jan;36(1):113-119. doi: 10.1002/etc.3507. Epub 2016 Jul 21. Environ Toxicol Chem. 2017. PMID: 27225713 Free PMC article.
-
Acute toxicity of binary and ternary mixtures of Cd, Cu, and Zn to Daphnia magna.Environ Toxicol Chem. 2015 Apr;34(4):799-808. doi: 10.1002/etc.2787. Epub 2015 Feb 4. Environ Toxicol Chem. 2015. PMID: 25336231
-
Effects of copper on olfactory, behavioral, and other sublethal responses of saltwater organisms: Are estimated chronic limits using the biotic ligand model protective?Environ Toxicol Chem. 2018 Jun;37(6):1515-1522. doi: 10.1002/etc.4112. Epub 2018 Apr 6. Environ Toxicol Chem. 2018. PMID: 29442368 Review.
-
Biokinetics and tolerance development of toxic metals in Daphnia magna.Environ Toxicol Chem. 2007 May;26(5):1023-32. doi: 10.1897/06-430r.1. Environ Toxicol Chem. 2007. PMID: 17521151 Review.
Cited by
-
Acute Toxicity of Ternary Cd-Cu-Ni and Cd-Ni-Zn Mixtures to Daphnia magna: Dominant Metal Pairs Change along a Concentration Gradient.Environ Sci Technol. 2017 Apr 18;51(8):4471-4481. doi: 10.1021/acs.est.6b06169. Epub 2017 Apr 5. Environ Sci Technol. 2017. PMID: 28329444 Free PMC article.
-
Sensitivity of Ostracods to U, Cd and Cu: The Case of Cypridopsis vidua.Toxics. 2022 Jun 24;10(7):349. doi: 10.3390/toxics10070349. Toxics. 2022. PMID: 35878254 Free PMC article.
-
Age-related differences in sensitivity to metals can matter for Daphnia magna neonates.Integr Environ Assess Manag. 2017 Jan;13(1):208-210. doi: 10.1002/ieam.1858. Integr Environ Assess Manag. 2017. PMID: 27982533 Free PMC article. No abstract available.
-
Effect of age on acute toxicity of cadmium, copper, nickel, and zinc in individual-metal exposures to Daphnia magna neonates.Environ Toxicol Chem. 2017 Jan;36(1):113-119. doi: 10.1002/etc.3507. Epub 2016 Jul 21. Environ Toxicol Chem. 2017. PMID: 27225713 Free PMC article.
-
Evaluating additive versus interactive effects of copper and cadmium on Daphnia pulex life history.Environ Sci Pollut Res Int. 2020 Jan;27(2):2015-2026. doi: 10.1007/s11356-019-06622-9. Epub 2019 Nov 25. Environ Sci Pollut Res Int. 2020. PMID: 31768955 Free PMC article.
References
-
- Allen HE, Luther GW, Garrison W. Metals in Surface Waters. Ann Arbor, Chelsea MI, USA: 1997.
-
- Meyer JS, Farley KJ, Garman ER. Metal Mixtures Modeling Evaluation Project: 1. Background. Environ Toxicol Chem. 2015;34:726–740. - PubMed
-
- Bury N, Shaw J, Glover C, Hogstrand C. Derivation of a toxicity-based model to predict how water chemistry influences silver toxicity to invertebrates. Comp Biochem Physiol C Toxicol Pharmacol. 2002;133:259–270. - PubMed
-
- Meyer JS, Clearwater SJ, Doser TA, Rogaczewski MJ, Hansen JA. Effects of Water Chemistry on Bioavailability and Toxicity of Waterborne Cadmium, Copper, Nickel, Lead, and Zinc to Freshwater Organisms. SETAC; Pensacola, FL, USA: 2007.
-
- Paquin PR, Gorsuch JW, Apte S, Batley GE, Bowles KC, Campbell PG, Delos CG, Di Toro DM, Dwyer RL, Galvez F. The biotic ligand model: A historical overview. Comp Biochem Physiol C Toxicol Pharmacol. 2002;133:3–35. - PubMed
MeSH terms
Substances
Grants and funding
LinkOut - more resources
Full Text Sources
Other Literature Sources
