

Sequential treatment with 5-aza-2'-deoxycytidine and deacetylase inhibitors reactivates HIV-1
- PMID: 26681773
- PMCID: PMC4734845
- DOI: 10.15252/emmm.201505557
Sequential treatment with 5-aza-2'-deoxycytidine and deacetylase inhibitors reactivates HIV-1
Abstract
Reactivation of HIV gene expression in latently infected cells together with an efficient cART has been proposed as an adjuvant therapy aimed at eliminating/decreasing the reservoir size. Results from HIV clinical trials using deacetylase inhibitors (HDACIs) question the efficiency of these latency-reversing agents (LRAs) used alone and underline the need to evaluate other LRAs in combination with HDACIs. Here, we evaluated the therapeutic potential of a demethylating agent (5-AzadC) in combination with clinically tolerable HDACIs in reactivating HIV-1 from latency first in vitro and next ex vivo. We showed that a sequential treatment with 5-AzadC and HDACIs was more effective than the corresponding simultaneous treatment both in vitro and ex vivo. Interestingly, only two of the sequential LRA combinatory treatments tested induced HIV-1 particle recovery in a higher manner than the drugs alone ex vivo and at concentrations lower than the human tolerable plasmatic concentrations. Taken together, our data reveal the benefit of using combinations of 5-AzadC with an HDACI and, for the first time, the importance of treatment time schedule for LRA combinations in order to reactivate HIV.
Keywords: HDACIs; HIV latency; HIV reservoir; demethylating agent; epigenetics.
© 2015 The Authors. Published under the terms of the CC BY 4.0 license.
Figures
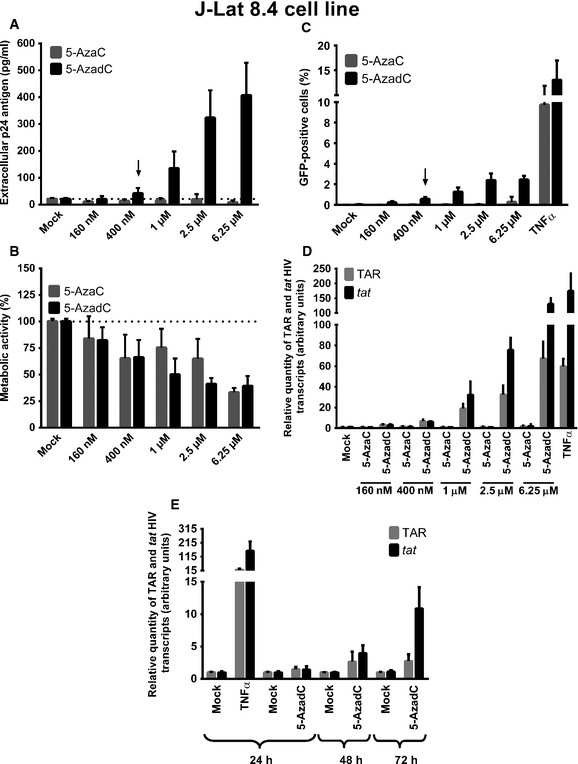
- A–D
J‐Lat 8.4 cells were mock‐treated or treated with increasing concentrations of 5‐AzadC or 5‐AzaC. At 72 h post‐treatment, viral production was measured by quantifying p24 antigen production in culture supernatants (A); metabolic activity was assessed by a
WST ‐1 assay (B); viral protein expression was analyzed byFACS (C); and initiated (primersTAR ) or elongated (primers tat) transcripts were quantified byRT –qPCR (D). The selected dose was indicated by an arrow. - E
J‐Lat 8.4 cells were mock‐treated or treated with 5‐AzadC (400
nM ) orTNF ‐α (10 ng/ml) as a positive control. At 24, 48 or 72 h post‐treatment, initiated (primersTAR ) or elongated (primers tat) transcripts were quantified byRT –qPCR .
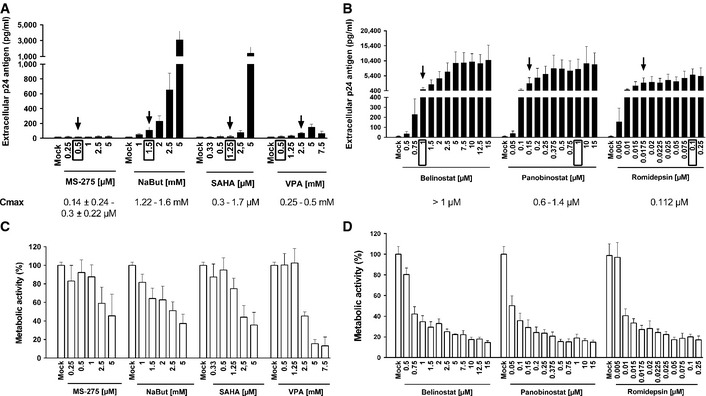
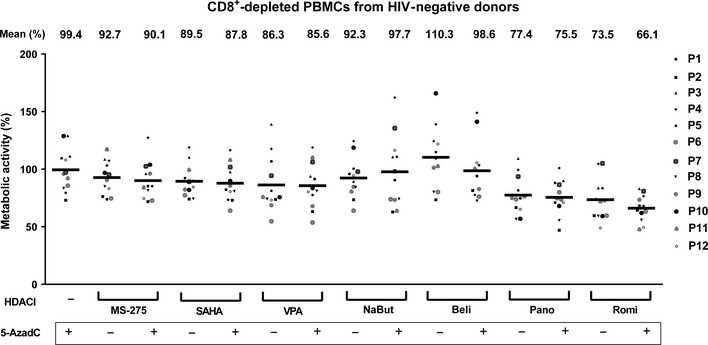
- A–D
J‐Lat 8.4 cells were mock‐treated or treated with increasing concentrations of
HDACI s. At 24 h post‐treatment, viral production was measured by quantifying p24 antigen production in culture supernatants (A, B) and metabolic activity was assessed by aWST ‐1 assay (C, D). Means and standard errors of the means from three independent biological duplicates (n = 6) are indicated. The result obtained with mock‐treated cells was arbitrarily set at a value of 100% (C, D). The selected doses are indicated by an arrow. Plasmatic concentrations after usual dosage (C max) of each drug in human therapy are indicated below theLRA names and by a box in the graph.
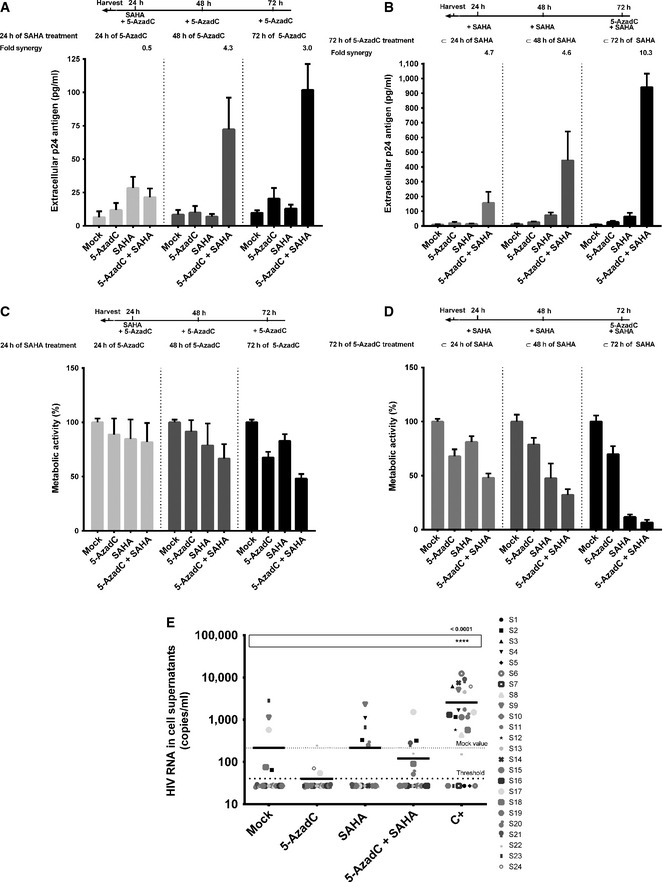
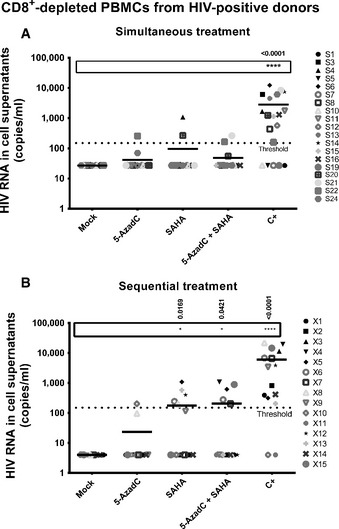
- A–D
J‐Lat 8.4 cell line was mock‐treated or treated with 5‐AzadC and/or
SAHA for different periods of time as indicated. Samples were harvested at the indicated times. Viral production was measured by quantifying p24 antigen production in culture supernatants (A, B) and metabolic activity was assessed by aWST ‐1 assay (C, D). Means and standard errors of the means from three independent biological duplicates (n = 6) are indicated. The result obtained with mock‐treated cells was arbitrarily set at a value of 100% (C, D). - E
From data of ex vivo cultures of
CD 8+‐depletedPBMC s isolated from 24HIV + patients presented in Appendix Table S2, the extracellularHIV ‐1 genomicRNA levels for eachLRA treatment are represented. One night after cell purification, cells were mock‐treated or simultaneously treated with 5‐AzadC (1 μM) and/orSAHA (1 μM). Six days after treatment, the concentration of viralRNA in culture supernatants was determined (in copies/ml). The results were reported as the actualHIV RNA copy numbers/ml or as an estimated value calculated as 50% of the smallest value whenHIV RNA was not detected in order to assign a log value. Means are represented. Nonparametric one‐wayANOVA for independent samples (Kruskal–Wallis) followed by paired comparisons between each treated condition and the mock‐treated condition (Mann–Whitney test) are performed.
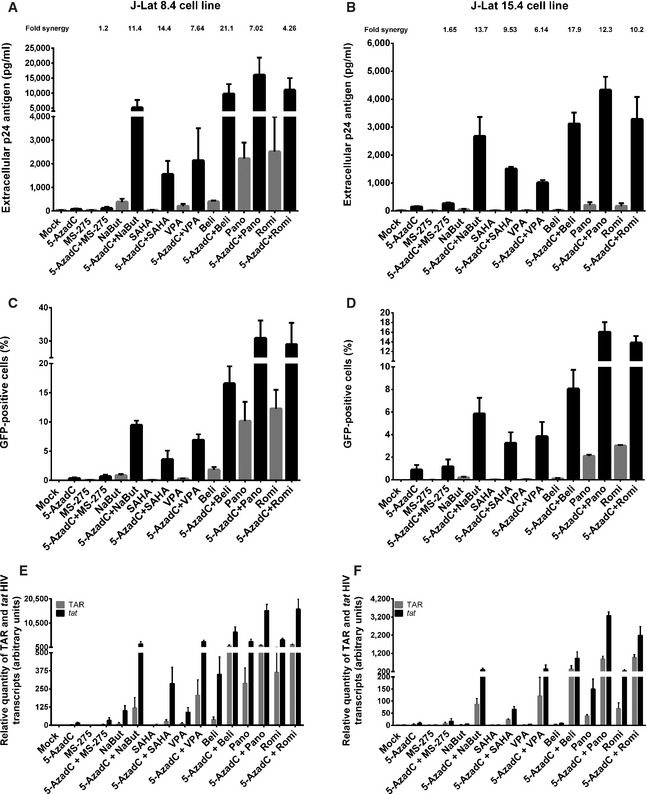
- A–F
J‐Lat 8.4 (A, C, E) and 15.4 (B, D, F) cell lines were mock‐treated or treated with 5‐AzadC. At 48 h post‐treatment,
HDACI s were then added for 24 h. At 72 h 5‐AzadC post‐treatment, samples were harvested and analyzed as follows: viral p24 production in the cell supernatant was measured (A, B);FACS analyses were performed and the percentages ofGFP + cells are presented as histograms (C, D); initiated (primersTAR ) or elongated (primers tat) transcripts were quantified byRT –qPCR , and results were normalized using the β‐actin gene primers and are presented as histograms representing fold inductions compared to the mock‐treated condition (E, F). Means and standard errors of the means from three independent biological duplicates (n = 6) are indicated. The result obtained with mock‐treated cells was arbitrarily set at a value of 1 (E, F).
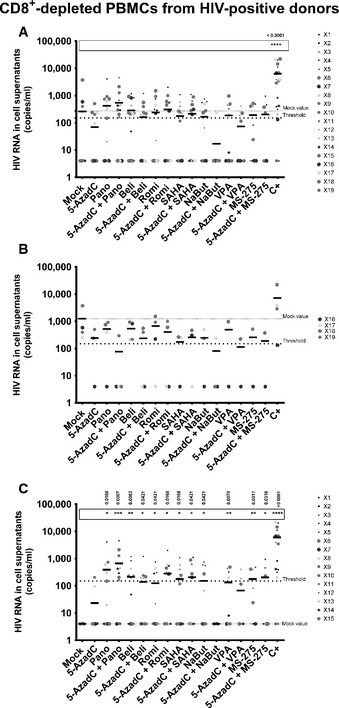
- A–C
From data of ex vivo cultures of
CD 8+‐depletedPBMC s isolated fromHIV + patients (Table 2), the extracellularHIV ‐1 genomicRNA levels for eachLRA treatment are represented from all patient cell cultures (A), from patient cell cultures presenting no viral reactivation in mock condition (C), and from patient cell cultures exhibiting reactivation in mock condition (B). One night after cell purification, cells were mock‐treated or treated with 5‐AzadC. Three days post‐treatment, 1/3 of medium was replaced andHDACI s were added to the cultures. Six days after 5‐AzadC treatment, the concentration of viralRNA in culture supernatants was determined (in copies/ml). The results were reported as the actualHIV RNA copy numbers/ml or as an estimated value calculated as 50% of the smallest value whenHIV RNA was not detected in order to assign a log value. Means are represented. Nonparametric one‐wayANOVA for independent samples (Kruskal–Wallis) followed by paired comparisons between each treated condition and the mock‐treated condition (Mann–Whitney test) are performed.
Reactivation status of patient cell cultures presenting no viral reactivation in mock condition isolated from aviremic
cART ‐treatedHIV + patients (shown in Appendix Table S2).Reactivation status of patient cell cultures presenting no viral reactivation in mock condition isolated from aviremic
cART ‐treatedHIV + patients (shown in Table 2).
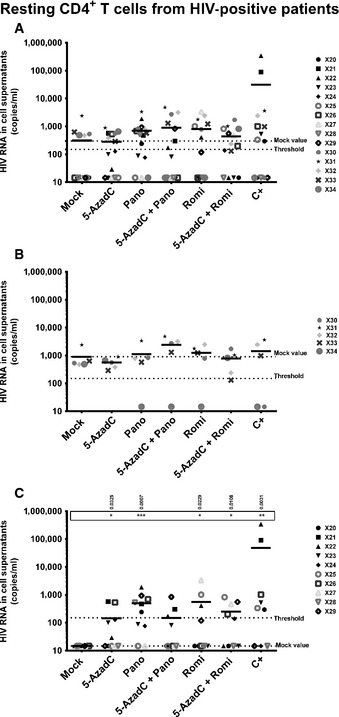
- A–C
From data of ex vivo cultures of resting
CD 4+ T cells isolated fromHIV + patients (Table 3), the extracellularHIV ‐1 genomicRNA levels for eachLRA treatment are represented from all patient cell cultures (A), from patient cell cultures presenting no viral reactivation in mock condition (C), and from patient cell cultures exhibiting reactivation in mock condition (B). One night after cell purification, cells were mock‐treated or treated with 5‐AzadC. Three days post‐treatment, 1/3 of medium was replaced andHDACI s were added in the cultures. Six days after 5‐AzadC treatment, the concentration of viralRNA in culture supernatants was determined (in copies/ml). The results were reported as the actualHIV RNA copy numbers/ml or as an estimated value calculated as 50% of the smallest value whenHIV RNA was not detected in order to assign a log value. Means are represented. Nonparametric one‐wayANOVA for independent samples (Kruskal–Wallis) followed by paired comparisons between each treated condition and the mock‐treated condition (Mann–Whitney test) are performed.
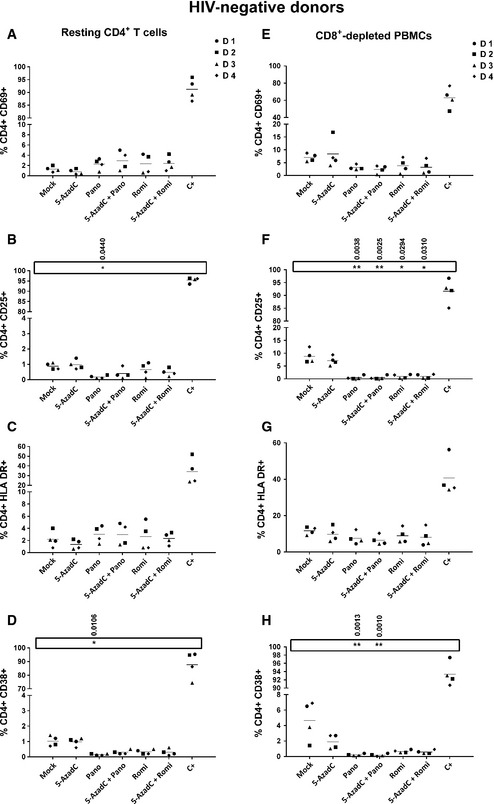
- A–H
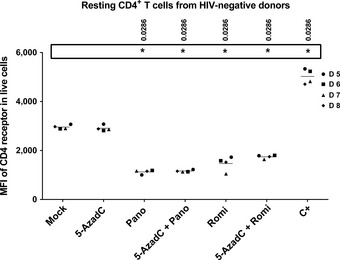
One night after cell purification,
CD 8+‐depletedPBMC s (E–H) orHLA DR −CD 69−CD 25−CD 4+ T cells (A–D) from 4HIV ‐negative donors were mock‐treated or treated with 5‐AzadC. Three days post‐treatment, 1/3 of medium was replaced andHDACI s were added to the cultures. The activation status ofCD 4+ T‐cell subset was assessed 6 days after 5‐AzadC treatment by flow cytometry analysis of cellular activation markers relative to mock treatment before 5‐AzadC stimulation corresponding to day 0. Means are represented. Nonparametric one‐wayANOVA for independent samples (Kruskal–Wallis) followed by paired comparisons between each treated condition and the mock‐treated condition (Mann–Whitney test) are performed.
References
-
- Adam E, Quivy V, Bex F, Chariot A, Collette Y, Vanhulle C, Schoonbroodt S, Goffin V, Nguyen TL, Gloire G et al (2003) Potentiation of tumor necrosis factor‐induced NF‐kappa B activation by deacetylase inhibitors is associated with a delayed cytoplasmic reappearance of I kappa B alpha. Mol Cell Biol 23: 6200–6209 - PMC - PubMed
Publication types
MeSH terms
Substances
LinkOut - more resources
Full Text Sources
Other Literature Sources
