. 2016 Feb 15;25(4):755-65.
doi: 10.1093/hmg/ddv612. Epub 2015 Dec 17.

Whole chromosome aneuploidy in the brain of Bub1bH/H and Ercc1-/Δ7 mice

Affiliations

Whole chromosome aneuploidy in the brain of Bub1bH/H and Ercc1-/Δ7 mice

Grasiella A Andriani et al. Hum Mol Genet. .

Abstract

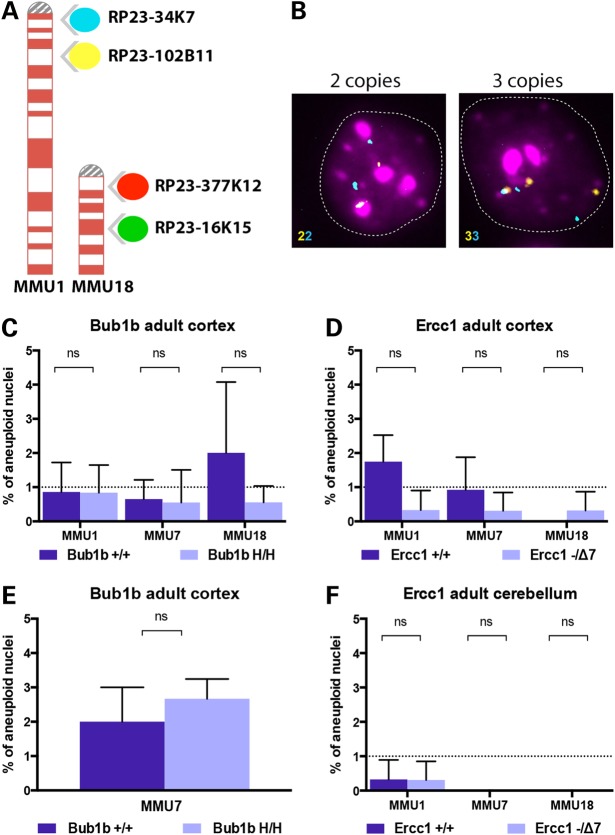
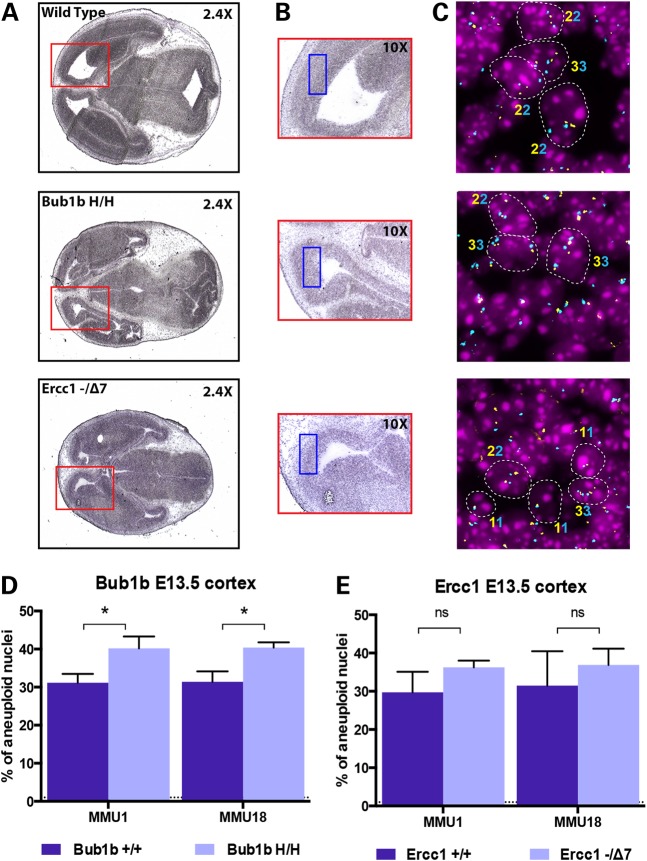
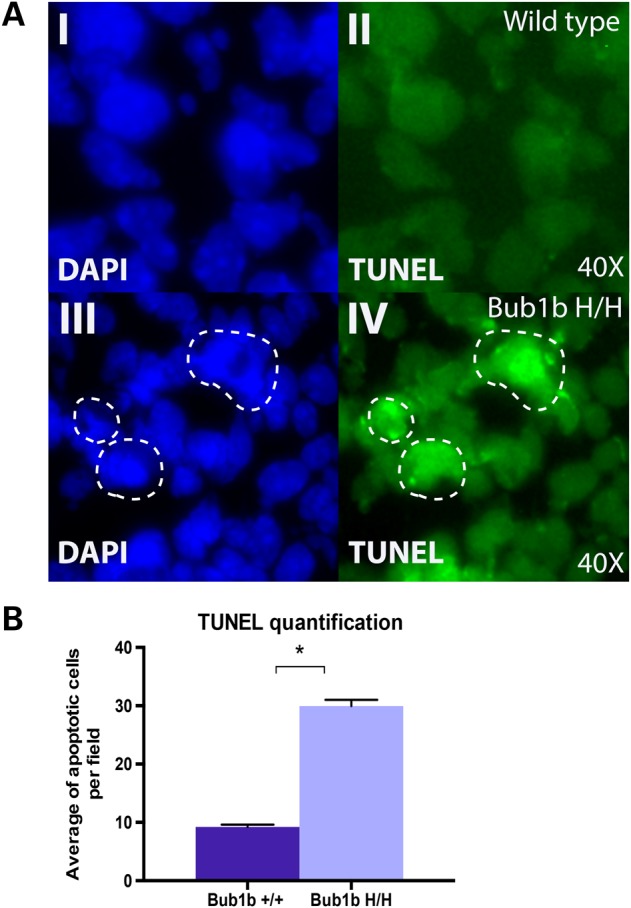
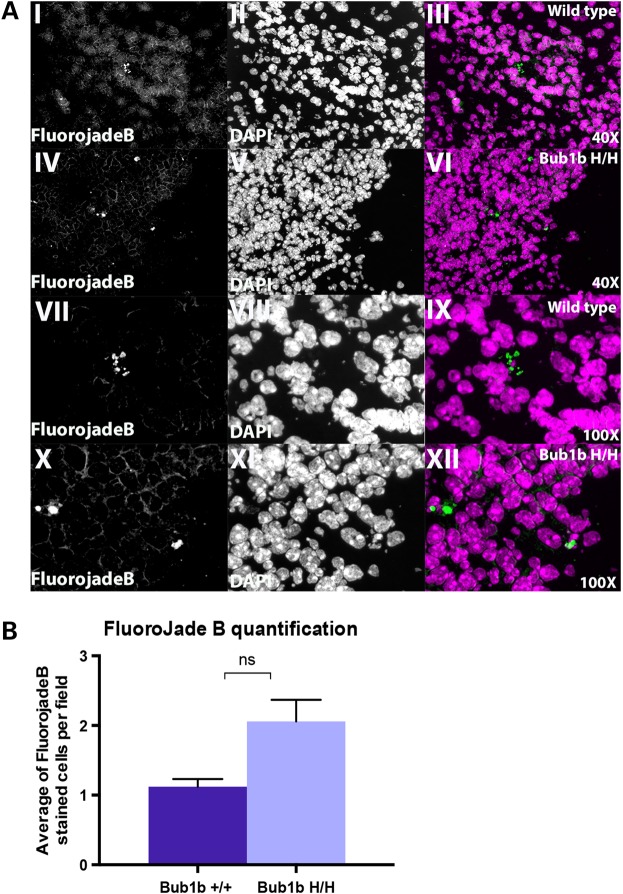
High levels of aneuploidy have been observed in disease-free tissues, including post-mitotic tissues such as the brain. Using a quantitative interphase-fluorescence in situ hybridization approach, we previously reported a chromosome-specific, age-related increase in aneuploidy in the mouse cerebral cortex. Increased aneuploidy has been associated with defects in DNA repair and the spindle assembly checkpoint, which in turn can lead to premature aging. Here, we quantified the frequency of aneuploidy of three autosomes in the cerebral cortex and cerebellum of adult and developing brain of Bub1b(H/H) mice, which have a faulty mitotic checkpoint, and Ercc1(-/Δ7) mice, defective in nucleotide excision repair and inter-strand cross-link repair. Surprisingly, the level of aneuploidy in the brain of these murine models of accelerated aging remains as low as in the young adult brains from control animals, i.e. <1% in the cerebral cortex and ∼0.1% in the cerebellum. Therefore, based on aneuploidy, these adult mice with reduced life span and accelerated progeroid features are indistinguishable from age-matched, normal controls. Yet, during embryonic development, we found that Bub1b(H/H), but not Ercc1(-/Δ7) mice, have a significantly higher frequency of aneuploid nuclei relative to wild-type controls in the cerebral cortex, reaching a frequency as high as 40.3% for each chromosome tested. Aneuploid cells in these mutant mice are likely eliminated early in development through apoptosis and/or immune-mediated clearance mechanisms, which would explain the low levels of aneuploidy during adulthood in the cerebral cortex of Bub1b(H/H) mice. These results shed light on the mechanisms of removal of aneuploidy cells in vivo.


Figures

Figure 1.
Figure 1.
Probes used for FISH analysis and aneuploidy levels in adult mice. (A) Four differently labeled BAC clones (spectrum aqua, far red, spectrum orange and spectrum green) mapping to mouse chromosomes 1 and 18 at two distinct genomic loci enable the identification of diploid from aneuploid cells. (B) Two-color interphase FISH: the identification of whole chromosome loss or gain is determined by the numerical correspondence between the two colors. Representative hybridizations of cortical nuclei. Left panel shows a nucleus with two copies for MMU1 (2n) and right panel shows an aneuploid nucleus that contains three copies (gain). (C) Aneuploidy levels measured in the cortex of 6-month-old Bub1bH/H mice and age-matched controls. (D) Aneuploidy levels measured in the cortex of 14-week-old Ercc1−/Δ7 mice and age-matched controls. (E) Additional analysis of aneuploidy levels for MMU7 measured in the cortex of 6-month-old Bub1bH/H mice and age-matched controls. (F) Aneuploidy levels measured in the cerebellum of 14-week-old Ercc1−/Δ7 mice and age-matched controls. No statistically significant increase in aneuploidy was observed for the three chromosomes tested in these models at the selected time points.
Figure 2.
Figure 2.
Analysis of aneuploidy during the embryonic brain development. (A) Representative H&E staining of E13.5 head section of WT, Bub1bH/H and Ercc1−/Δ7 mice. The red square depicted in the 2.4× magnification box is indicative of the embryonic brain area. (B) Higher magnification of the same sections highlighting the developing cortex in which aneuploidy analysis was performed. The blue square depicted in the 10× magnification indicates the specific area where the FISH analysis was performed. (C) Representative FISH images for MMU1 in each mouse strain highlighting diploid and aneuploid cells (contours) and respective ploidy (the numbers of signals are indicated with the correspondent color of the fluorophore used for staining). (D) Aneuploidy levels measured in the developing cortex of E13.5 Bub1bH/H mice and age-matched controls. The increase in aneuploidy is statistically significant for both chromosomes (*P = 0.0159 for MMU1 and *P = 0.0072 for MMU18). (E) Aneuploidy levels measured in the developing cortex of E13.5 Ercc1−/Δ7 mice and age-matched controls. The increase in aneuploidy is not statistically significant for either chromosome (P = 0.1149 for MMU1 and P = 0.3997 for MMU18).
Figure 3.
Figure 3.
Analysis of cell death by TUNEL staining in the developing cortex: (A) Representative images from TUNEL staining in E13.5 WT (top) and Bub1bH/H (bottom) mice. (I  and III) DAPI nuclei staining only; (II and IV) fluorescein TUNEL staining only. (B) Quantification of TUNEL staining images represented as the average of apoptotic cells per 40× field per genotype. The difference is statistically significant (*P = 0.00148).
Figure 4.
Figure 4.
Analysis of degenerating neurons by Fluoro-jade B labeling in the developing cortex. (A) Representative images from Fluoro-jade B staining in E13.5 WT and Bub1bH/H mice at 40× and 100× magnifications. (I and IV) 40× Fluoro-jade B staining only; (II and V) 40× DAPI nuclei staining only; (III and VI) 40× merged image; (VII and X) 100× Fluoro-jade B staining only; (VIII and XI) 100× DAPI nuclei staining only; (IX and XII) 100× merged image. (B) Quantification of Fluoro-jade B staining images represented as average of positively stained cells per 40× field per genotype. The difference is not statistically significant (P = 0.05612).
Figure 5.
Figure 5.
Analysis of macrophage infiltration in the developing cortex (Adgre1 marker, i.e. F4/80): (A) Representative images from Adgre1 IF staining in E13.5 WT and Bub1bH/H mice at low (10×) and higher magnifications (40×). (I and IV) 10× Adgre1 staining only; (II and V) 10× DAPI nuclei staining only; (III and VI) 10× merged image; (VII and X) 40× Adgre1 staining only; (VIII and XI) 40× DAPI nuclei staining only; (IX and XII) 40× merged image. (B) Quantification of Adgre1 IF staining represented as average of positively stained cells per 40× field per genotype. The difference is not statistically significant (P = 0.29294).

References

    1. Maslov A.Y., Vijg J. (2009) Genome instability, cancer and aging. Biochim. Biophys. Acta, 1790, 963–969. - PMC - PubMed
    1. Vijg J., Suh Y. (2013) Genome instability and aging. Ann. Rev. Physiol., 75, 645–668. - PubMed
    1. Faggioli F., Vijg J., Montagna C. (2011) Chromosomal aneuploidy in the aging brain. Mech. Ageing Dev., 132, 429–436. - PMC - PubMed
    1. Hanks S., Coleman K., Reid S., Plaja A., Firth H., Fitzpatrick D., Kidd A., Mehes K., Nash R., Robin N. et al. (2004) Constitutional aneuploidy and cancer predisposition caused by biallelic mutations in BUB1B. Nat. Genetics, 36, 1159–1161. - PubMed
    1. Ricke R.M., van Deursen J.M. (2013) Aneuploidy in health, disease, and aging. J. Cell Biol., 201, 11–21. - PMC - PubMed

Publication types

MeSH terms