Equine Metabolic Syndrome Affects Viability, Senescence, and Stress Factors of Equine Adipose-Derived Mesenchymal Stromal Stem Cells: New Insight into EqASCs Isolated from EMS Horses in the Context of Their Aging
- PMID: 26682006
- PMCID: PMC4670679
- DOI: 10.1155/2016/4710326
Equine Metabolic Syndrome Affects Viability, Senescence, and Stress Factors of Equine Adipose-Derived Mesenchymal Stromal Stem Cells: New Insight into EqASCs Isolated from EMS Horses in the Context of Their Aging
Abstract
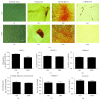
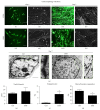
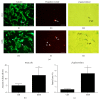
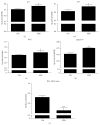
Currently, equine metabolic syndrome (EMS), an endocrine disease linked to insulin resistance, affects an increasing number of horses. However, little is known about the effect of EMS on mesenchymal stem cells that reside in adipose tissue (ASC). Thus it is crucial to evaluate the viability and growth kinetics of these cells, particularly in terms of their application in regenerative medicine. In this study, we investigated the proliferative capacity, morphological features, and accumulation of oxidative stress factors in mesenchymal stem cells isolated from healthy animals (ASCN) and horses suffering from EMS (ASCEMS). ASCEMS displayed senescent phenotype associated with β-galactosidase accumulation, enlarged cell bodies and nuclei, increased apoptosis, and reduced heterochromatin architecture. Moreover, we observed increased amounts of nitric oxide (NO) and reactive oxygen species (ROS) in these cells, accompanied by reduced superoxide dismutase (SOD) activity. We also found in ASCEMS an elevated number of impaired mitochondria, characterized by membrane raptures, disarrayed cristae, and vacuole formation. Our results suggest that the toxic compounds, accumulating in the mitochondria under oxidative stress, lead to alternations in their morphology and may be partially responsible for the senescent phenotype and decreased proliferation potential of ASCEMS.
Figures


Similar articles
-
The Effect of Methyl-β-cyclodextrin on Apoptosis, Proliferative Activity, and Oxidative Stress in Adipose-Derived Mesenchymal Stromal Cells of Horses Suffering from Metabolic Syndrome (EMS).Molecules. 2018 Jan 30;23(2):287. doi: 10.3390/molecules23020287. Molecules. 2018. PMID: 29385746 Free PMC article.
-
Macroautophagy and Selective Mitophagy Ameliorate Chondrogenic Differentiation Potential in Adipose Stem Cells of Equine Metabolic Syndrome: New Findings in the Field of Progenitor Cells Differentiation.Oxid Med Cell Longev. 2016;2016:3718468. doi: 10.1155/2016/3718468. Epub 2016 Dec 8. Oxid Med Cell Longev. 2016. PMID: 28053691 Free PMC article.
-
Orientin Reverses Premature Senescence in Equine Adipose Stromal Cells Affected by Equine Metabolic Syndrome Through Oxidative Stress Modulation.Int J Mol Sci. 2025 Jul 17;26(14):6867. doi: 10.3390/ijms26146867. Int J Mol Sci. 2025. PMID: 40725115 Free PMC article.
-
Glucose homeostasis and the enteroinsular axis in the horse: a possible role in equine metabolic syndrome.Vet J. 2014 Jan;199(1):11-8. doi: 10.1016/j.tvjl.2013.09.064. Epub 2013 Oct 4. Vet J. 2014. PMID: 24287206 Review.
-
Advanced nutritional and stem cells approaches to prevent equine metabolic syndrome.Res Vet Sci. 2018 Jun;118:115-125. doi: 10.1016/j.rvsc.2018.01.015. Epub 2018 Jan 31. Res Vet Sci. 2018. PMID: 29421480 Review.
Cited by
-
Adipose-Derived Stromal/Stem Cells from Large Animal Models: from Basic to Applied Science.Stem Cell Rev Rep. 2021 Jun;17(3):719-738. doi: 10.1007/s12015-020-10049-y. Epub 2020 Oct 6. Stem Cell Rev Rep. 2021. PMID: 33025392 Free PMC article. Review.
-
Cladophora glomerata methanolic extract promotes chondrogenic gene expression and cartilage phenotype differentiation in equine adipose-derived mesenchymal stromal stem cells affected by metabolic syndrome.Stem Cell Res Ther. 2019 Dec 17;10(1):392. doi: 10.1186/s13287-019-1499-z. Stem Cell Res Ther. 2019. PMID: 31847882 Free PMC article.
-
Immunomodulatory Properties of Adipose-Derived Stem Cells Treated with 5-Azacytydine and Resveratrol on Peripheral Blood Mononuclear Cells and Macrophages in Metabolic Syndrome Animals.J Clin Med. 2018 Oct 24;7(11):383. doi: 10.3390/jcm7110383. J Clin Med. 2018. PMID: 30356025 Free PMC article.
-
Sex hormone-binding globulin (SHBG) mitigates ER stress and improves viability and insulin sensitivity in adipose-derived mesenchymal stem cells (ASC) of equine metabolic syndrome (EMS)-affected horses.Cell Commun Signal. 2023 Sep 11;21(1):230. doi: 10.1186/s12964-023-01254-6. Cell Commun Signal. 2023. PMID: 37697311 Free PMC article.
-
Diabetic microenvironment deteriorates the regenerative capacities of adipose mesenchymal stromal cells.Diabetol Metab Syndr. 2024 Jun 16;16(1):131. doi: 10.1186/s13098-024-01365-1. Diabetol Metab Syndr. 2024. PMID: 38880916 Free PMC article.
References
-
- Friedman J. M. Obesity in the new millennium. Nature. 2000;404(6778):632–634. - PubMed
-
- World Health Organization. WHO Rport. Global Status Report on NCDs; 2010. WHO Report burden: mortality, morbidity and risk factors.
-
- Basinska K., Marycz K., Śmieszek A., Nicpoń J. The production and distribution of IL-6 and TNF-α in subcutaneous adipose tissue and their correlation with serum concentrations in Welsh ponies with equine metabolic syndrome. Journal of Veterinary Science. 2015;16(1):113–120. doi: 10.4142/jvs.2015.16.1.113. - DOI - PMC - PubMed
MeSH terms
LinkOut - more resources
Full Text Sources
Other Literature Sources
Medical
Miscellaneous

