. 2016 Feb 10:223:157-164.
doi: 10.1016/j.jconrel.2015.12.001. Epub 2015 Dec 10.

Multiparameter evaluation of in vivo gene delivery using ultrasound-guided, microbubble-enhanced sonoporation

Affiliations

Multiparameter evaluation of in vivo gene delivery using ultrasound-guided, microbubble-enhanced sonoporation

Galina Shapiro et al. J Control Release. .

Abstract

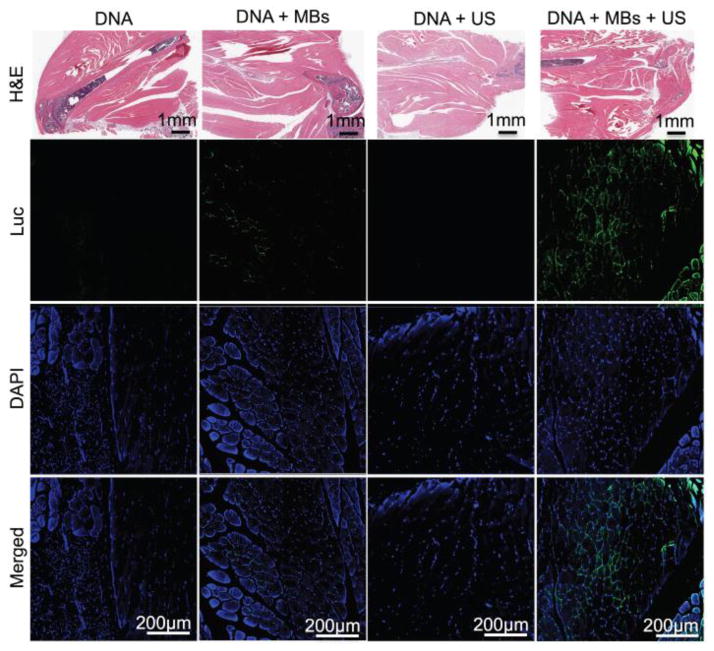
More than 1800 gene therapy clinical trials worldwide have targeted a wide range of conditions including cancer, cardiovascular diseases, and monogenic diseases. Biological (i.e. viral), chemical, and physical approaches have been developed to deliver nucleic acids into cells. Although viral vectors offer the greatest efficiency, they also raise major safety concerns including carcinogenesis and immunogenicity. The goal of microbubble-mediated sonoporation is to enhance the uptake of drugs and nucleic acids. Insonation of microbubbles is thought to facilitate two mechanisms for enhanced uptake: first, deflection of the cell membrane inducing endocytotic uptake, and second, microbubble jetting inducing the formation of pores in the cell membrane. We hypothesized that ultrasound could be used to guide local microbubble-enhanced sonoporation of plasmid DNA. With the aim of optimizing delivery efficiency, we used nonlinear ultrasound and bioluminescence imaging to optimize the acoustic pressure, microbubble concentration, treatment duration, DNA dosage, and number of treatments required for in vivo Luciferase gene expression in a mouse thigh muscle model. We found that mice injected with 50μg luciferase plasmid DNA and 5×10(5) microbubbles followed by ultrasound treatment at 1.4MHz, 200kPa, 100-cycle pulse length, and 540 Hz pulse repetition frequency (PRF) for 2min exhibited superior transgene expression compared to all other treatment groups. The bioluminescent signal measured for these mice on Day 4 post-treatment was 100-fold higher (p<0.0001, n=5 or 6) than the signals for controls treated with DNA injection alone, DNA and microbubble injection, or DNA injection and ultrasound treatment. Our results indicate that these conditions result in efficient gene delivery and prolonged gene expression (up to 21days) with no evidence of tissue damage or off-target delivery. We believe that these promising results bear great promise for the development of microbubble-enhanced sonoporation-induced gene therapies.

Keywords: “Gene therapy”; “Microbubbles”; “Sonoporation”; “Ultrasound”.


Figures

Fig. 1
Fig. 1
Experimental design. A. On Day 0 the mice were injected with a mixture of plasmid DNA (pLuc2) and microbubbles. Immediately after the injection, an ultrasound sequence was applied. Follow-up bioluminescence imaging (BLI) was performed on Days 1, 4, 7, 14, and 21. B and C. On Day 0 ultrasound gel was used to couple the thigh (red arrow) to a spacer on the ultrasound transducer. D and E. With the aid of ultrasound guidance (D, the thigh [marked by a red circle] can be seen on the top of the spacer [marked by a yellow line]), we injected the thigh (E, needle in the thigh [marked by a blue line] can be seen injecting the microbubbles [marked by a red arrow]) with the plasmid DNA – microbubble mix. F and G. During treatment (F, red arrow marks microbubbles) and immediately afterward (G), the injection site was visualized using a contrast-enhanced mode.
Fig. 2
Fig. 2
Luciferase expression profile in mice treated with microbubble-enhanced sonoporation at various acoustic pressures. Mice were injected once with 50 μg plasmid DNA premixed with 5 x 10⁵ microbubbles and then treated with an acoustic pressure of 50 kPa, 100 kPa, 200 kPa, 250 kPa, or 320 kPa for 2 minutes. The treatment effect was monitored using BLI for 21 days after treatment.
Fig. 3
Fig. 3
Luciferase expression profile in mice treated with microbubble-enhanced sonoporation at various microbubble doses. Mice were injected once with 50 μg plasmid DNA premixed with 5 x 10⁴, 105, 5 x 10⁵, 106, or 5 x 10⁶ microbubbles and then treated with an acoustic pressure of 200 kPa for 2 minutes. The treatment effect was monitored using BLI for 21 days after treatment.
Fig. 4
Fig. 4
Luciferase expression profile in mice treated with microbubble-enhanced sonoporation and with various total treatment times. Mice were injected once with 50 μg plasmid DNA premixed with 5 x 10⁵ microbubbles and then treated with an acoustic pressure of 200 kPa for 0.5 min, 1 min, 2 min, 3 min, or 10 min. The animals. The treatment effect was monitored using BLI for 21 days after treatment.
Fig. 5
Fig. 5
Luciferase expression profile in mice treated with microbubble-enhanced sonoporation at various DNA doses and, in some groups, with repeated treatments. Mice were injected once with 25 μg, 50 μg, or 100 μg DNA premixed with 5 x 10⁵ microbubbles and then treated with an acoustic pressure of 200 kPa for 2 min. Other mice were injected with 25 μg or 50 μg DNA premixed with 5 x 10⁵ microbubbles treated with an acoustic pressure of 200 kPa for 2 min and then injected and treated again using the same parameters. The treatment effect was monitored using BLI for 21 days after treatment.
Fig. 6
Fig. 6
A. Luciferase expression profile in mice treated with microbubble-enhanced sonoporation of Luc2 in vivo. Mice were injected once with 50 μg plasmid DNA (DNA and DNA + US groups), or 50 μg plasmid DNA premixed with 5 x 10⁵ microbubbles (DNA + MBs and DNA + MBs + US groups) and then treated with an acoustic pressure of 200 kPa for 2 min (DNA + US and DNA + MBs + US group). The treatment effect was monitored using BLI for 21 days after treatment. B. Representative images obtained in each group (respectively in panels B, C, D, and E) on Day 4 with the region of interest indicated by a red oval.
Fig. 7
Fig. 7
In situ luciferase expression induced by microbubble-enhanced sonoporation of Luc2 in vivo and detected by immunofluorescent staining. Mice were injected once with 50ug plasmid DNA (DNA and DNA + US groups), or 50ug plasmid DNA premixed with 5 x 10⁵ microbubbles (DNA + MBs and DNA + MBs + US groups) and then treated with an acoustic pressure of 200 kPa for 2 min (DNA + US and DNA + MBs + US group). Thigh muscle sections were treated with H&E or with immunofluorescent staining of luciferase with a DAPI counterstain.

References

    1. Ginn SL, Alexander IE, Edelstein ML, Abedi MR, Wixon J. Gene therapy clinical trials worldwide to 2012 - an update. The journal of gene medicine. 2013;15:65–77. - PubMed
    1. Baum C, Kustikova O, Modlich U, Li ZX, Fehse B. Mutagenesis and oncogenesis by chromosomal insertion of gene transfer vectors. Hum Gene Ther. 2006;17:253–263. - PubMed
    1. Bessis N, GarciaCozar FJ, Boissier MC. Immune responses to gene therapy vectors: influence on vector function and effector mechanisms. Gene Ther. 2004;11:S10–S17. - PubMed
    1. Waehler R, Russell SJ, Curiel DT. Engineering targeted viral vectors for gene therapy. Nat Rev Genet. 2007;8:573–587. - PMC - PubMed
    1. Bouard D, Alazard-Dany N, Cosset FL. Viral vectors: from virology to transgene expression. Brit J Pharmacol. 2009;157:153–165. - PMC - PubMed

Publication types