. 2015 Dec 18;10(12):e0145286.
doi: 10.1371/journal.pone.0145286. eCollection 2015.

A Modified Murine Embryonic Stem Cell Test for Evaluating the Teratogenic Effects of Drugs on Early Embryogenesis

Affiliations

A Modified Murine Embryonic Stem Cell Test for Evaluating the Teratogenic Effects of Drugs on Early Embryogenesis

Ruoxing Yu et al. PLoS One. .

Abstract

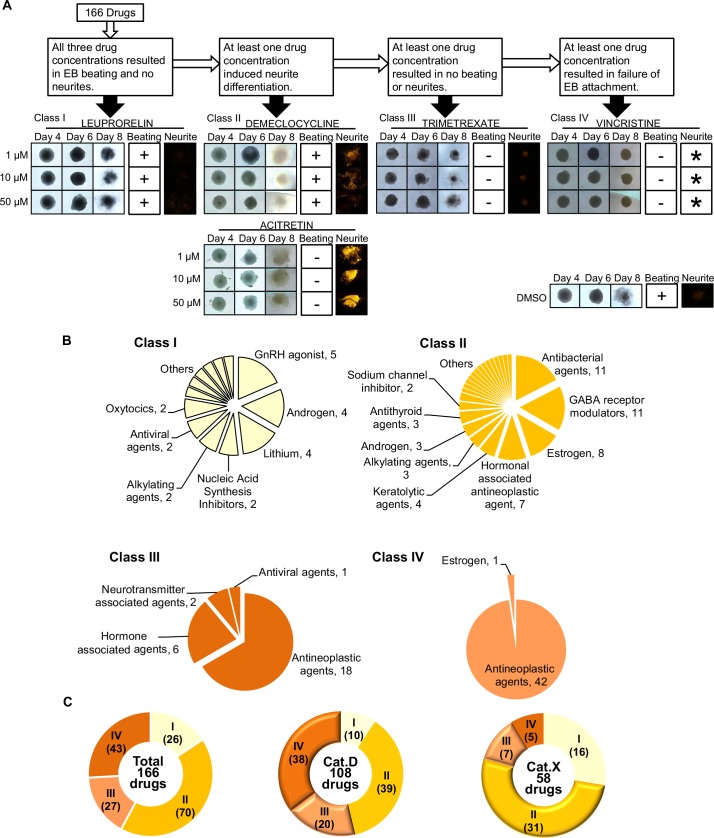
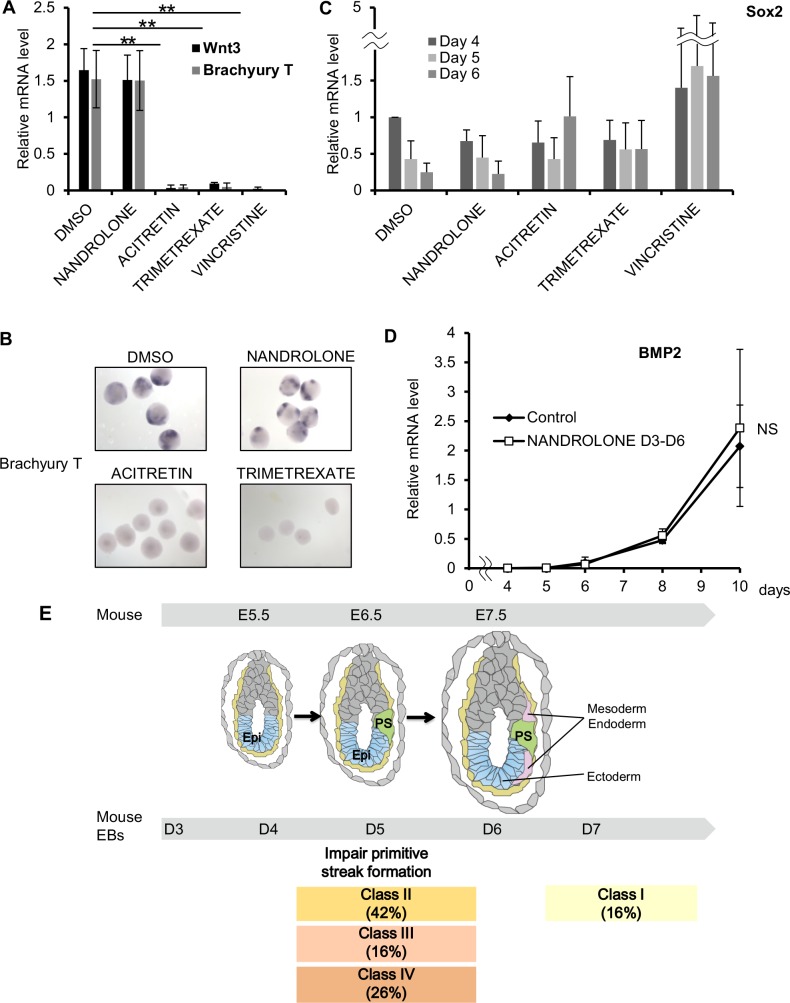
Mammalian fetal development is easily disrupted by exogenous agents, making it essential to test new drug candidates for embryotoxicity and teratogenicity. To standardize the testing of drugs that might be used to treat pregnant women, the U.S. Food and Drug Administration (FDA) formulated special grade categories, labeled A, B, C, D and X, that define the level of risk associated with the use of a specific drug during pregnancy. Drugs in categories (Cat.) D and X are those with embryotoxic and/or teratogenic effects on humans and animals. However, which stages of pregnancy are affected by these agents and their molecular mechanisms are unknown. We describe here an embryonic stem cell test (EST) that classifies FDA pregnancy Cat.D and Cat.X drugs into 4 classes based on their differing effects on primitive streak formation. We show that ~84% of Cat.D and Cat.X drugs target this period of embryogenesis. Our results demonstrate that our modified EST can identify how a drug affects early embryogenesis, when it acts, and its molecular mechanism. Our test may thus be a useful addition to the drug safety testing armamentarium.


Conflict of interest statement

Competing Interests: The authors have declared that no competing interests exist.

Figures

Fig 1
Fig 1. Analysis of developmental marker expression during EB culture.
(A) Quantitative RT-PCR determination of relative mRNA levels of the primitive streak marker Brachyury T, mesoderm marker BMP2, endoderm marker GATA6, cardiomyogenesis marker MHC, and hepatogenesis marker AFP in untreated EBs cultured for the indicated times. Data are expressed relative to GAPDH expression and are the mean ± SEM (>30 EBs/group). (B) Relative mRNA levels for the indicated genes in EBs that were treated with DMSO or SB203580 on days 3–6 and cultured for the indicated times. Sox2, ectoderm marker; Nestin, Sox1 and Map2, neuroectoderm markers. Data were analyzed as for Fig 1A and are representative of 3 independent experiments.
Fig 2
Fig 2. Classification of FDA pregnancy category D and X drugs into four classes of potential teratogens.
(A) Scheme illustrating the growth and phenotypes of representative EBs treated with the indicated class-representative drugs for the indicated times of EB development. “Beating”, cardiomyocytes were present in the EB. “Neurite”, neuronal differentiation was observed. EBs treated with Class I drugs displayed beating and no neurites. Class II drug-treated EBs showed neurites with or without foci of beating cardiomyocytes. Class III drug-treated EBs showed neither beating nor neurites but the EBs survived. Class IV drugs resulted in dead EBs. -, EBs attached to the plate but no beating observed. *, data could not be obtained because dead EBs did not attach to the plate. Images of DMSO-treated control EBs at the same stages are also shown. (B) Pie charts of distribution of the indicated drug types among Classes I–IV. (C) Pie charts of numbers of total, Cat.D and Cat.X drugs in Classes I–IV.
Fig 3
Fig 3. Effects of drug classes on EB gene expression patterns.
(A-C) EBs were treated with the indicated class-representative drugs for days 3–6 of EB culture (>30 EB cultures/group). Samples were collected on days 4–6. DMSO, control; Nandrolone, Class I; acitretin, Class II; trimetrexate, Class III; vincristine, Class IV; SB203580, p38MAPK inhibitor. (A) Quantitative RT-PCR analysis of Wnt3 mRNA on day 6 determined as for Fig 1A. **, P<0.01. (B) In situ hybridization to detect Brachyury T on day 6 in EB cultures treated as indicated for days 3–6. Results are representative of 3 independent experiments (15 EBs/group). (C) Quantitative RT-PCR analysis of the indicated mRNAs on the indicated days determined as for Fig 1B. (D) Quantitative RT-PCR analysis of Bmp2 mRNA in EB cultures that were treated with DMSO (control) or nandrolone on days 3–6. Data were analyzed as for Fig 1A. NS, not significant. (E) Top: Illustration of mouse embryonic and germ layer development at the indicated embryonic days (E). Epi, epiblast; PS, primitive streak. Bottom: Illustration of days (D) of mouse EB culture indicating the percentage of each drug class acting at a particular stage of culture.
Fig 4
Fig 4. In vivo effects of retinoic acid on early mouse embryogenesis.
(A) Scheme illustrating the experimental timeline during which pregnant mice received intravenous injection of 25 mg/kg RA at E5.5, E6.5, E7.5, E8.5 or E9.5. Mice were sacrificed on E10.5, E13.5 or E14.5 and macroscopic effects on uteri and embryo development were determined. (B) Representative images of morphological changes observed in embryos in the uteri of mice that were treated with RA (+) or not (-) at the indicated stages and examined at E10.5. ND, not detected. (C) Representative images of morphological changes observed in embryos in the uteri of mice that were treated with RA at E8.5 and examined at E13.5, or treated at E9.5 and examined at E14.5.
Fig 5
Fig 5. Teratogenicity of benzodiazepines.
(A) Quantitative RT-PCR determination of mRNA levels of the indicated genes in EB cultures that were treated for days 3–6 with DMSO (control) or the indicated drugs (>30 EBs/group) and evaluated on day 6. Wnt3 and Brachyury T, primitive streak markers; Sox2, ectoderm marker; BMP2, mesoderm marker; GATA6, endoderm marker; Nestin, neuroectoderm marker. Data were analyzed as for Fig 1A. *, P<0.05. (B) RT-PCR analysis of expression of the indicated GABA receptor subunits in untreated EBs on the indicated days of culture. Data are representative of 3 independent experiments (>30 EBs/group). (C) In situ hybridization to detect Brachyury T and Sox2 in EBs on day 6 after GABA or alprazolam treatment at the indicated concentrations (15 EBs/group). (D) In situ hybridization to detect Brachyury T and Sox2 in EBs that were treated for 6 days with alprazolam and/or GABA as indicated (20 EBs/group). (E) A proposed model of how BZ may affect primitive streak formation. Treatment with GABA or BZ alone induces only weak signals that cannot inhibit primitive streak formation. However, a combination of BZ plus GABA works synergistically and may induce a strong signal that suppresses primitive streak formation, impairing embryogenesis.

References

    1. Doering PL, Boothby LA, Cheok M. Review of pregnancy labeling of prescription drugs: Is the current system adequate to inform of risks? Am J Obstet Gynecol. 2002;187: 333–339. - PubMed
    1. Law R, Bozzo P, Koren G, Einarson A. FDA pregnancy risk categories and the CPS: Do they help or are they a hindrance? Can Fam Physician. 2010;56(3): 239–241. - PMC - PubMed
    1. Feibus KB. FDA’s proposed rule for pregnancy and lactation labeling: improving maternal child health through well-informed medicine use. J Med Toxicol. 2008;4: 284–288. - PMC - PubMed
    1. Bain PA, Marcus DA. Effective Migraine Treatment in Pregnant and Lactating Women: A Practical Guide. Totowa, NJ: Humana Press; 2009.
    1. Uhl K, Kennedy DL, Kweder SL. Risk management strategies in the Physicians’ Desk Reference product labels for pregnancy category X drugs. Drug Saf. 2002;25: 885–892. - PubMed

Publication types