. 2015 Dec 15;43(6):1186-98.
doi: 10.1016/j.immuni.2015.11.012.

Systems Analysis of Immunity to Influenza Vaccination across Multiple Years and in Diverse Populations Reveals Shared Molecular Signatures

Affiliations

Systems Analysis of Immunity to Influenza Vaccination across Multiple Years and in Diverse Populations Reveals Shared Molecular Signatures

Helder I Nakaya et al. Immunity. .

Abstract

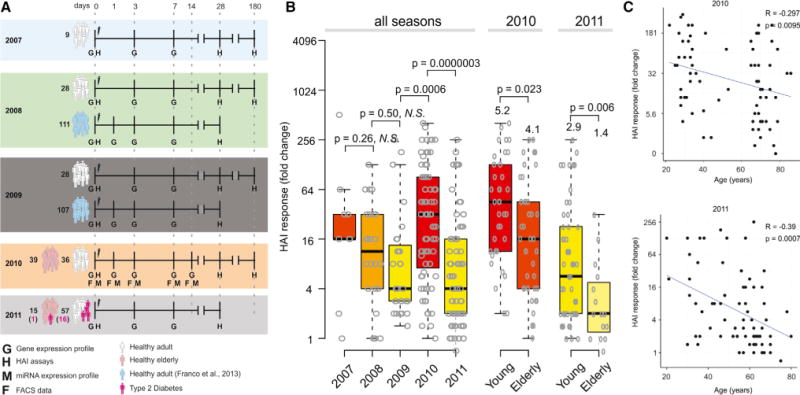
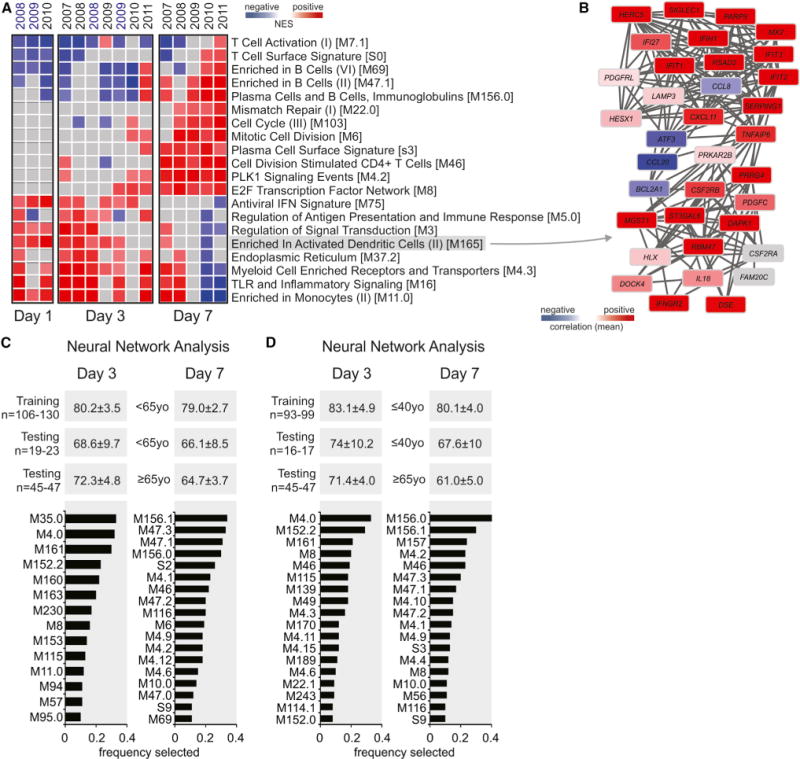
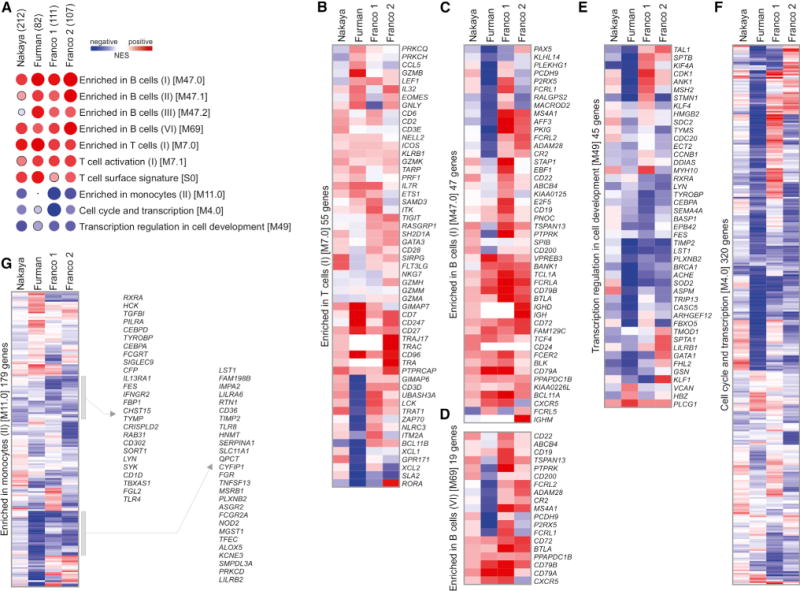
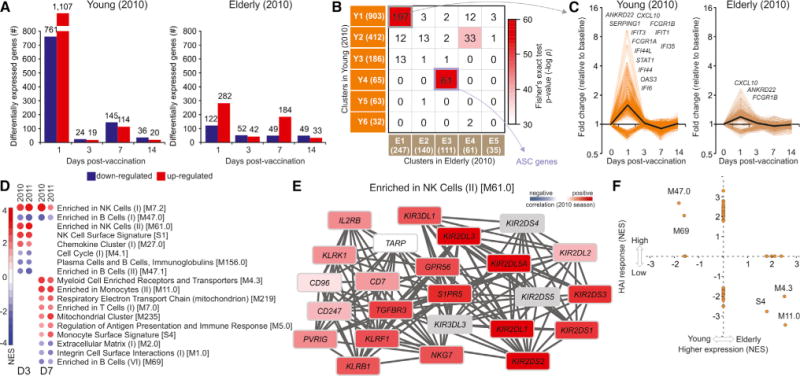
Systems approaches have been used to describe molecular signatures driving immunity to influenza vaccination in humans. Whether such signatures are similar across multiple seasons and in diverse populations is unknown. We applied systems approaches to study immune responses in young, elderly, and diabetic subjects vaccinated with the seasonal influenza vaccine across five consecutive seasons. Signatures of innate immunity and plasmablasts correlated with and predicted influenza antibody titers at 1 month after vaccination with >80% accuracy across multiple seasons but were not associated with the longevity of the response. Baseline signatures of lymphocyte and monocyte inflammation were positively and negatively correlated, respectively, with antibody responses at 1 month. Finally, integrative analysis of microRNAs and transcriptomic profiling revealed potential regulators of vaccine immunity. These results identify shared vaccine-induced signatures across multiple seasons and in diverse populations and might help guide the development of next-generation vaccines that provide persistent immunity against influenza.


Figures

Figure 1
Figure 1. Experimental Approach and Humoral Immunity to Influenza Vaccination in Young and Elderly
(A) Experimental approach used to study five consecutive influenza vaccination seasons. Microarray experiments and HAI assays were used to obtain the gene expression profiles and antibody responses of 413 TIV vaccinees. Flow cytometry and miRNA expression data were obtained for vaccinees from 2010 season. For 2008 and 2009 seasons, publicly available data (Franco et al., 2013) were included. (B) HAI responses by season. The maximum HAI response (highest day 28-day 0 fold-induction among all three strains) is shown for all 212 subjects separated by flu season, along with box plots indicating the first and third quartiles and median. For 2010 and 2011, subjects are also separated into young (<65 years old) and elderly (65 or older). p values represent results of independent two-sample t test between responses of young and elderly. (C) Correlation of HAI responses with age in the 2010 season and 2011 season. R and p represent the Pearson correlation coefficient and associated p value, respectively. See also Figure S1.
Figure 2
Figure 2. Signatures Associated with the Antibody Response Induced by TIV
(A) Heat map of blood transcription modules (BTMs, rows) and TIV seasons (columns) whose activity at days 1, 3, or 7 after vaccination is associated with HAI response at day 28 after vaccination. Gene set enrichment analysis (GSEA, nominal p < 0.05; 1,000 permutations) was used to identify positive (red), negative (blue), or no (gray) enrichment of BTMs (gene sets) within pre-ranked gene lists, where genes were ranked according to their correlation between expression and HAI response. Seasons labeled in blue are from Franco et al. (2013) dataset. Modules shown are those consistently enriched in at least 70% of seasons on a given day. Abbreviation is as follows: NES, normalized enrichment score. (B) Genes in BTM M165; each “edge” (gray line) represents a coexpression relationship, as described in Li et al. (2014); colors represent the mean correlation for seven TIV seasons between baseline-normalized gene expression at day 3 and HAI response at day 28 after vaccination. (C and D) Identification of BTMs that predict antibody responses via neural network nalysis. Single sample GSEA (Barbie et al., 2009) enrichment scores were generated for each BTM on day 3 and day 7 after vaccination in 85% of the young subjects (training set) and used as inputs to an artificial neural network classifier to predict the day 28 antibody responses, in the remaining 15% of the young (young test set) or the elderly (elderly test set) subjects (see Supplemental Experimental Procedures for details). The mean accuracies and standard deviations out of 100 randomized trials are shown, along with the frequency with which each module was selected by the algorithm as an input to the classifier. In (C) “young” is <65 years and “elderly” >65 years and in (D) “young” is <40 years and “elderly >65 years. See also Figures S2–S4.
Figure 3
Figure 3. Baseline Signatures Are Associated with the Antibody Response
(A) Heat map of BTMs (rows) and TIV studies (columns) whose activity before vaccination is associated with HAI response at day 28 after vaccination. GSEA (nominal p < 0.05; 1,000 permutations) was used to identify positive (red) or negative (blue) enrichment of BTMs (gene sets) within pre-ranked gene lists, where genes were ranked according to their correlation between expression and HAI response. Circle size is proportional to the normalized enrichment score (NES). Numbers in parentheses next to each study represent number of subjects in the study. Modules shown are those consistently enriched in at least three out of four studies. (B–G) Heat maps of genes within BTMs from (A); colors represent the mean correlation in each study between baseline gene expression and HAI response at day 28 after vaccination. See also Figure S5.
Figure 4
Figure 4. Molecular Signatures Induced by Vaccination with TIV in Young Adults and in Elderly
(A) Number of genes differentially expressed (log2 fold-change > 0.2 and t test p value < 0.01) in young (<65 years) (left) and elderly (≥65 years) (right) vaccinees on days 1, 3, 7, and 14 after vaccination (2010 season). (B) Heat map of highly correlated gene modules within the differentially expressed genes in (A) for young (rows, modules Y1–Y6) and elderly (columns, modules E1–E5), generated by weighted correlation network analysis (Langfelder and Horvath, 2008). The number of genes in each module is shown in parentheses and the number of genes in common between two modules is shown inside the squares. Colors represent the Fisher’s exact test p value of the overlap between clusters. The 61 genes in common between Y4 and E3 are associated with ASCs. (C) Temporal expression patterns of 197 interferon-related genes in common between modules Y1 and E1 from (B). Black line represents the mean fold change of all genes. (D) BTMs (rows) whose activity at days 3 or 7 after vaccination (columns) is associated with the age of vaccinees from 2010 and 2011 seasons. GSEA (nominal p < 0.05; 1,000 permutations) was used to identify positive (red) or negative (blue) enrichment of BTMs (gene sets) within pre-ranked gene lists, where genes were ranked according to their correlation between expression and increasing age. The intensity of the color and the size of the circles represent the normalized enrichment score (NES) of GSEA. In this analysis we used age as a quantitative variable, rather than arbitrarily splitting the cohorts young versus elderly. Modules shown are those consistently enriched in both seasons. (E) Genes in BTM M61.0; each “edge” (gray line) represents a coexpression relationship, as described in Li et al. (2014); colors represent the correlation for 2010 season between baseline-normalized gene expression at day 3 after vaccination and the age of vaccinees. (F) BTMs whose activity at day 7 after vaccination is correlated with the age of vaccinees (x axis) and/or is correlated with HAI response (y axis) in both 2010 and 2011 seasons. Values represent the mean of the NES obtained independently for each season. NES receives a value of zero if the BTM is not significantly associated with age or HAI response (nominal p < 0.05; 1,000 permutations) in either season. See also Figures S6 and S7.
Figure 5
Figure 5. Flow Cytometry Analysis of NK Cells in Young and Elderly after TIV Vaccination
(A) Changes in total NK cell population after vaccination represented as percent within all PBMCs for young and elderly. Mean ± SEM. (B) Blood NK cells were defined within the CD3CD4CD19CD14 PBMCs. Dot blot represents three distinct NK cell populations defined by CD56 and CD16 markers: CD56++ NK, CD56++CD16+ NK, and CD56dimCD16++ NK. (C) Kinetics of magnitudes of CD56++ NK, CD56++CD16+ NK, and CD56dimCD16++ NK cell subsets in young (left) and elderly (right) after vaccination. Mean ± SEM. Areas under curve (AUC) in (A) and (C) were calculated to compare magnitudes of total NK cells and NK cells subsets between young and elderly cohorts throughout the study duration (days 0–14) and compared by t test. Changes of each of the NK subset on the indicated time points after vaccination were compared to the day 0 (baseline) time point by t test. (D) Activation of each of the NK cell subsets were assessed by CD69 staining and compared with day 0 (baseline) by t test. Data are represented as the geometric mean fluorescence intensity (MFI) for young (left) and elderly (right) at each time point, mean ± SEM. *p < 0.05, **p < 0.01, ***p < 0.001, ****p < 0.0001.
Figure 6
Figure 6. Signatures Associated with the Persistence of TIV-Induced Antibody Response
(A) HAI response (fold change of HAI titer relative to baseline) through 180 days for temporary (n = 28) and persistent (n = 34) responders. Temporary responders met the FDA criteria for seroconversion (minimum 1:40 titer and 4-fold increase after vaccination) on day 28 but not on day 180, whereas persistent responders met the criteria on both days. (B) Comparison between day 28 and day 180 HAI responses. Each symbol represents a single vaccinee and the color represents the season that they were vaccinated (n = 62). Black lines represent the regression line (Pearson) for all vaccinees combined. Day 180/day 28 residual is computed as the (vertical) distance from each sample to the regression line. (C) Comparison between “S3 Plasma” BTM activity and the HAI responses at day 28 after vaccination. Each symbol represents a single vaccinee and the color represents the season that they were vaccinated (n = 62). Black lines represent the regression line (Pearson) for all vaccinees combined. (D) Comparison between “S3 Plasma” BTM activity and the HAI D180/D28 residual. Each symbol represents a single vaccinee and the color represents the season that they were vaccinated (n = 62). Black lines represent the regression line (Pearson) for all vaccinees combined. (E) Genes in BTM M51.0; each “edge” (gray line) represents a coexpression relationship, as described in Li et al. (2014); colors represent the correlation between baseline-normalized gene expression at day 3 after vaccination and the D180/D28 residual. (F) BTMs (bars) whose activity at day 7 after vaccination is significantly associated with the HAI D180/D28 residual (GSEA; nominal p < 0.05; 1,000 permutations). Vaccinees from 2007 to 2010 seasons were combined. BTMs related to T cell functions (pink bars) or monocyte functions (purple bars) are shown.
Figure 7
Figure 7. MicroRNA Expression Profiling of Young and Elderly TIV Vaccinees
(A) Heat map of miRNAs (rows) up- (red) or downregulated (blue) at days 1, 3, and 7 after vaccination in young and elderly (columns); paired t test (p < 0.05); total number of differentially expressed miRNAs are shown at the bottom. (B) MicroRNAs whose expression is positively or negatively correlated with HAI response in young and elderly; Pearson correlation (p < 0.05). (C) Identification of networks potentially regulated by miRNAs. Activity of BTMs was determined by single-sample GSEA (Barbie et al., 2009) and correlated with the expression of miRNAs. TargetScan database (Garcia et al., 2011) was used to identify the potential target genes of miRNAs. (D) Heat map of BTMs (rows) whose activity at day 1 after vaccination correlated with the baseline-normalized expression of miRNAs (columns) at the same time point. Positive and negative correlations are shown in red and blue, respectively. (E) Genes in BTM M75; each gray line represents a coexpression relationship, as described in Li et al. (2014); each brown line connects a miRNA and its potential target gene; each blue line represents a negative correlation (Pearson, p < 0.15) between the expression of miRNA and the expression of the potential target gene; colors represent the mean correlation between baseline-normalized gene expression at day 1 and HAI response at day 28 after vaccination in the 2010 TIV season.

References

    1. Abbas AR, Wolslegel K, Seshasayee D, Modrusan Z, Clark HF. Deconvolution of blood microarray data identifies cellular activation patterns in systemic lupus erythematosus. PLoS ONE. 2009;4:e6098. - PMC - PubMed
    1. Almeida-Oliveira A, Smith-Carvalho M, Porto LC, Cardoso-Oliveira J, Ribeiro AdosS, Falcão RR, Abdelhay E, Bouzas LF, Thuler LCS, Ornellas MH, Diamond HR. Age-related changes in natural killer cell receptors from childhood through old age. Hum Immunol. 2011;72:319–329. - PubMed
    1. Barbie DA, Tamayo P, Boehm JS, Kim SY, Moody SE, Dunn IF, Schinzel AC, Sandy P, Meylan E, Scholl C, et al. Systematic RNA interference reveals that oncogenic KRAS-driven cancers require TBK1. Nature. 2009;462:108–112. - PMC - PubMed
    1. Béziat V, Duffy D, Quoc SN, Le Garff-Tavernier M, Decocq J, Combadière B, Debré P, Vieillard V. CD56brightCD16+ NK cells: a functional intermediate stage of NK cell differentiation. J Immunol. 2011;186:6753–6761. - PubMed
    1. Bhattacharya S, Andorf S, Gomes L, Dunn P, Schaefer H, Pontius J, Berger P, Desborough V, Smith T, Campbell J, et al. ImmPort: disseminating data to the public for the future of immunology. Immunol Res. 2014;58:234–239. - PubMed

Publication types

Associated data