. 2015 Dec;13(4):234-47.
doi: 10.1089/lrb.2015.0028.

Modeling Lymph Flow and Fluid Exchange with Blood Vessels in Lymph Nodes

Affiliations

Modeling Lymph Flow and Fluid Exchange with Blood Vessels in Lymph Nodes

Mohammad Jafarnejad et al. Lymphat Res Biol. 2015 Dec.

Abstract

Background: Lymph nodes (LNs) are positioned strategically throughout the body as critical mediators of lymph filtration and immune response. Lymph carries cytokines, antigens, and cells to the downstream LNs, and their effective delivery to the correct location within the LN directly impacts the quality and quantity of immune response. Despite the importance of this system, the flow patterns in LN have never been quantified, in part because experimental characterization is so difficult.

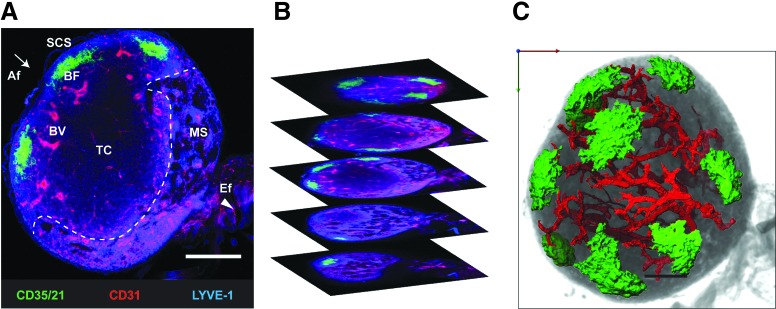
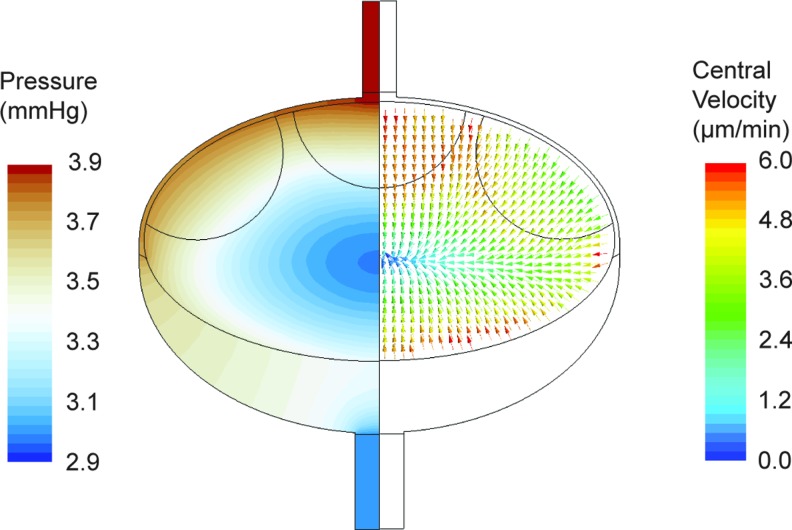
Methods and results: To achieve a more quantitative knowledge of LN flow, a computational flow model has been developed based on the mouse popliteal LN, allowing for a parameter sensitivity analysis to identify the important system characteristics. This model suggests that about 90% of the lymph takes a peripheral path via the subcapsular and medullary sinuses, while fluid perfusing deeper into the paracortex is sequestered by parenchymal blood vessels. Fluid absorption by these blood vessels under baseline conditions was driven mainly by oncotic pressure differences between lymph and blood, although the magnitude of fluid transfer is highly dependent on blood vessel surface area. We also predict that the hydraulic conductivity of the medulla, a parameter that has never been experimentally measured, should be at least three orders of magnitude larger than that of the paracortex to ensure physiologic pressures across the node.

Conclusions: These results suggest that structural changes in the LN microenvironment, as well as changes in inflow/outflow conditions, dramatically alter the distribution of lymph, cytokines, antigens, and cells within the LN, with great potential for modulating immune response.


Figures

<b>FIG. 1.</b>
FIG. 1.
Geometry of the lymph node. (A) A cleared popliteal lymph node was stained for B cells (CD35/21, green), blood endothelial cells (CD31, red), and lymphatic endothelial cells (LYVE-1, blue), and was imaged using confocal microscopy. Lymph enters the node (arrow) through afferent lymphatic vessel(s) (Af). It then moves to subcapsular sinus (SCS), which can then go to either B cell follicles (BF) and T cell cortex (TC) through central path, or directly to medullary sinuses (MS) through peripheral path. Lymph will leave the node (arrow head) through efferent vessel(s) (Ef), although some lymph fluid will be absorbed by blood vessels (BV). Scale bar is 200 μm. (B) Z-stack confocal images were acquired for blood vessel geometry reconstruction. (C) Blood vessels (CD31+ cells) of the node are segmented using a threshold/paint technique. The surface area and the total volume of the node are extracted from the images and are used to calculate surface area density of the blood vessels. The B cell follicles are segmented to demonstrate the relative location of the major blood vessels to them. Scale bar is 200 μm. A color version of this figure is available in the online article at www.liebertpub.com/lrb.
<b>FIG. 2.</b>
FIG. 2.
Idealized geometry and the flow paths in the lymph node. (A) Schematic of LN shows how the lymph can pass through the node from the afferent to the efferent lymphatics, as well as exchange fluid with the blood vessels in the LN. (B) An idealized geometry made for modeling purposes. Although a single afferent vessel is pictured here, there are many LNs in mice and most LNs in larger animals that have several afferent vessels. (C) A flowchart of the lymph movement through regions of the node shows the central path (flow from SCS to BF and TC) and peripheral path (flow from SCS to MS) for the lymph movement through the node. A color version of this figure is available in the online article at www.liebertpub.com/lrb.
<b>FIG. 3.</b>
FIG. 3.
Peripheral velocity contours and velocity profiles along the SCS. (A) Velocity contour of peripheral path shows that lymph flows from SCS directly to the medulla with velocities that are approximately three orders of magnitude higher than the velocities in the central path. The afferent vessel is located at the top and the efferent vessel at the bottom. Vectors a, b, c, and d show locations along SCS that the lymph velocity profile in the SCS is plotted. (B) Velocity profiles along the SCS demonstrate that the peak velocity of the lymph in the SCS decreases as lymph travels further from the afferent vessels. This is mainly a result of the surface area in front of the flow increasing with distance along the approximately spherical surface. The velocity profiles correspond to the locations in A and are plotted from the SCS floor to the SCS ceiling. A color version of this figure is available in the online article at www.liebertpub.com/lrb.
<b>FIG. 4.</b>
FIG. 4.
Pressure contours and lymph velocities. The left half of the lymph node is color coded for lymph pressure and indicates low pressures at the center of the node. The right half shows the velocity vectors in the central region that are color coded with the magnitude of the velocity. Fluid moves towards the low pressure region at the center with velocities that are three orders of magnitude smaller than the peripheral region. A color version of this figure is available in the online article at www.liebertpub.com/lrb.
<b>FIG. 5.</b>
FIG. 5.
Shear stress contours in SCS and differences between shears on the SCS ceiling and floor. (A) Shear stress contours on the SCS ceiling demonstrate that shear decreases as lymph travels further away from the afferent vessel. The contour is produced by looking down toward the SCS ceiling from afferent vessel (top view of the LN). (B) Shear stress versus distance from the afferent vessel (along the black arrow in panel A) shows the dependency of the shear stress profile on the afferent flow rate. Additionally, shear stress on the SCS ceiling (solid lines) are on average 13% higher than the shear stress on the SCS floor (dashed lines). A color version of this figure is available in the online article at www.liebertpub.com/lrb.
<b>FIG. 6.</b>
FIG. 6.
Parameter sensitivity analysis for surface area density and hydraulic conductivity of the blood vessels. (A) Flow rates in the LN as a function of LA. Afferent vessel flow rate (dashed orange line) is kept constant. Increasing LA resulted in the increase in the amount of fluid absorbed by blood vessels (solid red line). Additionally, the flow through central path (solid green line) increased with LA. (B) Holding efferent pressure constant, increasing LA will reduce the pressure at the afferent vessel (dashed orange line) and more noticeably in the T cell area (solid pink line). A color version of this figure is available in the online article at www.liebertpub.com/lrb.
<b>FIG. 7.</b>
FIG. 7.
Parameter sensitivity analysis for hydraulic conductivity of medulla. (A) A decrease in the hydraulic conductivity of medulla (Kmedulla) results in an increase in the apparent resistance of the whole node. This parameter relates the pressure drop across an LN to the flow going through the node. (B) The central flow increases when hydraulic conductivity of the medulla decreases with respect to hydraulic conductivity of T cell cortex (Kmedulla/KT cell cortex). As the Kmedulla decreases, more of the lymph passes through the central regions of the node. (C) Under the same condition, fluid transported to blood vessels also increases with the decrease in Kmedulla. This study suggest structural changes in the medulla can modulate the transport of signaling molecules towards the blood vessels. (D) The average pressure in the T cell cortex is an output that can be used to determine the physiologic range of Kmedulla. This suggests that Kmedulla should be about three orders of magnitude higher than KT cell cortex to ensure the pressure in the T cell cortex of the node is physiologic. A color version of this figure is available in the online article at www.liebertpub.com/lrb.
<b>FIG. 8.</b>
FIG. 8.
Parameter sensitivity analysis for average blood vessel pressure (PBV). (A) Blood vessel flow shown for different LA values decreases almost linearly with increasing PBV. Additionally at around PBV = 10.5 mmHg, the flow that was from lymphatic system to blood vessels changes direction to flow from blood vessels to lymphatics. (B) The average pressure in the T cell area varies linearly with PBV, with a slope that is dependent on surface area. A color version of this figure is available in the online article at www.liebertpub.com/lrb.
<b>FIG. 9.</b>
FIG. 9.
Paramter sensitivity analysis for efferent pressure (PEf). (A) The exchange flow to blood vessels increases with the efferent pressure. The higher the LA value, the more fluid is transported to the blood vessels. (B) The increase in the overall pressure in the lymph node is the main reason for the increase in the flow to blood vessels. A color version of this figure is available in the online article at www.liebertpub.com/lrb.
<b>FIG. 10.</b>
FIG. 10.
Comparison to experimental data from Adair and Guyton., (A) The data from the cannulation of the popliteal node of six grayhounds perfused with constant afferent flow rate show that increasing blood pressure decreases fluid flow from lymph to blood, and if high enough, it can change the flow direction. Each symbol shows a single experiment and the color coded lines are linear fits to the data. The exchange flow to the blood vessels is shown in red, while afferent lymph flow rate is plotted in orange. The trend of the change and the linearity of the response supports the results of our model showing the flow to blood vessel for the mouse popliteal LN (Fig. 8A). (B) Using a similar method, Adair and Guyton showed that an increase in the efferent pressure will increase the flow to blood vessels. This also agrees well with the model results in terms of trend and linear dependence of exchange flow on PEf. A color version of this figure is available in the online article at www.liebertpub.com/lrb.

References

    1. Zawieja DC. Contractile physiology of lymphatics. Lymphat Res Biol 2009;7:87–96 - PMC - PubMed
    1. Hudack S, McMaster PD. I. The permeability of the wall of the lymphatic capillary. J Exp Med 1932;56:223–238 - PMC - PubMed
    1. Baluk P, Fuxe J, Hashizume H, et al. . Functionally specialized junctions between endothelial cells of lymphatic vessels. J Exp Med 2007;204:2349–2362 - PMC - PubMed
    1. Gashev AA, Davis MJ, Delp MD, Zawieja DC. Regional variations of contractile activity in isolated rat lymphatics. Microcirculation 2004;11:477–492 - PubMed
    1. Koller A, Mizuno R, Kaley G. Flow reduces the amplitude and increases the frequency of lymphatic vasomotion: Role of endothelial prostanoids. Am J Physiol 1999; 27:R1683–1689 - PubMed

Publication types