Comparative Study
. 2016 Jan 26;7(4):4746-59.
doi: 10.18632/oncotarget.6621.

Dysregulated miR-671-5p / CDR1-AS / CDR1 / VSNL1 axis is involved in glioblastoma multiforme

Affiliations
Comparative Study

Dysregulated miR-671-5p / CDR1-AS / CDR1 / VSNL1 axis is involved in glioblastoma multiforme

Davide Barbagallo et al. Oncotarget. .

Abstract

MiR-671-5p is encoded by a gene localized at 7q36.1, a region amplified in human glioblastoma multiforme (GBM), the most malignant brain cancer. To investigate whether expression of miR-671-5p were altered in GBM, we analyzed biopsies from a cohort of forty-five GBM patients and from five GBM cell lines. Our data show significant overexpression of miR-671-5p in both biopsies and cell lines. By exploiting specific miRNA mimics and inhibitors, we demonstrated that miR-671-5p overexpression significantly increases migration and to a less extent proliferation rates of GBM cells. Through a combined in silico and in vitro approach, we identified CDR1-AS, CDR1, VSNL1 as downstream miR-671-5p targets in GBM. Expression of these genes significantly decreased both in GBM biopsies and cell lines and negatively correlated with that of miR-671-5p. Based on our data, we propose that the axis miR-671-5p / CDR1-AS / CDR1 / VSNL1 is functionally altered in GBM cells and is involved in the modification of their biopathological profile.

Keywords: cell networks; circular RNAs (circRNAs); glioblastoma multiforme (GBM); microRNAs (miRNAs); non coding RNAs (ncRNAs).


Conflict of interest statement

CONFLICTS OF INTEREST

The authors disclose no potential conflicts of interest.

Figures

Figure 1
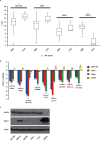
Figure 1. Expression of miR-671-5p, miR-671-3p, miR-21 and miR-7 in GBM biopsies
A. and cell lines B. Expression values are reported as box plots with whiskers from minimum to maximum to represent −1*ΔCt, both in GBM biopsies as in controls (A), and as mean of fold change (FC) ± Standard Deviation versus normal brain (B). miR-99a and miR-92a were used as reference genes in experiments on biopsies and cell lines, respectively. *p-value < 0.05, **p-value < 0.01, ***p-value < 0.001, Student's t-test (n = 3).
Figure 2
Figure 2. CDR1-AS, CDR1, VSNL1 and CHPF2 expression in GBM biopsies
A. and cell lines B. Expression values are reported as box plots with whiskers from minimum to maximum to represent −1*ΔCt, both in GBM biopsies and controls (A), and as mean of fold change (FC) ± Standard Deviation versus normal brain (B). Western blot of CHPF2 and VSNL1 in GBM cell lines and normal brain tissue C. *p-value < 0.05, **p-value < 0.01, ***p-value < 0.001, Student's t-test (n = 3).
Figure 3
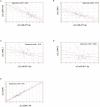
Figure 3. Scatter plots showing correlation between expression of miR-671-5p and its targets
Spearman's nonparametric rank correlation coefficients were calculated using ΔCt values of miR-671-5p and its targets CDR1-AS A. CDR1 B. VSNL1 C. CHPF2 D. and ΔCt values of CDR1-AS and CDR1 E. See text for details.
Figure 4
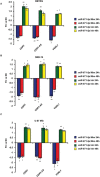
Figure 4. Expression of CDR1-AS, CDR1, VSNL1 in DBTRG, SNB-19, U-87 MG cell lines after transfection with miR-671-5p mimics (miR-671-5p Mim) or inhibitors (miR-671-5p Inh)
Expression values are reported as mean of fold change (FC) ± Standard Deviation versus scramble molecules (NC) - transfected cells. *p-value < 0.05; **p-value < 0.01, Student's t-test (n = 3).
Figure 5
Figure 5. Involvement of miR-671-5p in DBTRG, SNB-19, U-87 MG migration
MiR-671-5p mimics stimulate cell migration with respect to scramble molecules (NC Mim) - transfected DBTRG A. SNB-19 B. U-87 MG C. cells in a wound-healing assay. Data are represented as mean percentage ± Standard Deviation of open wound area of three independent biological replicates, 24 h after scratch. Magnification: × 8. Results are representative of at least three randomly selected areas, assayed for each well. *p-value < 0.05; **p-value < 0.01, Student's t-test.
Figure 6
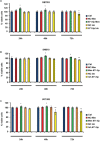
Figure 6. MTT assay in GBM cell lines DBTRG
(A), SNB-19 (B), U-87 MG (C). Data are reported as percentages of viable cells, relative to controls. Experiments were performed as six biological replicates. *P < 0.05, **P < 0.01, Student's t-test. Ctrl (not transfected cells); NC Mim (Cells transfected with scramble molecules of miRNA mimics); 671–5p Mim (Cells transfected with miR-671-5p mimics); NC Inh (Cells transfected with scramble molecules of miRNA inhibitors); 671–5p Inh (Cells transfected with miR-671-5p inhibitors).
Figure 7
Figure 7. Network of CDR1 and VSNL1 (candidate nodes) plus their first neighbor interactants
See legend within the figure and text for further details.

References

    1. Louis DN, Ohgaki H, Wiestler OD, Cavenee WK, Burger PC, Jouvet A, Scheithauer BW, Kleihues P. The 2007 WHO classification of tumours of the central nervous system. Acta Neuropathol. 2007;114:97–109. - PMC - PubMed
    1. Dolecek TA, Propp JM, Stroup NE, Kruchko C. CBTRUS statistical report: primary brain and central nervous system tumors diagnosed in the United States in 2005–2009. Neuro-Oncol. 2012;14:v1–49. - PMC - PubMed
    1. Ostrom QT, Bauchet L, Davis FG, Deltour I, Fisher JL, Langer CE, Pekmezci M, Schwartzbaum JA, Turner MC, Walsh KM, Wrensch MR, Barnholtz-Sloan JS. The epidemiology of glioma in adults: a “state of the science” review. Neuro-Oncol. 2014;16:896–913. - PMC - PubMed
    1. Sturm D, Bender S, Jones DT, Lichter P, Grill J, Becher O, Hawkins C, Majewski J, Jones C, Costello JF, Iavarone A, Aldape K, Brennan CW, et al. Paediatric and adult glioblastoma: multiform (epi)genomic culprits emerge. Nat Rev Cancer. 2014;14:92–107. - PMC - PubMed
    1. Patel AP, Tirosh I, Trombetta JJ, Shalek AK, Gillespie SM, Wakimoto H, Cahill DP, Nahed BV, Curry WT, Martuza RL, Louis DN, Rozenblatt-Rosen O, Suvà ML, et al. Single-cell RNA-seq highlights intratumoral heterogeneity in primary glioblastoma. Science. 2014;344:1396–1401. - PMC - PubMed

Publication types

MeSH terms