. 2015 Dec 18;11(12):e1004609.
doi: 10.1371/journal.pcbi.1004609. eCollection 2015 Dec.

Computational Models Describing Possible Mechanisms for Generation of Excessive Beta Oscillations in Parkinson's Disease

Affiliations

Computational Models Describing Possible Mechanisms for Generation of Excessive Beta Oscillations in Parkinson's Disease

Alex Pavlides et al. PLoS Comput Biol. .

Abstract

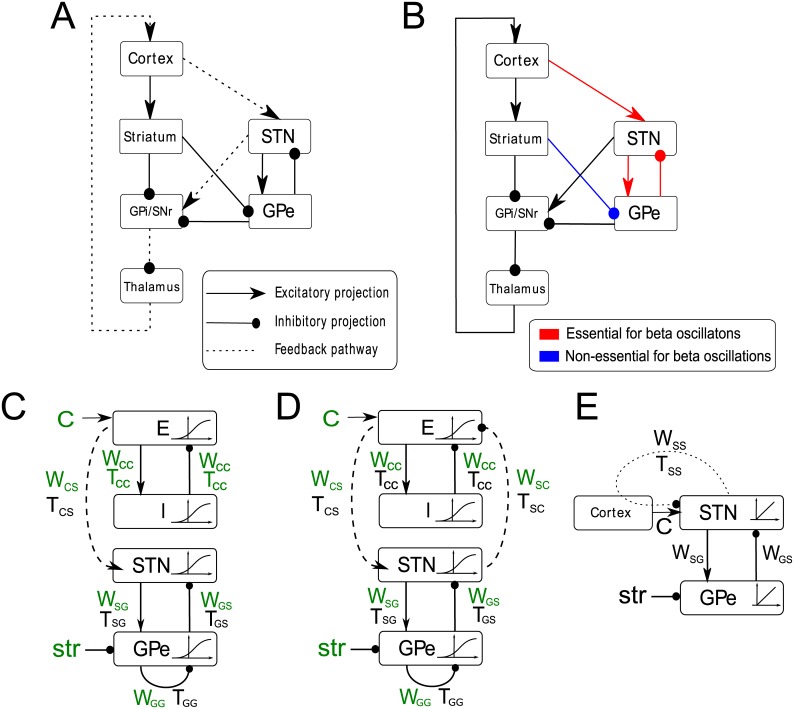
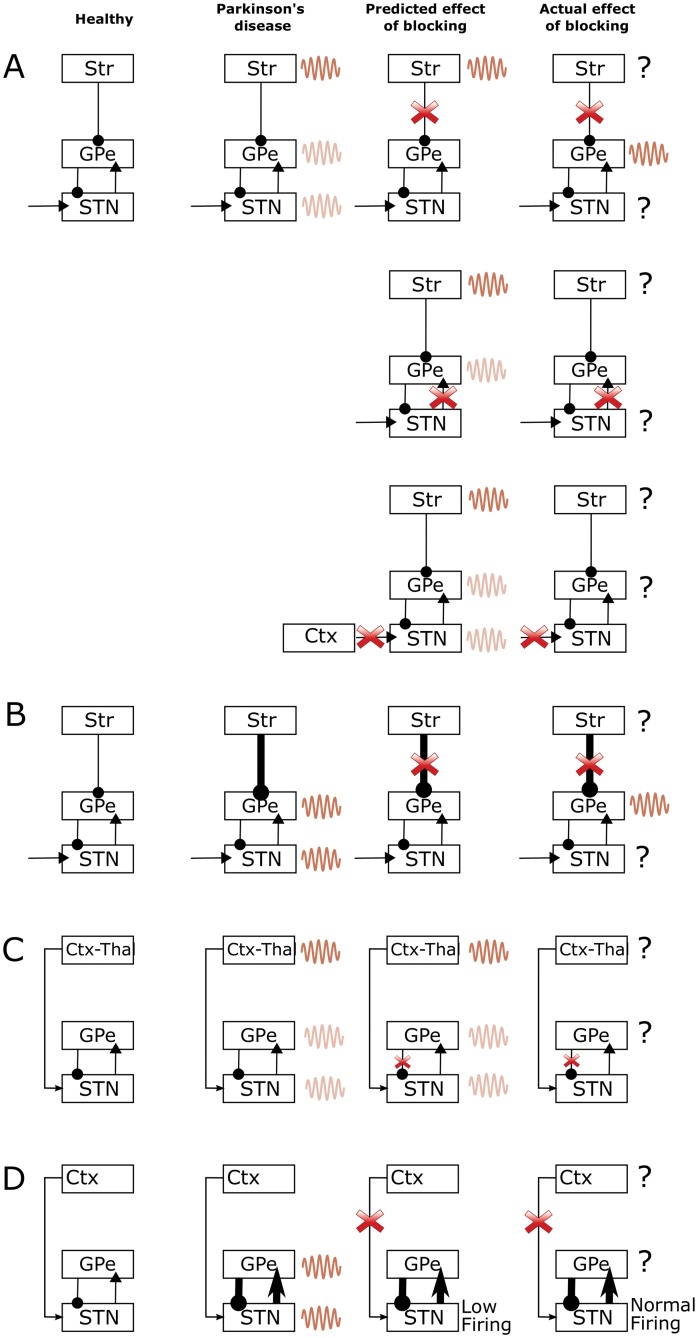
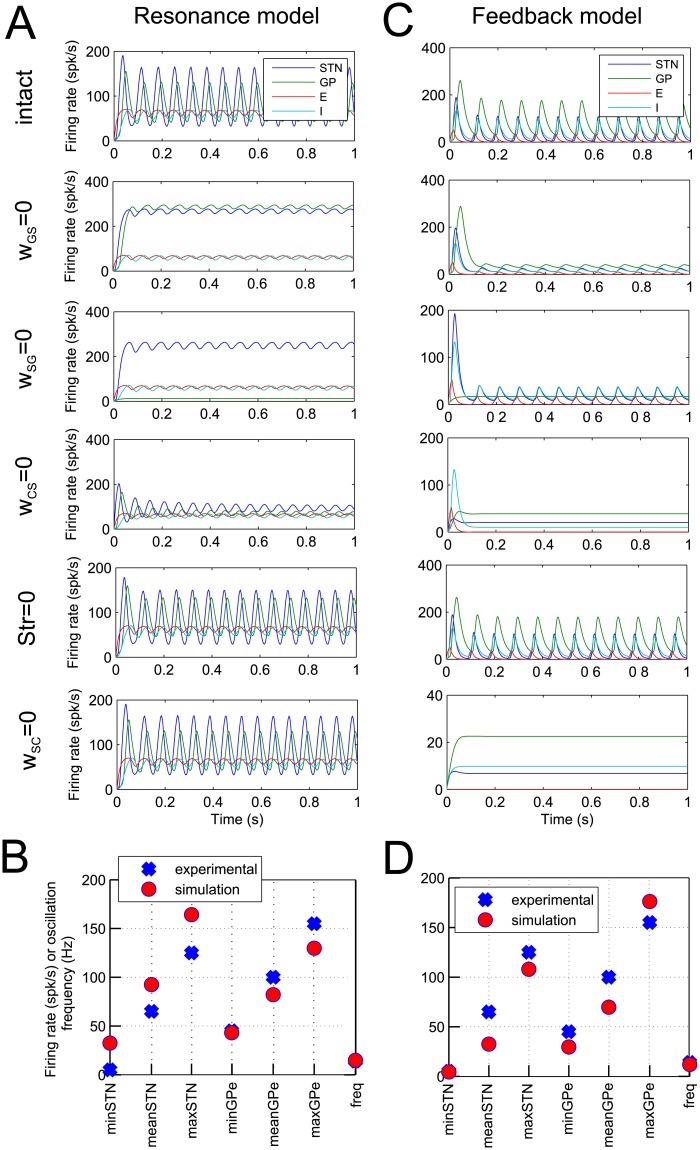
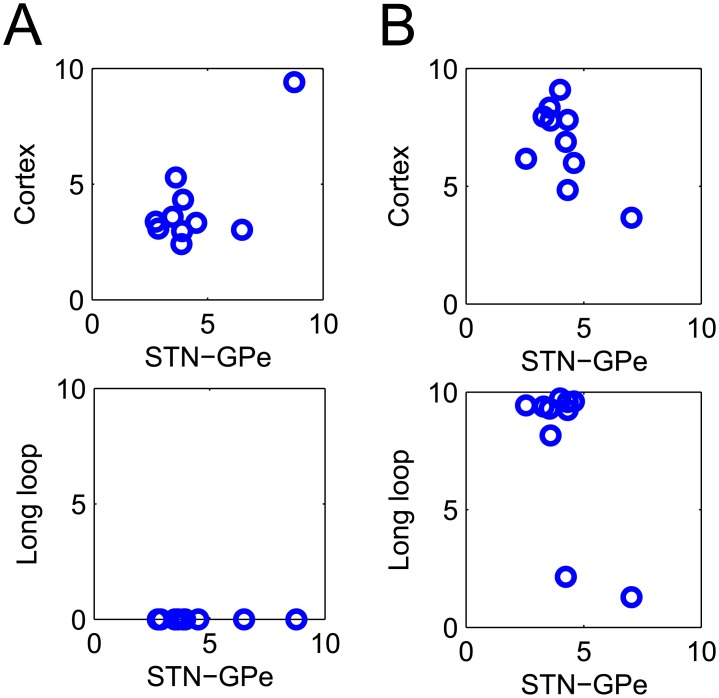
In Parkinson's disease, an increase in beta oscillations within the basal ganglia nuclei has been shown to be associated with difficulty in movement initiation. An important role in the generation of these oscillations is thought to be played by the motor cortex and by a network composed of the subthalamic nucleus (STN) and the external segment of globus pallidus (GPe). Several alternative models have been proposed to describe the mechanisms for generation of the Parkinsonian beta oscillations. However, a recent experimental study of Tachibana and colleagues yielded results which are challenging for all published computational models of beta generation. That study investigated how the presence of beta oscillations in a primate model of Parkinson's disease is affected by blocking different connections of the STN-GPe circuit. Due to a large number of experimental conditions, the study provides strong constraints that any mechanistic model of beta generation should satisfy. In this paper we present two models consistent with the data of Tachibana et al. The first model assumes that Parkinsonian beta oscillation are generated in the cortex and the STN-GPe circuits resonates at this frequency. The second model additionally assumes that the feedback from STN-GPe circuit to cortex is important for maintaining the oscillations in the network. Predictions are made about experimental evidence that is required to differentiate between the two models, both of which are able to reproduce firing rates, oscillation frequency and effects of lesions carried out by Tachibana and colleagues. Furthermore, an analysis of the models reveals how the amplitude and frequency of the generated oscillations depend on parameters.


Conflict of interest statement

The authors have declared that no competing interests exist.

Figures

Fig 1
Fig 1. Connectivity in cortico-basal-ganglia-thalamic circuit and in the computational model.
A) Major connections of the basal ganglia. Arrows denote excitatory connections and lines ending with circles denote inhibitory connections. The pathway which denotes cortical feedback via the hyperdirect pathway is highlighted with dashed lines. B) Summary of selected results of Tachibana et al. [14], who recorded activity of STN and GPe neurons in intact monkey model of Parkinson’s disease, and after blocking various inputs to the neurons in the vicinity of the recording electrode. Red lines indicate inputs that when blocked caused suppression of beta oscillations while the blue line indicates the striatal input to the GPe that when blocked did not reduce significantly the power of beta oscillations in the activity of recorded GPe neurons. C) A resonance model which includes time delays between the excitatory and inhibitory populations of the cortex, time delays between STN and GPe populations, time delays in the inhibitory GPe-GPe connections and further time delays connecting the cortex to the STN. This model also includes sigmoid activation functions for the STN, GPe, E and I populations which describe the input-output relationships of neurons in the populations. w ij and T ij denote the strength and delay of synaptic connections between neural populations i and j, where i and j can be equal to C for cortex, S for STN or G for GPe. Parameters shown in green are being fitted to the data. D) A feedback model that is identical to the model in panel C apart from including the time delayed connection between the STN and cortex, which forms a feedback loop between STN-GPe circuit and cortex. E) A linear model with time delay only in the cortical feedback.
Fig 2
Fig 2. A graphical illustration of four alternative theories for the generation of beta oscillations in the cortical-basal ganglia circuits, the predicted effects of blockade from models and actual effects of blockade of connections reported in Tachibana et al. [14].
The first column shows the non-pathological state in healthy controls, the second column shows what the corresponding theories suggest happens in the Parkinsonian state, the third column shows the predicted effect of blockade of connection and the fourth column shows the actual effect of blocking from Tachibana et al. [14]. Note that oscillations in certain areas are not reported by Tachibana et al. [14], therefore in the fourth column this is illustrated by a question mark rather than oscillations in these regions. The dark coloured waves in the second and third column indicate the areas that generate the excessive oscillation according to a given theory, while the light coloured waves indicate the areas to which the oscillations spread. A) Model of McCarthy et al. [27] B) Model of Kumar et al. [10] C) Model of Van Albada et al. [31] and D) STN-GPe theory.
Fig 3
Fig 3. Results of simulations of the resonance model (panels A and B) and feedback model (panels C and D).
A, C) Each of the six panels shows the activity of the STN, GPe and cortical populations as a function of time. The labels to the left indicate if a row shows simulations of an intact model, or a model with particular connections blocked. In simulations in panel A the following parameters were used: w SG = 4.87, w GS = 1.33, w CS = 9.98, w SC = 8.93, w GG = 0.53, w CC = 6.17, C = 172.18, Str = 8.46, T CC = 4.65, τ E = 11.59, τ I = 13.02, B E = 17.85, B I = 9.87, M E = 75.77 and M I = 205.72. In simulations in panel C the following values were used: w SG = 2.56, w GS = 3.22, w CS = 6.60, w SC = 0.00, w GG = 0.90, w CC = 3.08, C = 277.94, Str = 40.51, T CC = 7.74, τ E = 11.69, τ I = 10.45, B E = 3.62, B I = 7.18, M E = 71.77 and M I = 276.39. B, D) The comparison between experimental and simulated statistics of the oscillations.
Fig 4
Fig 4. The top ten parameter sets found by the optimisation procedure.
Of interest are the parameter values that represent the STN-GPe circuit, the cortex and the closed basal ganglia-cortical loop. The relationship between these values are shown in the two panels, where each circle represents a solution of the optimisation. A) Resonance model. B) Feedback model.
Fig 5
Fig 5. The dependence of oscillations on connection weights.
A) Stability of the model for different strengths of connections in the model. The model displays non-oscillatory behaviour when the parameters are below the surface and oscillatory behaviour when parameters are above the surface. B) The frequency of oscillations for different strengths of connections in the model. The three displays show frequency of oscillations for three values of w CS (indicated next to the number line). Dark blue corresponds to parameters for which no oscillation are produced.
Fig 6
Fig 6. Effects of time delay in cortical feedback on model behaviour.
A) The dependence of frequency in the feedback model on the delay in the long loop. B) The frequency range of oscillations produced by the linear system with delay only in cortical feedback for parameters that correspond to those along the stability boundary in panel C (i.e. for w SS slightly higher than the one at the stability boundary for a given T SS). C) The stability boundary of the linear system with delay only in cortical feedback. The analytic solution (solid curve) is overlaid with the numerical solutions (crosses). When the system is in the parameter region above the stability boundary the STN-GPe circuit oscillates.
Fig 7
Fig 7. Experimental data used to estimate parameters of the models.
A) Changes in the membrane potential of a GPe neuron following current injections. Data taken from Kita and Kitai [61] (Fig 2, Panel A). Dashed lines indicate V 0 e −1. B, C) Simulated auto-correlograms of STN and GPe neurons.

References

    1. Brown P, Oliviero A, Mazzone P, Insola A, Tonali P, Di Lazzaro V. Dopamine Dependency of Oscillations between Subthalamic Nucleus and Pallidum in Parkinson’s Disease. J Neurosci. 2001. February;21(3):1033–1038. Available from: http://www.jneurosci.org/content/21/3/1033.abstract. - PMC - PubMed
    1. Kühn AA, Kupsch A, Schneider GH, Brown P. Reduction in subthalamic 8–35 Hz oscillatory activity correlates with clinical improvement in Parkinson’s disease. Eur J Neurosci. 2006. April;23(7):1956–60. Available from: http://www.ncbi.nlm.nih.gov/pubmed/16623853. 10.1111/j.1460-9568.2006.04717.x - DOI - PubMed
    1. Hammond C, Bergman H, Brown P. Pathological synchronization in Parkinson’s disease: networks, models and treatments. Trends Neurosci. 2007. July;30(7):357–64. Available from: 10.1016/j.tins.2007.05.004. - DOI - PubMed
    1. Nambu A, Tachibana Y. Mechanism of parkinsonian neuronal oscillations in the primate basal ganglia: some considerations based on our recent work. Front Syst Neurosci. 2014. January;8:74 Available from: http://www.pubmedcentral.nih.gov/articlerender.fcgi?artid=4033056&tool=p.... 10.3389/fnsys.2014.00074 - DOI - PMC - PubMed
    1. Bevan MD, Magill PJ, Terman D, Bolam JP, Wilson CJ. Move to the rhythm: oscillations in the subthalamic nucleus-external globus pallidus network. Trends Neurosci. 2002. October;25(10):525–31. Available from: http://www.ncbi.nlm.nih.gov/pubmed/12220881. 10.1016/S0166-2236(02)02235-X - DOI - PubMed

Publication types