. 2016 Feb 28;371(2):225-39.
doi: 10.1016/j.canlet.2015.12.001. Epub 2015 Dec 10.

Bromodomain and hedgehog pathway targets in small cell lung cancer

Affiliations

Bromodomain and hedgehog pathway targets in small cell lung cancer

Gurmeet Kaur et al. Cancer Lett. .

Abstract

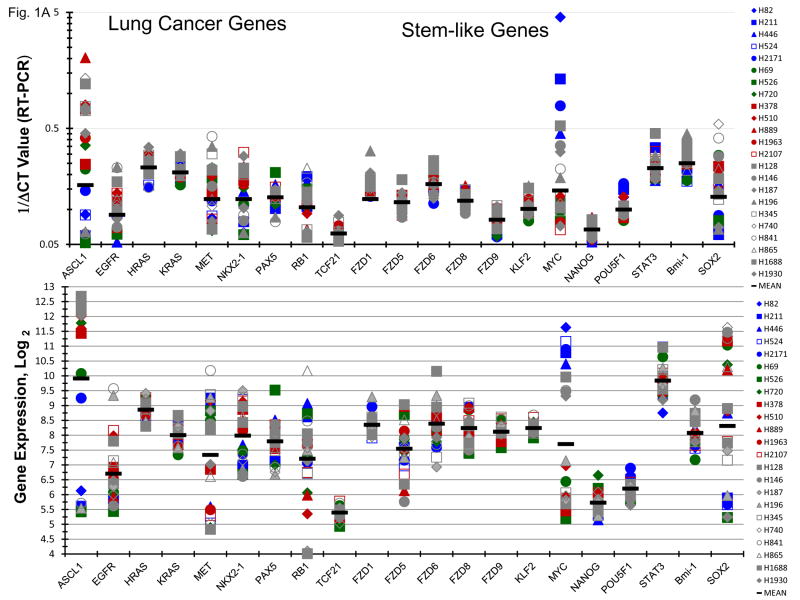
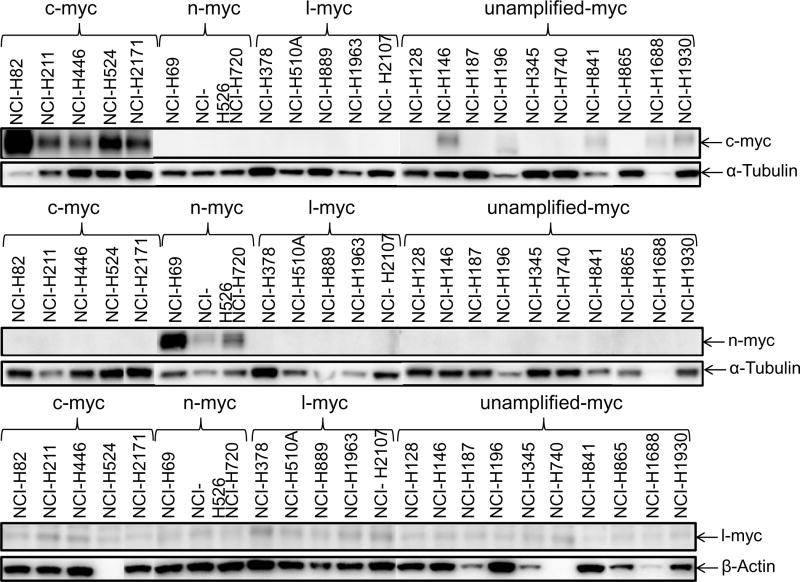
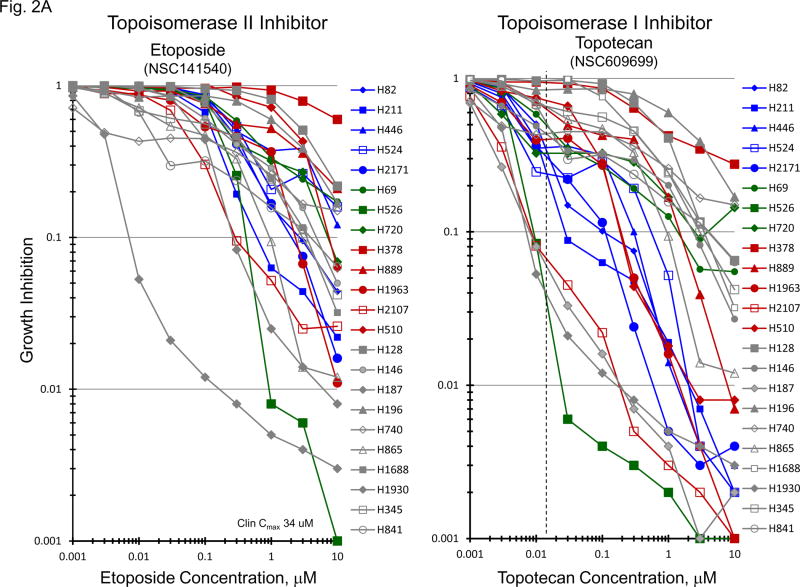
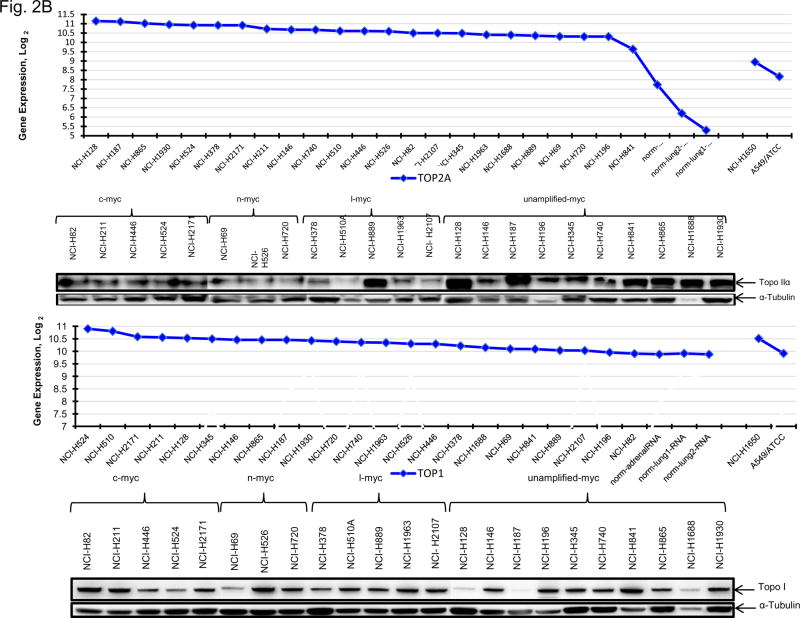
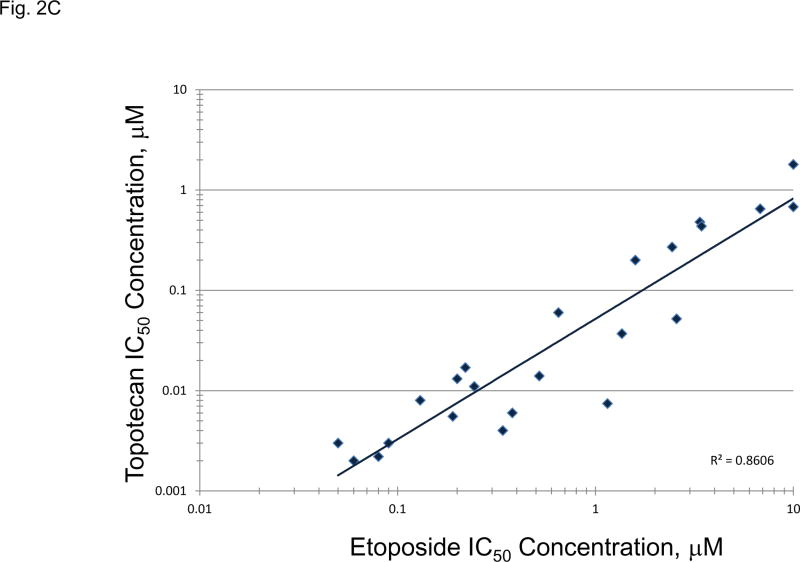
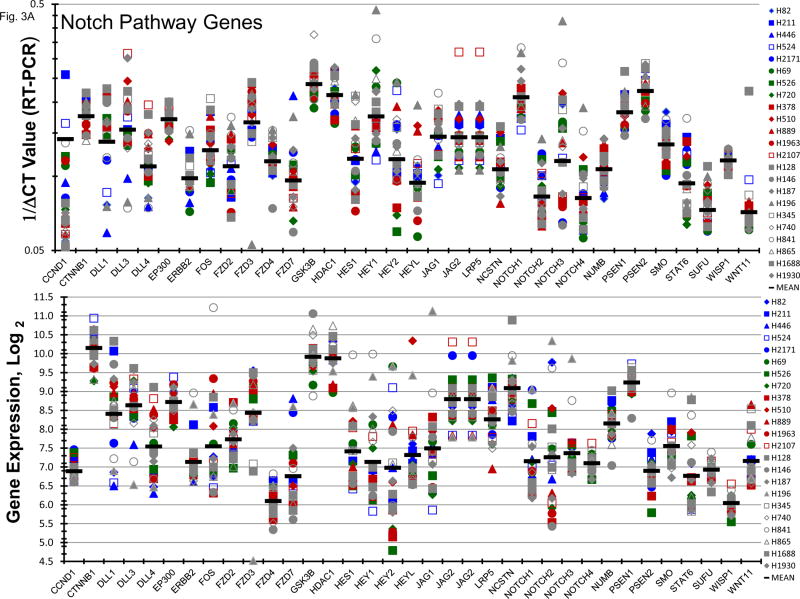
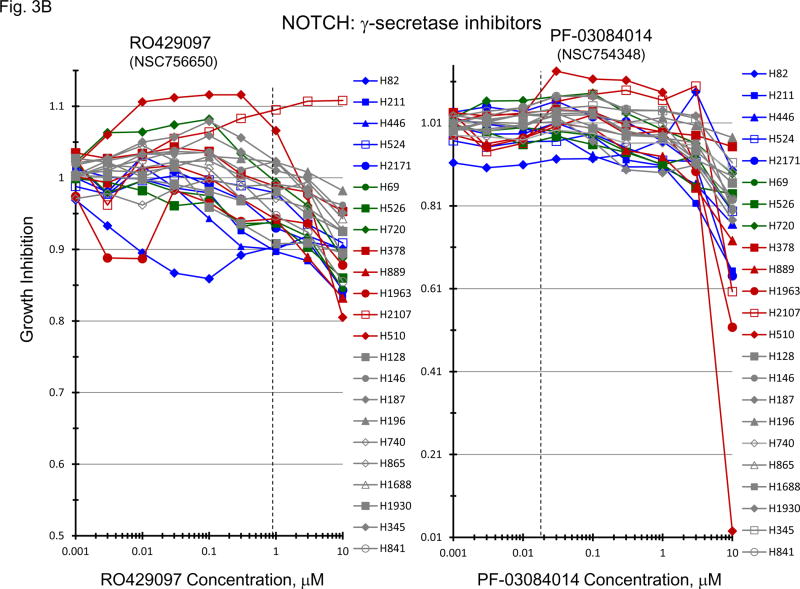
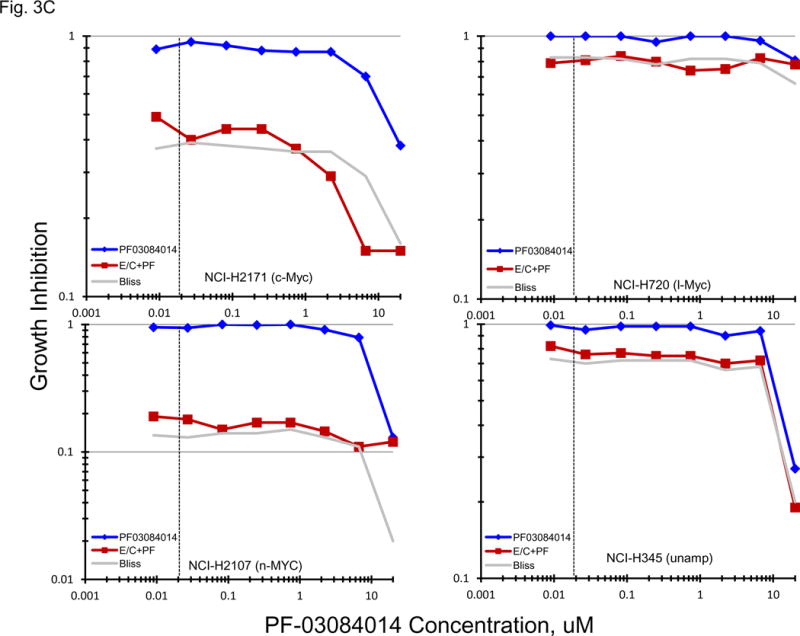
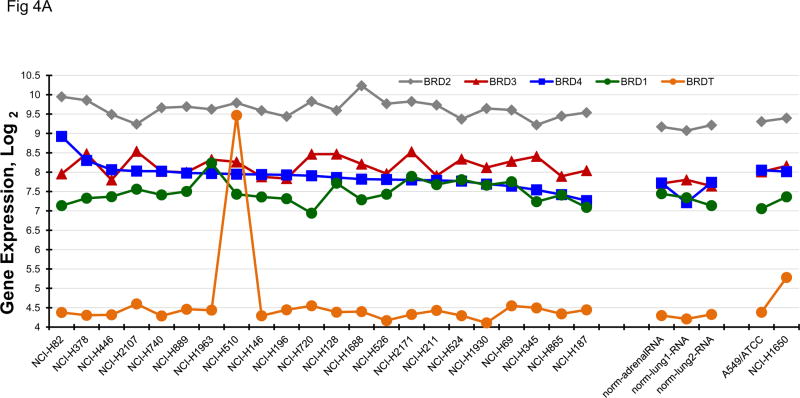
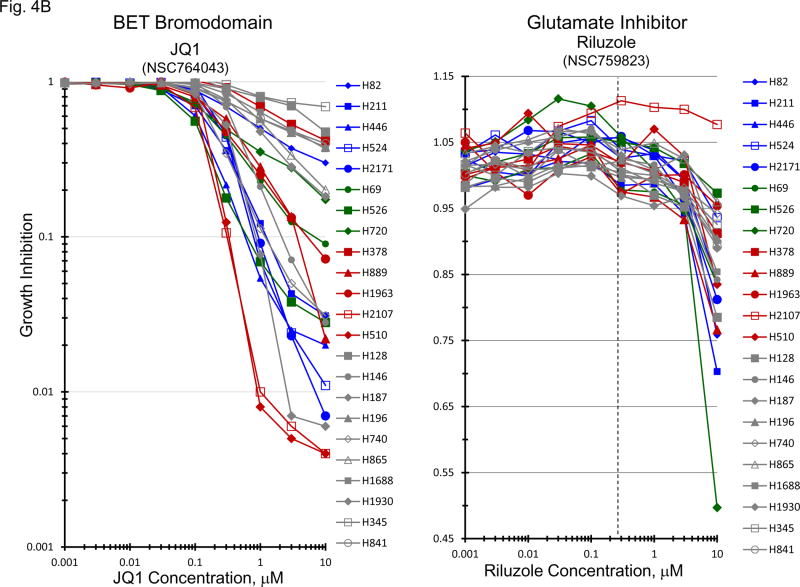
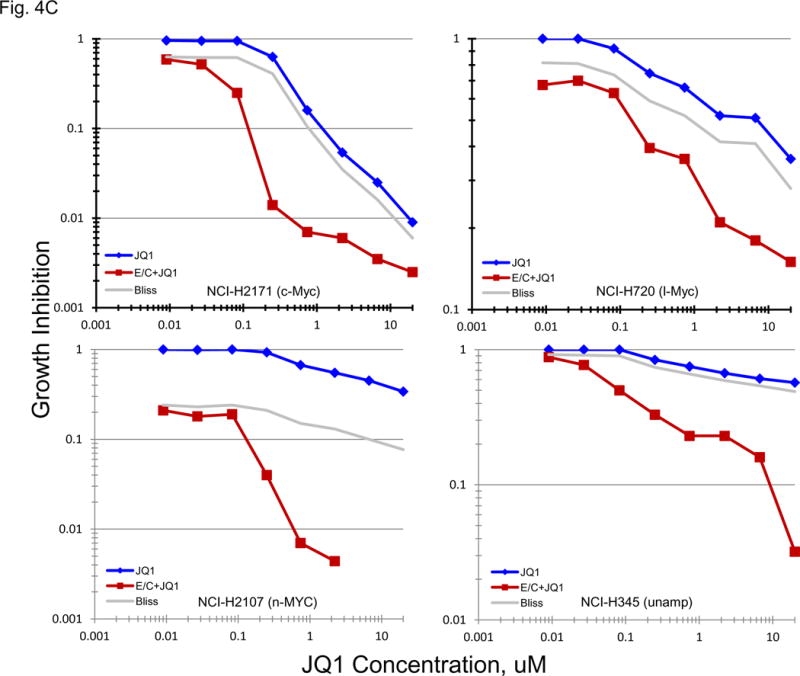
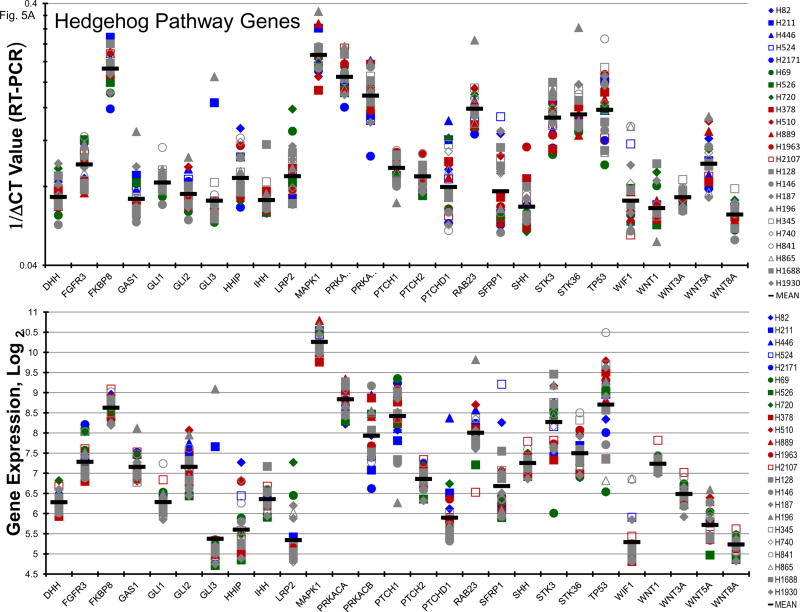
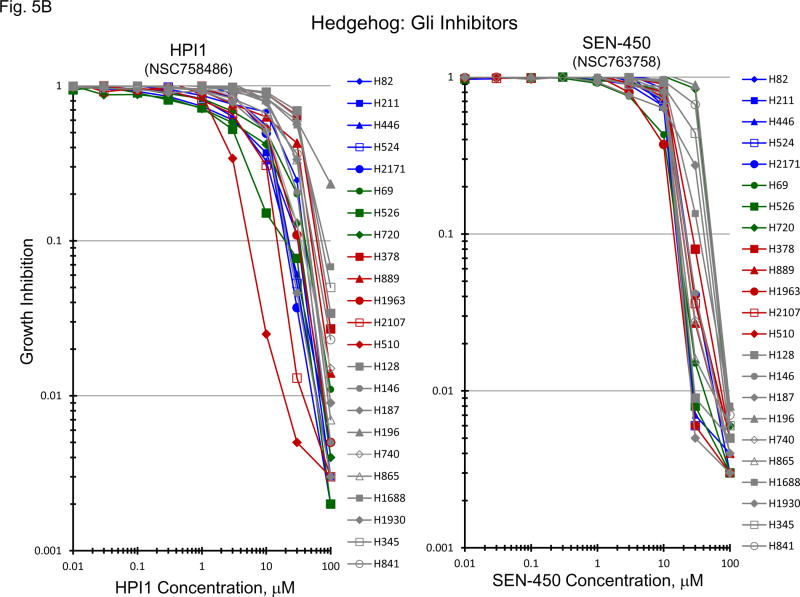
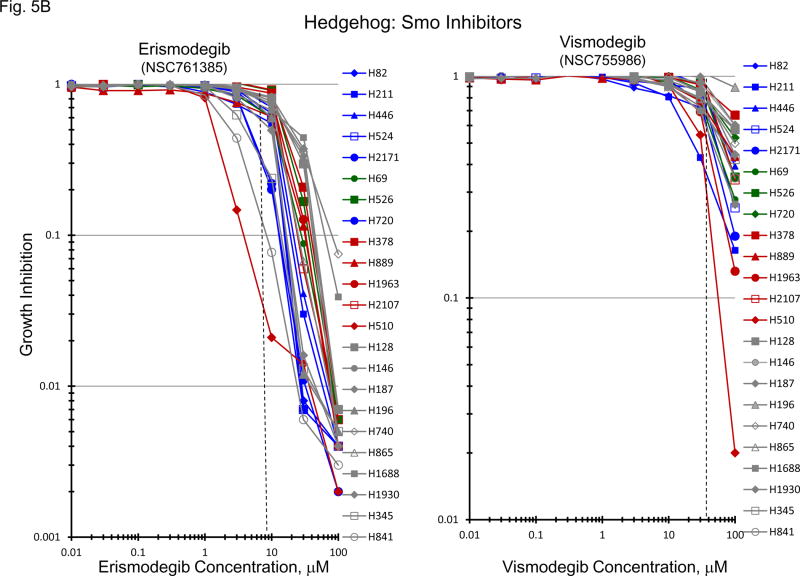
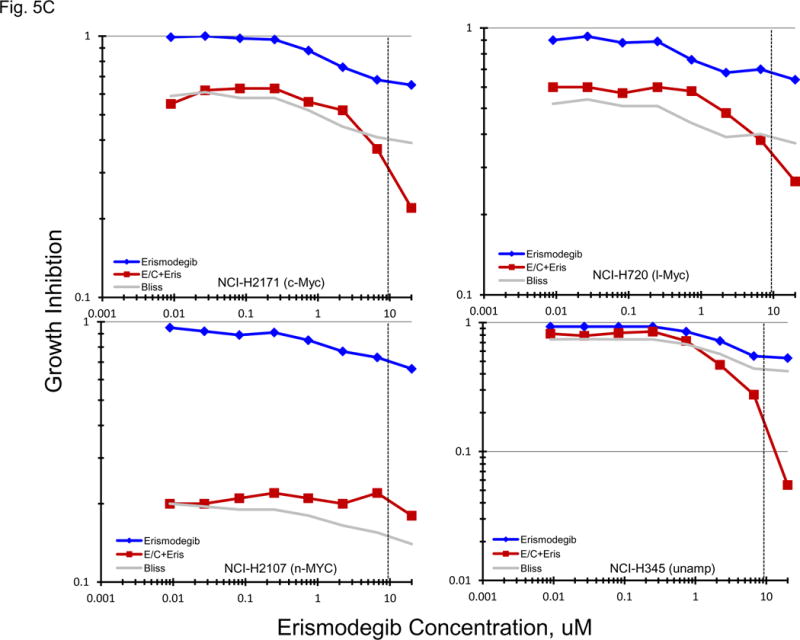
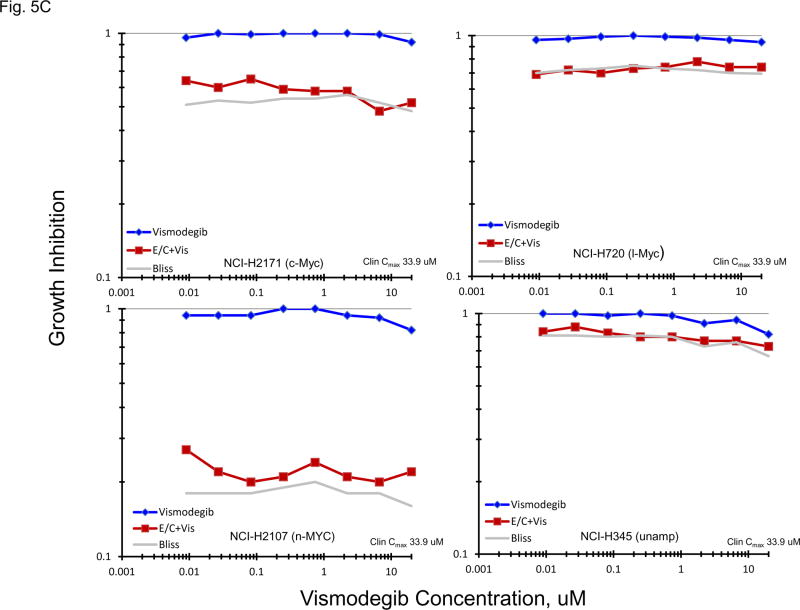
Small cell lung cancer (SCLC) is an extremely aggressive cancer that frequently recurs. Twenty-three human SCLC lines were selected representing varied Myc status. Gene expression of lung cancer, stem-like, hedgehog pathway, and notch pathway genes were determined by RT(2)-PCR array and Exon 1.0 ST array. Etoposide and topotecan concentration response was examined. The IC50's for etoposide and topotecan ranged over nearly 3 logs upon 96 hrs exposure to the drugs. Myc status, TOP2A, TOP2B and TOP1 mRNA expression or topoisomerase 1 and topoisomerase 2 protein did not account for the range in the sensitivity to the drugs. γ-secretase inhibitors, RO429097 and PF-03084014, had little activity in the SCLC lines over ranges covering the clinical Cmax concentrations. MYC amplified lines tended to be more sensitive to the bromodomain inhibitor JQ1. The Smo antagonists, erismodegib and vismodegib and the Gli antagonists, HPI1 and SEN-450 had a trend toward greater sensitivity of the MYC amplified line. Recurrent SCLC is among the most recalcitrant cancers and drug development efforts in this cancer are a high priority.

Keywords: Bromodomain inhibitors; Hedgehog inhibitors; SCLC; SCLC gene expression; Small cell lung cancer.


Conflict of interest statement

Conflict of Interest Statement

None.

Figures

Figure 1
Figure 1
Panel A Expression of genes associated with lung cancer and stem-like properties in 23 SCLC lines as determined by the 1/ΔCT value from RT-PCR or as log2 from gene expression derived from exon arrays. The blue symbols represent c-MYC amplified SCLC lines (n = 5), green symbols represent n-MYC amplified SCLC lines (n = 3), red symbols represent l-MYC amplified SCLC lines (n = 5) and gray symbols represents MYC unamplified SCLC lines (n = 10). Panel B: Western blot showing the expression of c-myc, n-myc, l-myc and α-tubulin in the 23 SCLC lines.
Figure 1
Figure 1
Panel A Expression of genes associated with lung cancer and stem-like properties in 23 SCLC lines as determined by the 1/ΔCT value from RT-PCR or as log2 from gene expression derived from exon arrays. The blue symbols represent c-MYC amplified SCLC lines (n = 5), green symbols represent n-MYC amplified SCLC lines (n = 3), red symbols represent l-MYC amplified SCLC lines (n = 5) and gray symbols represents MYC unamplified SCLC lines (n = 10). Panel B: Western blot showing the expression of c-myc, n-myc, l-myc and α-tubulin in the 23 SCLC lines.
Figure 2
Figure 2
Panel A TOP2A, TOP2B gene expression in the 23 SCLC lines, 3 normal cell types and 2 non-small cell lung cancer lines as determined by log2 from gene expression derived from exon arrays. The data were sorted on TOP2A expression from highest to lowest expressers, and TOP1 gene expression as determined by log2 from gene expression derived from exon arrays, sorted from highest to lowest TOP1 expression. PANEL B: Concentration response curves for the 23 SCLC lines exposed to 0.001 – 10 uM of the topoisomerase 2 inhibitor, etoposide, or the topoisomerase 1 inhibitor, topotecan, for 96 h. The blue symbols represent c-MYC amplified SCLC lines (n = 5), green symbols represent n-MYC amplified SCLC lines (n = 3), red symbols represent l-MYC amplified SCLC lines (n = 5) and gray symbols represents MYC unamplified SCLC lines (n = 10). The dotted line is the clinical Cmax for topotecan. The experiments were repeated 3–4 times. PANEL C: Relationship between sensitivity to etoposide and topotecan showing a strong correlation (R2 = 0.8606).
Figure 2
Figure 2
Panel A TOP2A, TOP2B gene expression in the 23 SCLC lines, 3 normal cell types and 2 non-small cell lung cancer lines as determined by log2 from gene expression derived from exon arrays. The data were sorted on TOP2A expression from highest to lowest expressers, and TOP1 gene expression as determined by log2 from gene expression derived from exon arrays, sorted from highest to lowest TOP1 expression. PANEL B: Concentration response curves for the 23 SCLC lines exposed to 0.001 – 10 uM of the topoisomerase 2 inhibitor, etoposide, or the topoisomerase 1 inhibitor, topotecan, for 96 h. The blue symbols represent c-MYC amplified SCLC lines (n = 5), green symbols represent n-MYC amplified SCLC lines (n = 3), red symbols represent l-MYC amplified SCLC lines (n = 5) and gray symbols represents MYC unamplified SCLC lines (n = 10). The dotted line is the clinical Cmax for topotecan. The experiments were repeated 3–4 times. PANEL C: Relationship between sensitivity to etoposide and topotecan showing a strong correlation (R2 = 0.8606).
Figure 3
Figure 3
PANEL A Expression of genes associated with the Notch pathway in 23 SCLC lines as determined by the 1/ΔCT value from RT-PCR or as log2 from gene expression derived from exon arrays. The blue symbols represent c-MYC amplified SCLC lines (n = 5), green symbols represent n-MYC amplified SCLC lines (n = 3), red symbols represent l-MYC amplified SCLC lines (n = 5) and gray symbols represents MYC unamplified SCLC lines (n = 10). PANEL B: Concentration response curves for the 23 SCLC lines exposed to 0.001 – 10 uM of the γ-secretase inhibitors, RO429097 and PF-03084014, for 96 h. The blue symbols represent c-MYC amplified SCLC lines (n = 5), green symbols represent n-MYC amplified SCLC lines (n = 3), red symbols represent l-MYC amplified SCLC lines (n = 5) and gray symbols represents MYC unamplified SCLC lines (n = 10). The dotted lines are the clinical Cmax for each compound. The experiments were repeated 3–4 times. PANEL C: Concentration response curves for 4 representative SCLC lines exposed to 0.01 – 20 uM of PF-03084014 alone (blue line) or in simultaneous combination with 3.7uM carboplatin and 0.3uM etoposide (red line). The gray line is calculated simple Bliss additivity for the combination regimen.
Figure 3
Figure 3
PANEL A Expression of genes associated with the Notch pathway in 23 SCLC lines as determined by the 1/ΔCT value from RT-PCR or as log2 from gene expression derived from exon arrays. The blue symbols represent c-MYC amplified SCLC lines (n = 5), green symbols represent n-MYC amplified SCLC lines (n = 3), red symbols represent l-MYC amplified SCLC lines (n = 5) and gray symbols represents MYC unamplified SCLC lines (n = 10). PANEL B: Concentration response curves for the 23 SCLC lines exposed to 0.001 – 10 uM of the γ-secretase inhibitors, RO429097 and PF-03084014, for 96 h. The blue symbols represent c-MYC amplified SCLC lines (n = 5), green symbols represent n-MYC amplified SCLC lines (n = 3), red symbols represent l-MYC amplified SCLC lines (n = 5) and gray symbols represents MYC unamplified SCLC lines (n = 10). The dotted lines are the clinical Cmax for each compound. The experiments were repeated 3–4 times. PANEL C: Concentration response curves for 4 representative SCLC lines exposed to 0.01 – 20 uM of PF-03084014 alone (blue line) or in simultaneous combination with 3.7uM carboplatin and 0.3uM etoposide (red line). The gray line is calculated simple Bliss additivity for the combination regimen.
Figure 4
Figure 4
PANEL A BRD1, BRD2, BRD3, BRD4 and BRDT gene expression in the 23 SCLC lines, 3 normal cell types and 2 non-small cell lung cancer lines as determined by log2 from gene expression derived from exon arrays. The data were sorted on BRD4 expression from highest to lowest expressers. PANEL B: Concentration response curves for the 23 SCLC lines exposed to 0.001 – 10 uM of the BET bromodomain inhibitor, JQ1, and the glutamate inhibitor, riluzole, for 96 h. The blue symbols represent c-MYC amplified SCLC lines (n = 5), green symbols represent n-MYC amplified SCLC lines (n = 3), red symbols represent l-MYC amplified SCLC lines (n = 5) and gray symbols represents MYC unamplified SCLC lines (n = 10). The dotted line is the clinical Cmax for riluzole. The experiments were repeated 3–4 times. PANEL C: Concentration response curves for 4 representative SCLC lines exposed to 0.01 – 20 uM of JQ1 alone (blue line) or in simultaneous combination with 3.7uM carboplatin and 0.3uM etoposide (red line). The gray line is calculated simple Bliss additivity for the combination regimen.
Figure 4
Figure 4
PANEL A BRD1, BRD2, BRD3, BRD4 and BRDT gene expression in the 23 SCLC lines, 3 normal cell types and 2 non-small cell lung cancer lines as determined by log2 from gene expression derived from exon arrays. The data were sorted on BRD4 expression from highest to lowest expressers. PANEL B: Concentration response curves for the 23 SCLC lines exposed to 0.001 – 10 uM of the BET bromodomain inhibitor, JQ1, and the glutamate inhibitor, riluzole, for 96 h. The blue symbols represent c-MYC amplified SCLC lines (n = 5), green symbols represent n-MYC amplified SCLC lines (n = 3), red symbols represent l-MYC amplified SCLC lines (n = 5) and gray symbols represents MYC unamplified SCLC lines (n = 10). The dotted line is the clinical Cmax for riluzole. The experiments were repeated 3–4 times. PANEL C: Concentration response curves for 4 representative SCLC lines exposed to 0.01 – 20 uM of JQ1 alone (blue line) or in simultaneous combination with 3.7uM carboplatin and 0.3uM etoposide (red line). The gray line is calculated simple Bliss additivity for the combination regimen.
Figure 5
Figure 5
PANEL A Expression of genes associated with the Hedgehog pathway in 23 SCLC lines as determined by the 1/ΔCT value from RT-PCR or as log2 from gene expression derived from exon arrays. The blue symbols represent c-MYC amplified SCLC lines (n = 5), green symbols represent n-MYC amplified SCLC lines (n = 3), red symbols represent l-MYC amplified SCLC lines (n = 5) and gray symbols represents MYC unamplified SCLC lines (n = 10). PANEL B: Concentration response curves for the 23 SCLC lines exposed to 0.01 – 100 uM of the Gli inhibitors, HPI1 and SEN-450, and the Smo inhibitors, erismodegib and vismodegib, for 96 h. The blue symbols represent c-MYC amplified SCLC lines (n = 5), green symbols represent n-MYC amplified SCLC lines (n = 3), red symbols represent l-MYC amplified SCLC lines (n = 5) and gray symbols represents MYC unamplified SCLC lines (n = 10). The dotted lines are the clinical Cmax for erismodegib and vismodegib. The experiments were repeated 3–4 times. PANEL C: Concentration response curves for 4 representative SCLC lines exposed to 0.01 – 20 uM of erismodegib or vismodegib alone (blue line) or in simultaneous combination with 3.7uM carboplatin and 0.3uM etoposide (red line). The gray line is calculated simple Bliss additivity for the combination regimen.
Figure 5
Figure 5
PANEL A Expression of genes associated with the Hedgehog pathway in 23 SCLC lines as determined by the 1/ΔCT value from RT-PCR or as log2 from gene expression derived from exon arrays. The blue symbols represent c-MYC amplified SCLC lines (n = 5), green symbols represent n-MYC amplified SCLC lines (n = 3), red symbols represent l-MYC amplified SCLC lines (n = 5) and gray symbols represents MYC unamplified SCLC lines (n = 10). PANEL B: Concentration response curves for the 23 SCLC lines exposed to 0.01 – 100 uM of the Gli inhibitors, HPI1 and SEN-450, and the Smo inhibitors, erismodegib and vismodegib, for 96 h. The blue symbols represent c-MYC amplified SCLC lines (n = 5), green symbols represent n-MYC amplified SCLC lines (n = 3), red symbols represent l-MYC amplified SCLC lines (n = 5) and gray symbols represents MYC unamplified SCLC lines (n = 10). The dotted lines are the clinical Cmax for erismodegib and vismodegib. The experiments were repeated 3–4 times. PANEL C: Concentration response curves for 4 representative SCLC lines exposed to 0.01 – 20 uM of erismodegib or vismodegib alone (blue line) or in simultaneous combination with 3.7uM carboplatin and 0.3uM etoposide (red line). The gray line is calculated simple Bliss additivity for the combination regimen.

Comment in

References

    1. Paumier A, Le Pechoux C. Radiotherapy in small cell lung cancer: where should it go. Lung Cancer. 2010;69:133–40. - PubMed
    1. Rodriguez E, Lilenbaum RC. Small cell lung cancer: past, present and future. Curr Oncol Rep. 2010;12:327–34. - PubMed
    1. D’Angelo SP, Pietanza MC. The molecular pathogenesis of small cell lung cancer. Cancer Biol Ther. 2010;10:1–10. - PubMed
    1. Johnson BE, Russell E, Simmons AM, Phelps R, Steinberg SM, Ihde DC, et al. MYC family DNA amplification in 126 tumor cell lines from patients with small cell lung cancer. J Cell Biochem Suppl. 1996;24:210–7. - PubMed
    1. Shivapurkar N, Reddy J, Matta H, Sathyanarayana UG, Huang CX, Toyooka S, et al. Loss expression of death-inducing signaling complex (DISC) components in lung cancer cell lines and the influence of MYC amplification. Oncogene. 2002;21:8510–4. - PubMed

Publication types

MeSH terms