Comparative Study
. 2015 Dec 18;13(12):e1002315.
doi: 10.1371/journal.pbio.1002315. eCollection 2015 Dec.

The Constrained Maximal Expression Level Owing to Haploidy Shapes Gene Content on the Mammalian X Chromosome

Collaborators, Affiliations
Comparative Study

The Constrained Maximal Expression Level Owing to Haploidy Shapes Gene Content on the Mammalian X Chromosome

Laurence D Hurst et al. PLoS Biol. .

Abstract

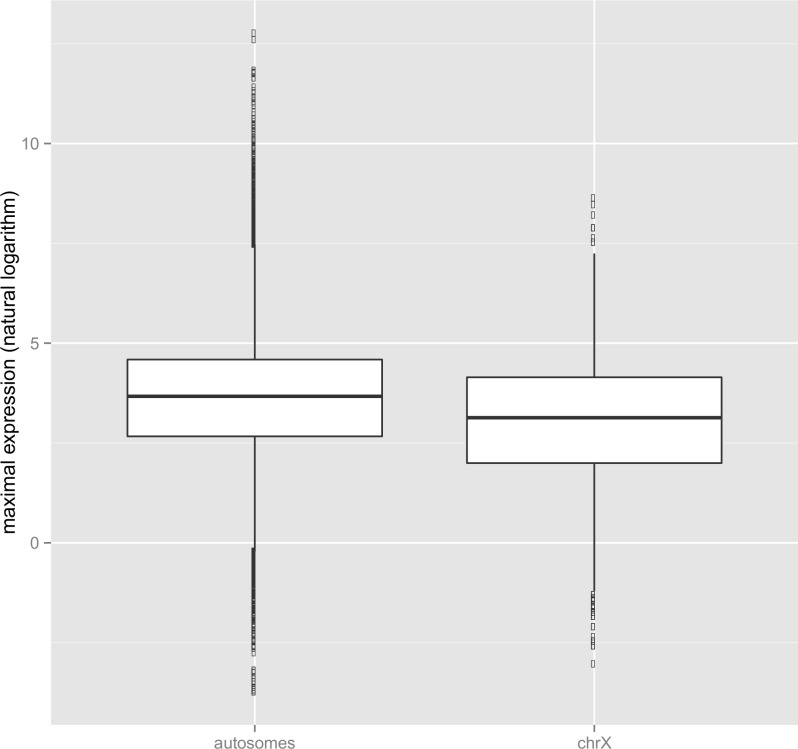
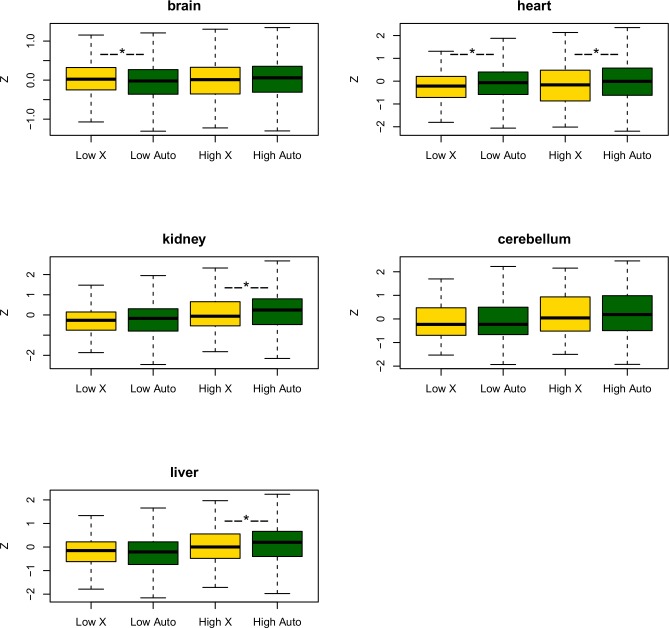
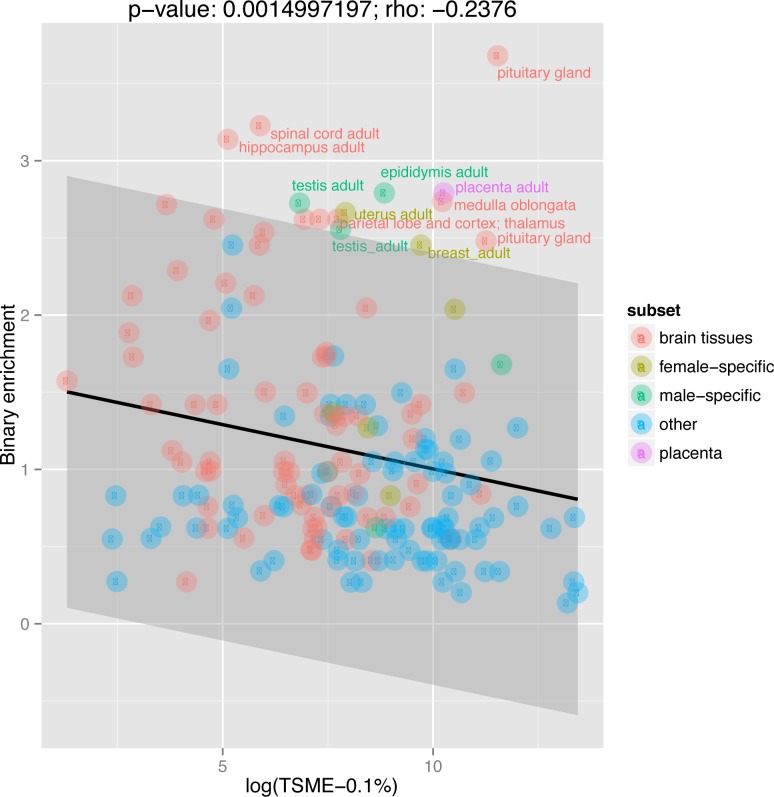
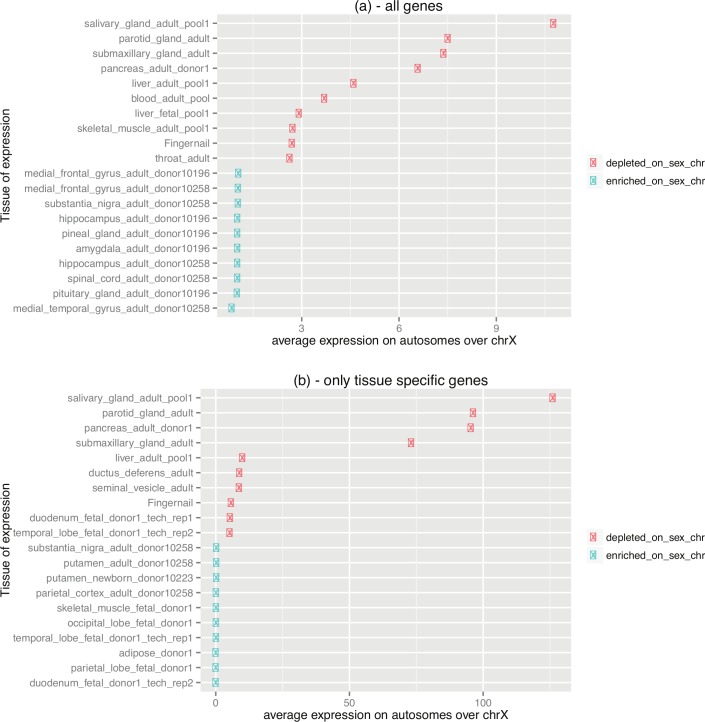
X chromosomes are unusual in many regards, not least of which is their nonrandom gene content. The causes of this bias are commonly discussed in the context of sexual antagonism and the avoidance of activity in the male germline. Here, we examine the notion that, at least in some taxa, functionally biased gene content may more profoundly be shaped by limits imposed on gene expression owing to haploid expression of the X chromosome. Notably, if the X, as in primates, is transcribed at rates comparable to the ancestral rate (per promoter) prior to the X chromosome formation, then the X is not a tolerable environment for genes with very high maximal net levels of expression, owing to transcriptional traffic jams. We test this hypothesis using The Encyclopedia of DNA Elements (ENCODE) and data from the Functional Annotation of the Mammalian Genome (FANTOM5) project. As predicted, the maximal expression of human X-linked genes is much lower than that of genes on autosomes: on average, maximal expression is three times lower on the X chromosome than on autosomes. Similarly, autosome-to-X retroposition events are associated with lower maximal expression of retrogenes on the X than seen for X-to-autosome retrogenes on autosomes. Also as expected, X-linked genes have a lesser degree of increase in gene expression than autosomal ones (compared to the human/Chimpanzee common ancestor) if highly expressed, but not if lowly expressed. The traffic jam model also explains the known lower breadth of expression for genes on the X (and the Z of birds), as genes with broad expression are, on average, those with high maximal expression. As then further predicted, highly expressed tissue-specific genes are also rare on the X and broadly expressed genes on the X tend to be lowly expressed, both indicating that the trend is shaped by the maximal expression level not the breadth of expression per se. Importantly, a limit to the maximal expression level explains biased tissue of expression profiles of X-linked genes. Tissues whose tissue-specific genes are very highly expressed (e.g., secretory tissues, tissues abundant in structural proteins) are also tissues in which gene expression is relatively rare on the X chromosome. These trends cannot be fully accounted for in terms of alternative models of biased expression. In conclusion, the notion that it is hard for genes on the Therian X to be highly expressed, owing to transcriptional traffic jams, provides a simple yet robustly supported rationale of many peculiar features of X's gene content, gene expression, and evolution.


Conflict of interest statement

The authors have declared that no competing interests exist.

Figures

Fig 1
Fig 1. A lower maximal expression level on the X chromosome.
This figure shows maximal expression levels for autosomes and the X chromosome. Maximal expression is defined as transcript’s maximal expression level (in TPM) in any of the FANTOM5 human tissues. The underlying data can be found at http://fantom.gsc.riken.jp/5/data/ and in Dryad Digital Repository (doi:10.5061/dryad.p4s57) [43].
Fig 2
Fig 2. The comparison of change in gene expression (Z) since the human-Chimpanzee common ancestor for five somatic tissues.
Genes are divided into X-linked (yellow) and autosomal (green). In turn, they are split into a half with low expression in the ancestor (low) and a half with high expression (high). Genes with no expression in the ancestor are excluded from this analysis (but this makes no qualitative difference). In all instances, the high-expression X-linked genes have a lower median Z-score than high-expression autosomal genes, this being significant in three instances using a Mann Whitney U test (shown as *). The combined p-value is highly significant (see main text). There is no consistent trend for the low-expression genes. The underlying data can be found at http://fantom.gsc.riken.jp/5/data/ and in Dryad Digital Repository (doi:10.5061/dryad.p4s57).
Fig 3
Fig 3. A correlation between tissue-specific maximal expression (TSME) and binary enrichment on the X chromosome.
This figure shows a scatterplot where each data point is a FANTOM5 library (points are colored-coded to highlight brain tissues, sex-specific tissues, and the placenta). X-axis corresponds to the average maximal expression of given tissue’s top 0.1% preferentially expressed genes (i.e., TSME, using a logarithmic scale). Y-axis corresponds to binary enrichment. The strength of the Spearman correlation and p-values are annotated with text above the figure panel. Data points that have standardized residuals more than 1.96 standard deviations (highlighted as grey area) from the linear regression line (which is plotted in black) have their names annotated with text. The underlying data can be found at http://fantom.gsc.riken.jp/5/data/ and in Dryad Digital Repository (doi:10.5061/dryad.p4s57).
Fig 4
Fig 4. Analog enrichment in expression on the X chromosome.
This figure consists of two panels identifiable as a and b. Each panel shows the ratio of average (per locus) expression on autosomes over that observed on the X chromosome (if the ratio was higher than one given tissue was enriched in expression on autosomes). Panel a shows data for all genes, panel b shows data only for tissue-specific genes (i.e., these with the breadth of expression lower than 0.33). Only the top ten over-represented and the top ten under-represented tissues are shown. Brain subsets are clearly most X-enriched tissues. Exocrine gastrointestinal glands, in contrast, are the most X-depleted tissues. The underlying data can be found at http://fantom.gsc.riken.jp/5/data/ and in Dryad Digital Repository (doi:10.5061/dryad.p4s57).
Fig 5
Fig 5. The number of transcription factor binding sites per proximal promoter is higher on autosomes than on sex chromosomes.
This figure consists of two parts identified as a and b. In part a, the average number of transcription factor binding sites per promoter in symmetrical windows around transcriptional start sites (TSSes) is shown. The plots have a characteristic shape of the V-sign. On the x-axis of panel a, values from negative 3 kbps to zero signify positions upstream TSSes (negative values signify positions downstream the TSS). In part b, V-sign-shaped curves are plotted separately for each chromosome (and the x-axis corresponds to the order of chromosomes from 1 to 22 plus the X and Y). The curves are similar between autosomes, but TfbsNo is lower for sex chromosomes. The underlying data can be found at http://fantom.gsc.riken.jp/5/data/ and in Dryad Digital Repository (doi:10.5061/dryad.p4s57).
Fig 6
Fig 6. A shift in the breadth of expression for split pairs of autosomal-X paralogs.
This figure shows barplots for the shift in the breadth of expression (ΔBoE) depending on the taxon of duplication for autosomal-X paralogs. The critical result is that all groups except primates were shifted significantly below zero (Wilcoxon one-sided test p-values are given brackets): primate (p = 0.639), mammalian (p = 2.479e-12), vertebrate (p = 9.178e-13), animal (p = 1.046e-07), eukaryotic (p = 0.00087). The differences between groups were not statistically significant after multiple-testing correction, but it was not the point of this analysis to show any differences between the taxa. For figure clarity, we do not show these data, but as expected (as these are non-directional comparisons), the average ΔBoE is close to zero for autosomal-only (same or different chromosome), X-only, and Y-only duplications, regardless of age. The underlying data can be found at http://fantom.gsc.riken.jp/5/data/ and in Dryad Digital Repository (doi:10.5061/dryad.p4s57).
Fig 7
Fig 7. A shift towards a lower breadth of expression on the X is duplication-dependent.
This figure shows boxplots for the breadth of expression depending on the chromosomal location and gene family size. Only for medium (more than two members) and big gene families (more than five members) is there a difference in the breadth of expression between autosomes and the X, suggesting the effect is duplication-dependent. The underlying data can be found at http://fantom.gsc.riken.jp/5/data/ and in Dryad Digital Repository (doi:10.5061/dryad.p4s57).

References

    1. Ohno DS. Sex Chromosomes and Sex-Linked Genes. Berlin, Heidelberg, New York: Springer-Verlag; 1967.
    1. Vicoso B, Charlesworth B. Evolution on the X chromosome: unusual patterns and processes. Nat Rev Genet. 2006;7(8):645–53. Epub 2006/07/19. 10.1038/nrg1914 . - DOI - PubMed
    1. Gurbich TA, Bachtrog D. Gene content evolution on the X chromosome. Current Opinion in Genetics & Development. 2008;18(6):493–8. Epub 2008/10/22. 10.1016/j.gde.2008.09.006 . - DOI - PMC - PubMed
    1. Wilson MA, Makova KD. Genomic analyses of sex chromosome evolution. Annu Rev Genomics Hum Genet. 2009;10:333–54. Epub 2009/07/28. 10.1146/annurev-genom-082908-150105 . - DOI - PubMed
    1. Charlesworth B, Coyne JA, Barton NH. The Relative Rates of Evolution of Sex Chromosomes and Autosomes. Am Nat. 1987;130(1):113–46.

Publication types