

White matter changes after stroke in type 2 diabetic rats measured by diffusion magnetic resonance imaging
- PMID: 26685128
- PMCID: PMC5363742
- DOI: 10.1177/0271678X15622464
White matter changes after stroke in type 2 diabetic rats measured by diffusion magnetic resonance imaging
Abstract
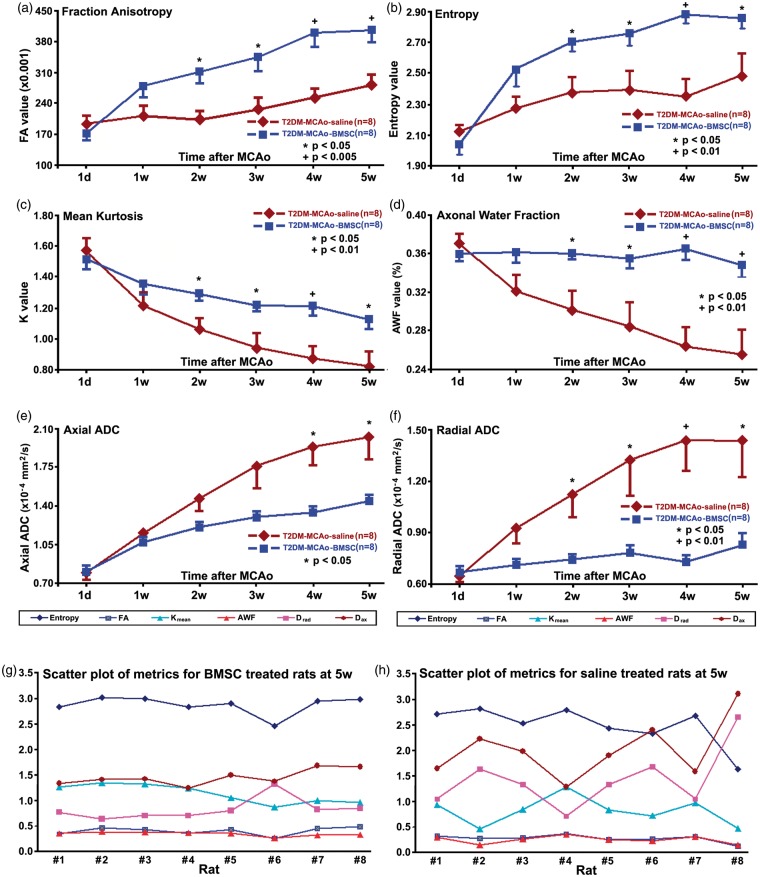
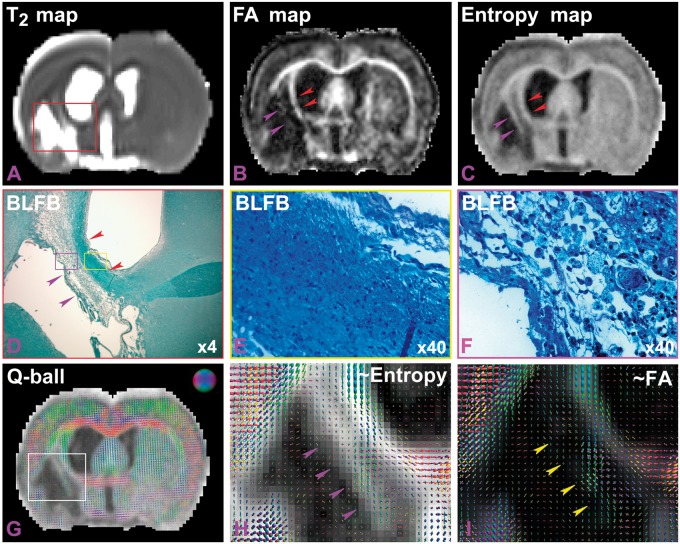
Diffusion-related magnetic resonance imaging parametric maps may be employed to characterize white matter of brain. We hypothesize that entropy of diffusion anisotropy may be most effective for detecting therapeutic effects of bone marrow stromal cell treatment of ischemia in type 2 diabetes mellitus rats. Type 2 diabetes mellitus was induced in adult male Wistar rats. These rats were then subjected to 2 h of middle cerebral artery occlusion, and received bone marrow stromal cell (5 × 10⁶, n = 8) or an equal volume of saline (n = 8) via tail vein injection at three days after middle cerebral artery occlusion. Magnetic resonance imaging was performed on day one and then weekly for five weeks post middle cerebral artery occlusion. The diffusion metrics complementarily permitted characterization of axons and axonal myelination. All six magnetic resonance imaging diffusion metrics, confirmed by histological measures, demonstrated that bone marrow stromal cell treatment significantly (p < 0.05) improved magnetic resonance imaging diffusion indices of white matter in type 2 diabetes mellitus rats after middle cerebral artery occlusion compared with the saline-treated rats. Superior to the fractional anisotropy metric that provided measures related to organization of neuronal fiber bundles, the entropy metric can also identify microstructures and low-density axonal fibers of cerebral tissue after stroke in type 2 diabetes mellitus rats.
Keywords: White matter; diabetes; diffusion; magnetic resonance imaging; stroke.
© The Author(s) 2015.
Figures


Similar articles
-
Persistent cerebrovascular damage after stroke in type two diabetic rats measured by magnetic resonance imaging.Stroke. 2015 Feb;46(2):507-12. doi: 10.1161/STROKEAHA.114.007538. Epub 2014 Dec 18. Stroke. 2015. PMID: 25523056 Free PMC article.
-
miR-145 Regulates Diabetes-Bone Marrow Stromal Cell-Induced Neurorestorative Effects in Diabetes Stroke Rats.Stem Cells Transl Med. 2016 Dec;5(12):1656-1667. doi: 10.5966/sctm.2015-0349. Epub 2016 Jul 26. Stem Cells Transl Med. 2016. PMID: 27460851 Free PMC article.
-
Cell Treatment for Stroke in Type Two Diabetic Rats Improves Vascular Permeability Measured by MRI.PLoS One. 2016 Feb 22;11(2):e0149147. doi: 10.1371/journal.pone.0149147. eCollection 2016. PLoS One. 2016. PMID: 26900843 Free PMC article.
-
The effect of age-related risk factors and comorbidities on white matter injury and repair after ischemic stroke.Neurobiol Dis. 2019 Jun;126:13-22. doi: 10.1016/j.nbd.2018.07.008. Epub 2018 Jul 11. Neurobiol Dis. 2019. PMID: 30017454 Free PMC article. Review.
-
Mapping the Brain Effects of Hearing Loss: The Matter of White Matter.JAMA Otolaryngol Head Neck Surg. 2020 Nov 1;146(11):1043-1044. doi: 10.1001/jamaoto.2020.2528. JAMA Otolaryngol Head Neck Surg. 2020. PMID: 32880605 Review. No abstract available.
Cited by
-
Differences in brain activity between normal and diabetic rats under isoflurane anesthesia: a resting-state functional MRI study.BMC Med Imaging. 2022 Aug 4;22(1):136. doi: 10.1186/s12880-022-00867-6. BMC Med Imaging. 2022. PMID: 35927630 Free PMC article.
-
Post-Stroke Administration of L-4F Promotes Neurovascular and White Matter Remodeling in Type-2 Diabetic Stroke Mice.Front Neurol. 2022 Apr 28;13:863934. doi: 10.3389/fneur.2022.863934. eCollection 2022. Front Neurol. 2022. PMID: 35572941 Free PMC article.
-
Cornel Iridoid Glycoside Protects Against White Matter Lesions Induced by Cerebral Ischemia in Rats via Activation of the Brain-Derived Neurotrophic Factor/Neuregulin-1 Pathway.Neuropsychiatr Dis Treat. 2019 Dec 2;15:3327-3340. doi: 10.2147/NDT.S228417. eCollection 2019. Neuropsychiatr Dis Treat. 2019. PMID: 31819458 Free PMC article.
-
Diabetic aggravation of stroke and animal models.Exp Neurol. 2017 Jun;292:63-79. doi: 10.1016/j.expneurol.2017.03.004. Epub 2017 Mar 6. Exp Neurol. 2017. PMID: 28274862 Free PMC article. Review.
-
Diffusion-Derived Magnetic Resonance Imaging Measures of Longitudinal Microstructural Remodeling Induced by Marrow Stromal Cell Therapy after Traumatic Brain Injury.J Neurotrauma. 2017 Jan 1;34(1):182-191. doi: 10.1089/neu.2015.4315. Epub 2016 May 13. J Neurotrauma. 2017. PMID: 26993214 Free PMC article.
References
-
- Le Bihan D, Breton E, Lallemand D, et al. MR imaging of intravoxel incoherent motions: application to diffusion and perfusion in neurologic disorders. Radiology 1986; 161: 401–407. - PubMed
-
- Hoehn-Berlage M, Eis M, Back T, et al. Changes of relaxation times (T1, T2) and apparent diffusion coefficient after permanent middle cerebral artery occlusion in the rat: temporal evolution, regional extent, and comparison with histology. Magn Reson Med 1995; 34: 824–834. - PubMed
-
- Ding G, Jiang Q, Zhang L, et al. Multiparametric ISODATA analysis of embolic stroke and rt-PA intervention in rat. J Neurol Sci 2004; 223: 135–143. - PubMed
-
- Le Bihan D, Turner R, Douek P, et al. Diffusion MR imaging: clinical applications. AJR Am J Roentgenol 1992; 159: 591–599. - PubMed
Publication types
MeSH terms
Grants and funding
LinkOut - more resources
Full Text Sources
Other Literature Sources
Medical
