. 2015 Dec 19:16:94.
doi: 10.1186/s12868-015-0228-5.

Multilevel analysis quantifies variation in the experimental effect while optimizing power and preventing false positives

Affiliations

Multilevel analysis quantifies variation in the experimental effect while optimizing power and preventing false positives

Emmeke Aarts et al. BMC Neurosci. .

Abstract

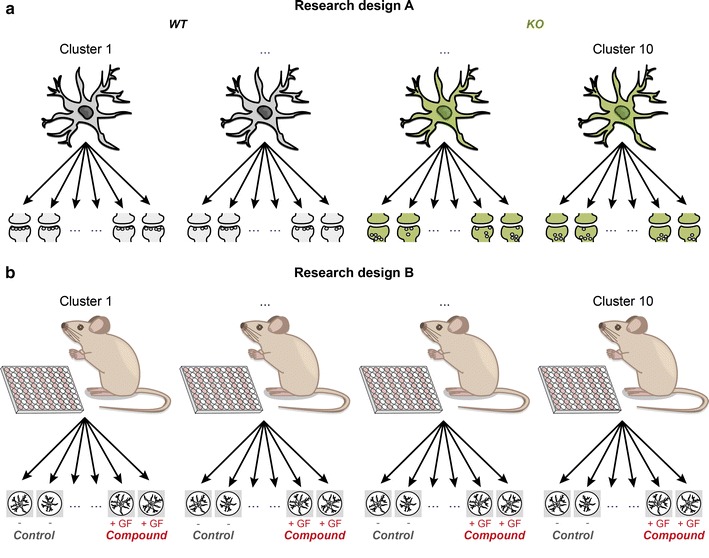
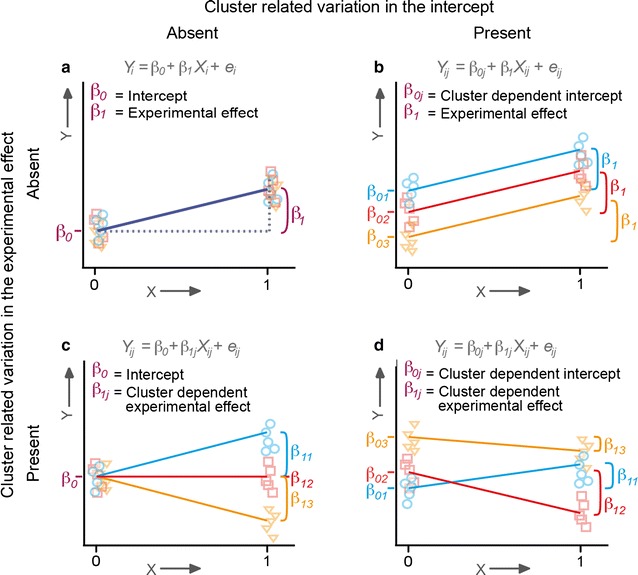
Background: In neuroscience, experimental designs in which multiple measurements are collected in the same research object or treatment facility are common. Such designs result in clustered or nested data. When clusters include measurements from different experimental conditions, both the mean of the dependent variable and the effect of the experimental manipulation may vary over clusters. In practice, this type of cluster-related variation is often overlooked. Not accommodating cluster-related variation can result in inferential errors concerning the overall experimental effect.

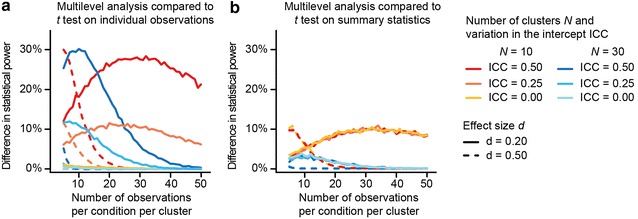
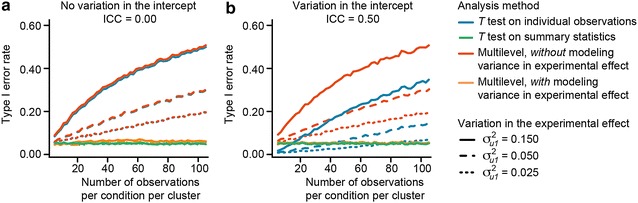
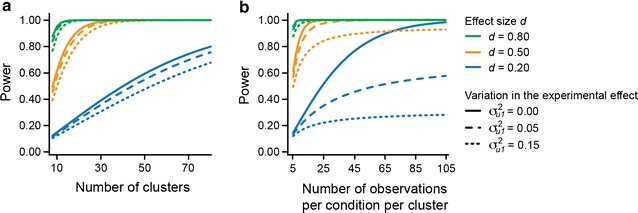
Results: The exact effect of ignoring the clustered nature of the data depends on the effect of clustering. Using simulation studies we show that cluster-related variation in the experimental effect, if ignored, results in a false positive rate (i.e., Type I error rate) that is appreciably higher (up to ~20-~50 %) than the chosen [Formula: see text]-level (e.g., [Formula: see text] = 0.05). If the effect of clustering is limited to the intercept, the failure to accommodate clustering can result in a loss of statistical power to detect the overall experimental effect. This effect is most pronounced when both the magnitude of the experimental effect and the sample size are small (e.g., ~25 % less power given an experimental effect with effect size d of 0.20, and a sample size of 10 clusters and 5 observations per experimental condition per cluster).

Conclusions: When data is collected from a research design in which observations from the same cluster are obtained in different experimental conditions, multilevel analysis should be used to analyze the data. The use of multilevel analysis not only ensures correct statistical interpretation of the overall experimental effect, but also provides a valuable test of the generalizability of the experimental effect over (intrinsically) varying settings, and a means to reveal the cause of cluster-related variation in experimental effect.


Figures

Fig. 1
Fig. 1
Graphical illustration of nested data in research design A and B. In design A a, all observations in a cluster are subject to the same experimental condition. An example of this design is the comparison of WT and KO animals with respect to the number of docked vesicles within presynaptic boutons: bouton-measurements are typically clustered within neurons, and all measurements from the same neuron belong to the same experimental condition, i.e., have the same genotype. In this hypothetical example, we assume that a single neuron is sampled from each animal. If multiple neurons are sampled from the same animal, a third “mouse” level is added to the nested structure of the data. In research design B b, observations from the same cluster are subject to different experimental conditions. An example of this design is the comparison of neurite outgrowth in cells that are treated, or not (control), with growth factor (GF). Here, typically multiple observations from both treated and untreated neurons are obtained from, and so clustered within, the same animal
Fig. 2
Fig. 2
Graphical representations of variants of research design B data. Different possible combinations of cluster-related variation in the mean value of the control condition (i.e., the intercept; β0j) and cluster-related variation in the experimental effect (β1j), illustrated for 3 clusters of data: no cluster-related variation (a), only cluster-related variation in the intercept (b), only cluster-related variation in the experimental effect (c), or cluster-related variation in both the intercept and the experimental effect (d)
Fig. 3
Fig. 3
Use of conventional analysis methods on design B data can result in a loss of power. Using conventional analysis methods to model design B data that includes cluster-related variation in the intercept and no cluster-related variation in the experimental effect (σu02 >0 and σu12 = 0; study 1b) results in a loss of statistical power compared to using a multilevel model. The presented results are equal for the multilevel model that only includes variation in the intercept, and the multilevel model that includes variation in both the intercept and the experimental effect. Fitted conventional analysis methods were a a t test on individual observations and b a paired t test on the experimental condition specific cluster means. The loss in statistical power is overall greatest when both the number of clusters and effect size d are small and the cluster-related variation in the intercept is considerable. In case that the cluster-related variation in the intercept and in the experimental effect both equal zero (that is, ICC = σu12 = 0; study 1a), using a t test on individual observations is equally powerful as multilevel analysis, but using multilevel analysis is more powerful compared to a paired t test on summary statistics. The actual statistical power of multilevel analysis given σu12 = 0, = 0.20 or 0.50, N = 10, and increasing numbers of observations per experimental effect per cluster is given in Fig. 5b, solid line
Fig. 4
Fig. 4
Ignoring variation in the experimental effect results in inflated false positive (i.e., Type I error) rate. Inflation of the Type I error rate already occurs when a small amount of variation in the experimental effect (e.g., σu12 = 0.025) remains unaccounted for in the statistical model, and occurs both when the intercept (i.e., mean value of the control condition) is invariant over clusters (a; ICC = 0; study 2a), and when the intercept varies substantially over clusters (b; ICC = 0.50; study 2b). In panel a, the lines depicting conventional analysis (i.e., t test on individual observations) and misspecified multilevel analysis completely overlap. Using a paired t test on the experimental condition specific cluster means results in a correct Type I error rate. In panel b, the lines depicting the paired t test and the correctly specified multilevel analysis completely overlap
Fig. 5
Fig. 5
Power of multilevel analysis to detect the overall experimental effect in research design B. Power is depicted in nine conditions (effect size d of 0.20, 0.50, or 0.80, and cluster-related variation in the experimental effect of 0.00, 0.05, and 0.15) and as function of the number of clusters (a) or the number of observations per cluster per condition (b). In both a and b, two experimental conditions are compared, using a balanced research design. As the cluster-related variation in the intercept in research design B does not influence the statistical power to detect the overall experimental effect (see Eq. 8 in “Box 3”), the ICC does not feature in this figure. In a, the number of observations is held constant at 5 observations per condition in each cluster; in b, the number of clusters is held constant at 10. Evidently, the number of clusters, and not the number of observations per cluster, is essential to increase the statistical power to detect the experimental effect

References

    1. Aarts E, Verhage M, Veenvliet JV, Dolan CV, van der Sluis S. A solution to dependency: using multilevel analysis to accommodate nested data. Nat Neurosci. 2014;17:491–496. doi: 10.1038/nn.3648. - DOI - PubMed
    1. Lazic SE, Essioux L. Improving basic and translational science by accounting for litter-to-litter variation in animal models. BMC Neurosci. 2013;14:37. doi: 10.1186/1471-2202-14-37. - DOI - PMC - PubMed
    1. Lazic SE. The problem of pseudoreplication in neuroscientific studies: is it affecting your analysis? BMC Neurosci. 2010;11:5. doi: 10.1186/1471-2202-11-5. - DOI - PMC - PubMed
    1. Galbraith S, Daniel JA, Vissel B. A study of clustered data and approaches to its analysis. J Neurosci. 2010;30:10601–10608. doi: 10.1523/JNEUROSCI.0362-10.2010. - DOI - PMC - PubMed
    1. Zorrilla EP. Multiparous species present problems (and possibilities) to developmentalists. Dev Psychobiol. 1997;30:141–150. doi: 10.1002/(SICI)1098-2302(199703)30:2<141::AID-DEV5>3.0.CO;2-Q. - DOI - PubMed

Publication types

Substances

LinkOut - more resources