

The Costs of Participating in a Diabetes Quality Improvement Collaborative: Variation Among Five Clinics
- PMID: 26685930
- PMCID: PMC4861630
- DOI: 10.1016/s1553-7250(16)42002-7
The Costs of Participating in a Diabetes Quality Improvement Collaborative: Variation Among Five Clinics
Abstract
Background: Quality improvement collaboratives (QICs) support rapid testing and implementation of interventions through the collective experience of participating organizations to improve care quality and reduce costs. Although QICs have been societally cost-effective in improving the care of chronic diseases, they may not be adopted by outpatient clinics if their costs are high. Diabetes QICs warrant reexamination as secular trends in the quality of diabetes care, new care guidelines for diabetes, and evolving strategies for quality improvement may have altered implementation costs.
Methods: The costs over the first four years-from June 2009 through May 2013-of an ongoing diabetes QIC were characterized by activities and over time. The QIC, linking six clinics on Chicago's South Side, tailored interventions to minority populations and built community partnerships. Costs were calculated from clinic surveys regarding activities, labor, and purchases.
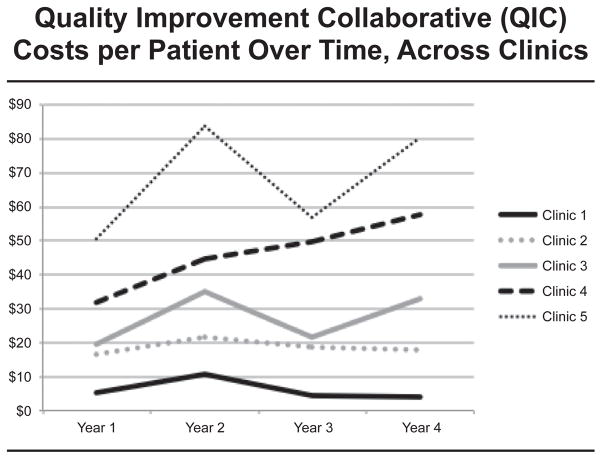
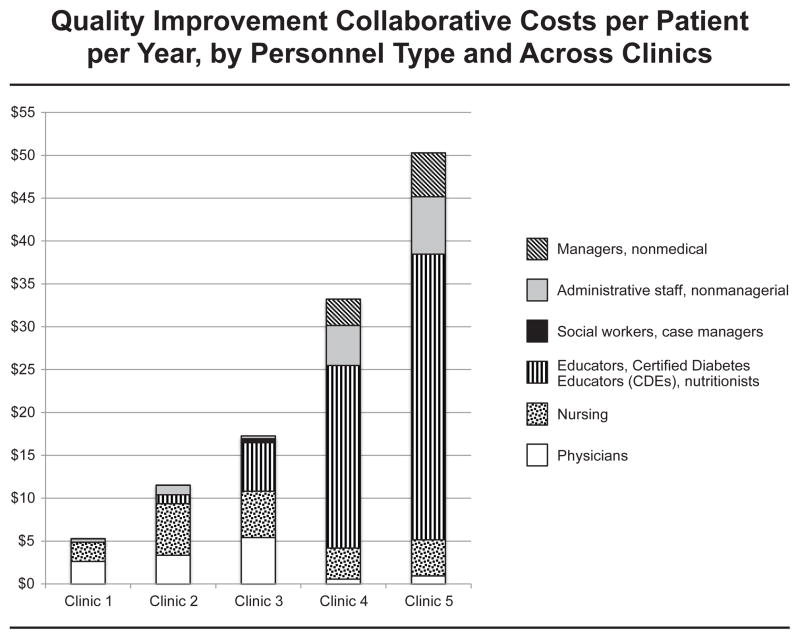
Results: Data were obtained from five of the six participating clinics. Cost/diabetic patient/year ranged across clinic sites from $6 (largest clinic) to $68 (smallest clinic). Clinics spent 62%-88% of their total QIC costs on labor. The cost/diabetic patient/year changed over time from Year 1 (range across clinics, $5-$51), Year 2 ($11-$84), Year 3 ($4-$57), to Year 4 ($4-$80), with costs peaking at Year 2 for all clinics except Clinic 4, where costs peaked at Year 4.
Discussion: Cost experiences of QICs in clinics were di- verse over time and setting. High per-patient costs may stem from small clinic size, a sicker patient population, and variation in personnel type used. Cost decreases over time may represent increasing organizational learning and efficiency. Sharing resources may have achieved additional cost savings. This practical information can help administrators and policy makers predict, manage, and support costs of QICs as payers increasingly seek high-value health care.
Figures

References
-
- US Department of Health and Human Services. [Accessed Nov 30, 2015];2011 Report to Congress: National Strategy for Quality Improvement in Health Care. 2011 Mar; http://www.ahrq.gov/workingforquality/nqs/nqs2011annlrpt.htm.
-
- Council of Economic Advisors. 2013 Economic Report of the President. Washington, DC: United States Government Printing Office; 2013. [Accessed Nov 30, 2015]. Reducing costs and improving the quality of health care; pp. 161–183. http://www.whitehouse.gov/sites/default/files/docs/erp2013/ERP2013_Chapt....
-
- Berwick DM, Nolan TW, Whittington J. The triple aim: Care, health, and cost. Health Aff (Millwood) 2008;27:759–769. - PubMed
-
- Bodenheimer T, Wagner EH, Grumbach K. Improving primary care for patients with chronic illness. JAMA. 2002 Oct 9;288:1775–1779. - PubMed
Publication types
MeSH terms
Grants and funding
- T32 HS000084/HS/AHRQ HHS/United States
- K24 DK10534/DK/NIDDK NIH HHS/United States
- R18 DK083946/DK/NIDDK NIH HHS/United States
- DK083946-01A1/DK/NIDDK NIH HHS/United States
- P60 DK20595/DK/NIDDK NIH HHS/United States
- K24 DK071933/DK/NIDDK NIH HHS/United States
- K24 DK105340/DK/NIDDK NIH HHS/United States
- 2-T35 D062719-26/PHS HHS/United States
- P30 DK092949/DK/NIDDK NIH HHS/United States
- T35 DK062719/DK/NIDDK NIH HHS/United States
- 5-T35 DK062719-24/DK/NIDDK NIH HHS/United States
- P30 DK020595/DK/NIDDK NIH HHS/United States
- P60 DK020595/DK/NIDDK NIH HHS/United States
LinkOut - more resources
Full Text Sources
Other Literature Sources
Medical
