. 2016 Feb 1:101:40-53.
doi: 10.1016/j.bcp.2015.12.007. Epub 2015 Dec 11.

Drug-protein hydrogen bonds govern the inhibition of the ATP hydrolysis of the multidrug transporter P-glycoprotein

Affiliations

Drug-protein hydrogen bonds govern the inhibition of the ATP hydrolysis of the multidrug transporter P-glycoprotein

Eduardo E Chufan et al. Biochem Pharmacol. .

Abstract

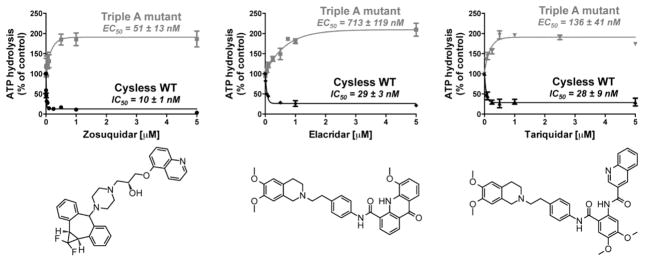
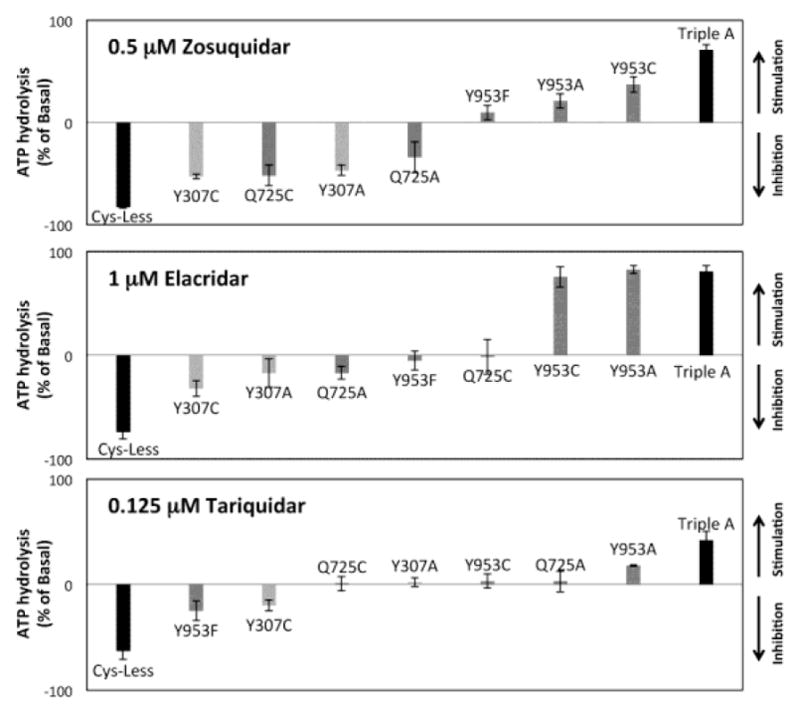
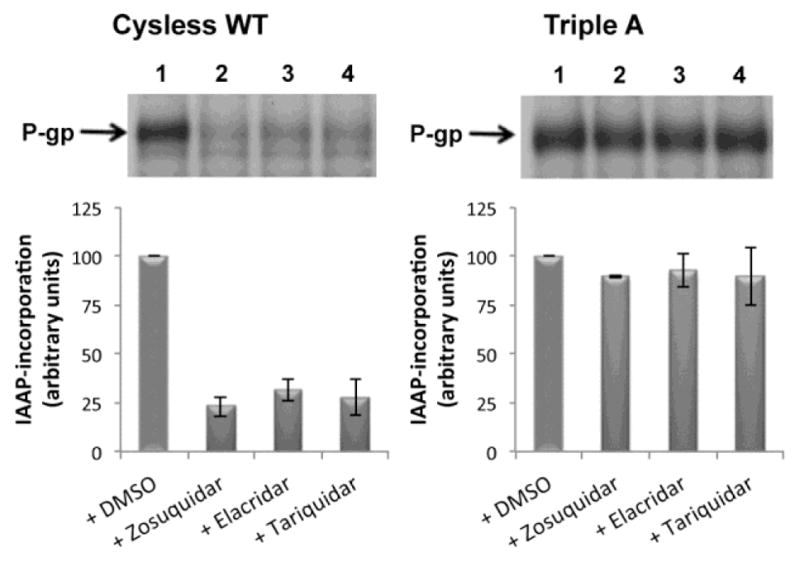
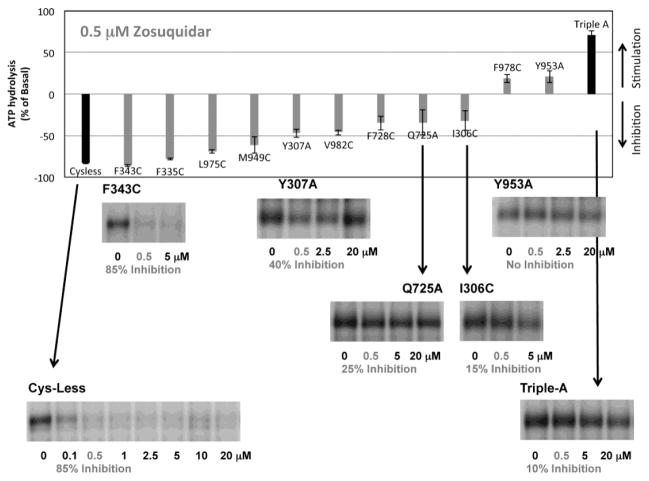
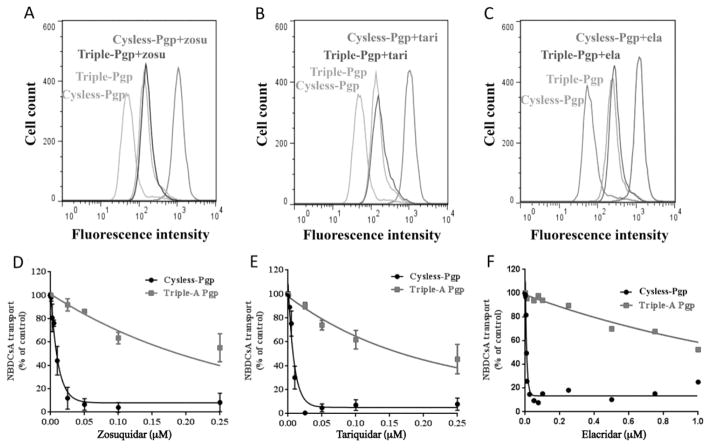
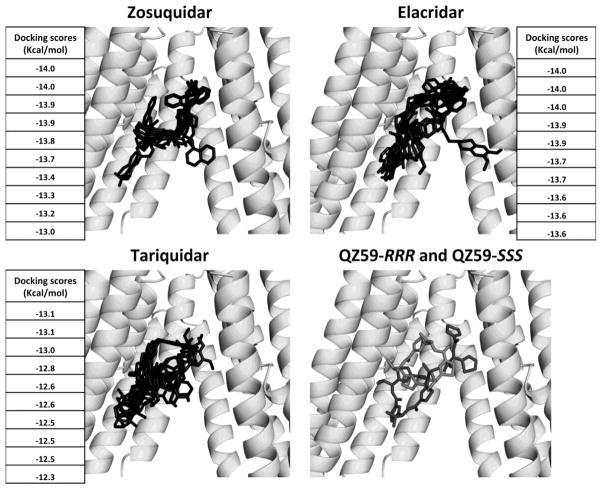
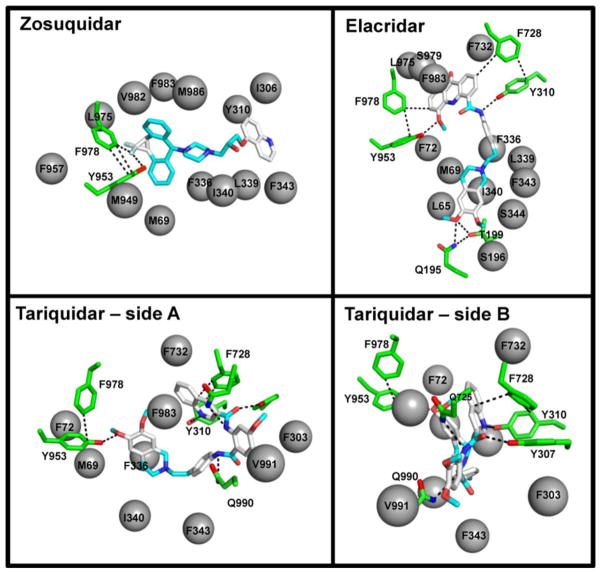
P-glycoprotein (P-gp) is a member of the ATP-binding cassette transporter superfamily. This multidrug transporter utilizes energy from ATP hydrolysis for the efflux of a variety of hydrophobic and amphipathic compounds including anticancer drugs. Most of the substrates and modulators of P-gp stimulate its basal ATPase activity, although some inhibit it. The molecular mechanisms that are in play in either case are unknown. In this report, mutagenesis and molecular modeling studies of P-gp led to the identification of a pair of phenylalanine-tyrosine structural motifs in the transmembrane region that mediate the inhibition of ATP hydrolysis by certain drugs (zosuquidar, elacridar and tariquidar), with high affinity (IC50's ranging from 10 to 30nM). Upon mutation of any of these residues, drugs that inhibit the ATPase activity of P-gp switch to stimulation of the activity. Molecular modeling revealed that the phenylalanine residues F978 and F728 interact with tyrosine residues Y953 and Y310, respectively, in an edge-to-face conformation, which orients the tyrosines in such a way that they establish hydrogen-bond contacts with the inhibitor. Biochemical investigations along with transport studies in intact cells showed that the inhibitors bind at a high affinity site to produce inhibition of ATP hydrolysis and transport function. Upon mutation, they bind at lower affinity sites, stimulating ATP hydrolysis and only poorly inhibiting transport. These results also reveal that screening chemical compounds for their ability to inhibit the basal ATP hydrolysis can be a reliable tool to identify modulators with high affinity for P-gp.

Keywords: ABC transporter; Calcein-AM (PubChem CID: 4126474); Cyclosporine A (PubChem CID: 5284373); Daunorubicin (PubChem CID: 30323); Drug-binding site; Elacridar (PubChem CID: 119373); Modulators; Multidrug resistance; Nilotinib (PubChem CID: 644241); Rhodamine 123 (PubChem CID: 65217); Structural motifs; Tariquidar (PubChem CID: 148201); Valinomycin (PubChem CID: 5649); Verapamil (PubChem CID: 62969); Zosuquidar (PubChem CID: 153997).


Conflict of interest statement

Conflicts of interest

The authors declare no conflicts of interest.

Figures

Figure 1
Figure 1. The affinity (Km) for ATP is not significantly affected upon binding of zosuquidar or elacridar to P-gp
The Pgp-mediated ATP hydrolysis was measured in crude membranes of insect cells as described in Materials and methods. The figure compares the kinetic behavior of cysless WT P-gp (a) in the absence (top curve) and in the presence of different concentrations of zosuquidar (15 nM, 25 nM and 60 nM, from top to bottom); and (b) in the absence (top curve) and in the presence of elacridar (50 nM, 100 nM and 500 nM, from top to bottom). The data points were fit with the Michaelis-Menten equation, using Prism version 6.01, and the error bars denote the standard deviations. The values of Km for ATP are given in the figure.
Figure 2
Figure 2. Drug-mediated inhibition switches to stimulation upon mutation of polar residues of the drug-binding pocket of P-gp
At least three independent experiments, each with duplicate samples, were carried out for both cysless WT and the Triple A mutant with indicated compounds, and error bars represent the standard deviations. The data points were fit with a one-phase decay equation, using Prism version 6.01. Basal activity was taken as 100% activity, and activities lower than 100% indicate inhibition while activities higher than 100% demonstrate stimulation. In all panels, black curves represent cysless WT and grey curves Triple A (Y307A/Q725A/Y953A) mutant P-gp. The IC50 (inhibition) and EC50 (stimulation) values are given in the figure. The chemical structure of the compounds is shown below the graphs. Zosuquidar exhibits the particular difluorcyclopropane group appended to a cycloheptane ring, while elacridar and tariquidar have the dimethoxy-isoquinolinyl-ethylphenyl-aminocarbonyl moiety in common.
Figure 3
Figure 3. Mutation at the residue Y953 dominates the switch effect (inhibition to stimulation) on ATP hydrolysis of Triple A (Y307A/Q725A/Y953A) mutant P-gp, by zosuquidar and elacridar
Mutations of the polar residues Y307, Q725 and Y953 to alanine, cysteine and phenylalanine (Y953F only) were tested for their effect on the modulation of basal ATPase activity of P-gp by drugs. Vanadate-sensitive P-gp-mediated ATP hydrolysis was measured as described in Materials and methods. Basal activity of cysless WT and mutant P-gps was taken as zero, inhibition was calculated as percentage of the basal activity and shown with downward bars (negative values), while stimulation was calculated as percentage of the basal activity and shown with upward bars (positive values). Bars are colored black for cysless WT or triple A (Y307A/Q725A/Y953A) while they are grey for the single mutants (Y307A/C, Q725A/C, Y953A/C/F). At least three experiments were carried out with duplicate samples for each mutant with indicated compounds, and errors bars denote the standard deviations. Additional data on the modulatory effect at different drug concentrations is given in Table 2–4.
Figure 4
Figure 4. Substitution of selected phenylalanine residues with cysteine also produces the switch effect (from inhibition to stimulation)
Substitution of phenylalanine and other non-polar residues of the drug-binding pocket of P-gp to cysteine were tested for their effect on the modulation of basal ATPase activity by zosuquidar (0.5 μM), elacridar (1 μM) and tariquidar (0.125 μM). Basal activity of the mutants was taken as zero, inhibition was calculated as a percentage of the basal activity and shown with downward bars (negative values), while stimulation was calculated as a percentage of the basal activity and shown with upward bars (positive values). Error bars denote standard deviation (n >3). Additional data on the modulatory effect at different drug concentrations is given in Tables 2–4.
Figure 5
Figure 5. Effect of drugs on the photo-crosslinking of cysless WT and triple A (Y307A/Q725A/Y953A) mutant P-gp with IAAP
Crude membranes expressing cysless WT or mutant P-gp (60–80 μg protein) were treated with the indicated concentrations of drug in 100 μL buffer containing 50 mM MES-Tris pH 6.8 for 10 min at 37°C. Samples were then photo-crosslinked with 4–6 nM IAAP at 4°C as described in Materials and methods. IAAP-labeling of the cysless WT and Triple A mutant P-gp with no addition of drug was taken as 100% labeling. Both panels show a representative autoradiogram (at the top) and the quantification of the IAAP-labeling (at the bottom). Lane 1, control (DMSO solvent); 2, 1 μM zosuquidar; 3, 1 μM elacridar; and 4, 1 μDM tariquidar. Data represent the mean ± the standard deviations for n=3. Left panel, cysless WT; right panel, Triple A (Y307A/Q725A/Y953A) mutant.
Figure 6
Figure 6. Correlation of effects of zosuquidar on ATPase activity and IAAP-labeling of cysless WT and mutant P-gps
In the upper panel of the figure is shown the modulation of the basal ATPase activity of mutant P-gps by 0.5 μM zosuquidar. Basal activity of the mutants was taken as zero, and inhibition or stimulation was calculated as percentage of the basal activity. The inhibition is shown with downward bars (negative values), while the stimulation is shown as upward bars (positive values). Vanadate-sensitive Pgp-mediated ATP hydrolysis was measured as described in Materials and methods. In the lower panel of the figure is shown the effect of zosuquidar (at different concentrations) on the photo-crosslinking of mutant P-gps with IAAP. Representative autoradiograms are shown. Photo-crosslinking experiments were carried out as described in the legend of Figure 5. The percentage of inhibition with 0.5 μM zosuquidar (grey font) is given at the bottom of each autoradiogram.
Figure 7
Figure 7. Triple A (Y307A/Q725A/Y953A) mutant P-gp BacMam baculovirus-transduced HeLa cells exhibit normal cell surface expression but aberrant transport function for various substrates
(A) Triple-A mutant P-gp virus-transduced cells (250,000) were incubated with monoclonal antibody MRK-16 (1 μg/100,000 cells) for 60 min at 37°C followed by incubation with FITC-conjugated anti-mouse IgG2a secondary antibody. The cell surface localization was detected with the green fluorescence detector. The dark grey histogram represents the cell surface expression of cysless WT and is taken as 100 % (Table 5). The light grey trace marks the cell surface levels of the Triple A mutant P-gp. The black trace depicts labeling with the IgG2a isotype control. (B) Triple A mutant virus-transduced HeLa cells were incubated with conformation-sensitive UIC2 antibody (2 μg/100,000 cells) in the absence and presence of 20 μM CsA, for 30 min at 37°C followed by incubation with FITC-conjugated anti-mouse IgG2a secondary antibody. The histogram represents detection with UIC2 for cysless WT when carried out both in the absence (trace with *) and presence of 20 μM CsA (trace with #), while the traces that represent the cell surface levels for Triple A mutant in the absence and presence of 20 μM CsA overlap each other (traces with ^). (C) Western Blot shows the levels of total P-gp in the HeLa cell lysates transduced with cysless WT or Triple A mutant P-gp. Cell lysates (3.5 μg protein/lane) were run on a 7% Tris-acetate gel and the immunoblot was developed with C219 antibody. The arrow and arrowhead show the position of mature and immature P-gp bands, respectively. (D, E) Typical histograms show transport function of Triple A mutant using JC-1 and NBDCsA fluorescent substrates. The inactive EQ (E556Q/E1201Q) mutant P-gp was used to determine total accumulation (no efflux). The figure shows typical histograms from one representative experiment, which was done independently at least three times.
Figure 8
Figure 8. Triple A (Y307A/Q725A/Y953A) mutant P-gp displays decreased reversal of transport function by zosuquidar, tariquidar and elacridar
The upper panels (A–C) show histograms for the accumulation of NBDCsA by the cysless WT and triple A (Y307A/Q725A/Y953A) mutant P-gps. The histograms also show that NBDCsA transport by triple A mutant (brown curves) is not reversed by the presence of 50 nM zosuquidar (A), 50 nM tariquidar (B) or 50 nM elacridar (C), while these compounds at 50 nM completely reverse transport by cysless WT P-gp (curves with maximum fluorescence intensity). The lower panels (D–F) show the reversal of NBDCsA efflux by zosuquidar, tariquidar and elacridar at various concentrations. The transport of NBDCsA in the absence of any inhibitor was taken as 100% for both cysless WT and the Triple A mutant, respectively, and the extent of transport in the presence of the given concentration of an inhibitor was calculated with respect to it. Data points were plotted as the mean + SD (n=3) using GraphPad Prism 6.0. The IC50 values are reported in Table 6.
Figure 9
Figure 9. Y953A mutant P-gp displays significantly decreased reversal of transport function by zosuquidar, tariquidar and elacridar
The upper panels (A–C) show the histograms for the transport of NBDCsA by the cysless WT and Y953A mutant P-gps. The histograms also show the effect of 50 nM zosuquidar (A), 50 nM tariquidar (B) or 50 nM elacridar (C) on reversal of NBDCsA transport by Y953A mutant P-gp, and by cysless WT P-gp (traces with maximum fluorescence intensity). The lower panels (D–F) show the effect of zosuquidar, tariquidar and elacridar at indicated concentrations on reversal of NBDCsA transport by cysless WT and Y953A mutant P-gp. The transport of NBDCsA in the absence of any inhibitor was taken as 100% for both cysless WT and Y953A mutant, respectively, and the percent of transport in the presence of the different inhibitors was calculated with respect to it. Data points are plotted as the mean + SD (n=3). The values of IC50 (compound concentration that produces 50% inhibition of NBDCsA transport in HeLA cells expressing cysless WT or Y953A mutant P-gp) are given in the figure. The IC50 value of zosuquidar could not be calculated, as a maximum 20% inhibition was observed at the highest concentration. The data was plotted and IC50 values calculated using GraphPad Prism 6.0.
Figure 10
Figure 10. Docking of zosuquidar, elacridar and tariquidar in the binding pocket of human Pgp
Exhaustive ligand docking in the homology model of human Pgp based on mouse P-gp structure 4M2T.pdb [3] was carried out using a receptor grid centered at the position of the QZ59-RRR molecule (shown as light grey sticks in the right lower panel), with flexible side-chains covering an ample space (see Materials and methods for the list of residues selected to be treated as flexible) and a search box of dimensions 40Å × 35Å × 35Å. The first 10 modes with the highest docking scores (Kcal/mol, given in the figure) were clustered and shown as black sticks model in the corresponding panels. The original positions of QZ59-RRR (light grey) and QZ59-SSS (dark grey) molecules are shown in the right lower panel as stick models, using the original coordinates from crystal structure 4M2S/4M2T.pdb, respectively. Helices 4 and 5 are not shown for clarity. The figure was prepared with PyMOL 1.5.
Figure 11
Figure 11. Tyrosine-phenylalanine structural motifs in the drug-binding pocket of human P-gp are critical for interaction with zosuquidar, elacridar and tariquidar
Zosuquidar, elacridar and tariquidar were docked in the central cavity of the homology model of human P-gp based on the improved mouse P-gp X-ray structure (4M2T.pdb, [3]). The panels show selected poses that match the experimental data. For zosuquidar, Y953 is H-bonded to a fluorine group of the drug and F978 is in T-shape aromaticaromatic contact [34] with Y953. For elacridar, Y953 and Y310 are H-bonded to the drug with F978 and F728 in T-shape aromatic-aromatic interaction with the Y953 and Y310 residues, respectively. For tariquidar, side A shows the Y953-F978 structural motif with Y953 H-bonded to the drug and side B shows the Y310-F728 structural motif with Y310 H-bonded to the drug. Side B also shows Q725 and Y307 H-bonded to tariquidar. Zosuquidar, elacridar, tariquidar and selected residues are shown in stick models, the rest of the surrounded residues are shown as grey balls at the position of the α-carbon. Color code: C(residues)=green; C(drug-aliphatic)=cyan; C(drug-aromatic)=white; O=red; N=blue and F=light blue. H-bonds and aromatic-aromatic interactions are indicated as dashed lines. The figures were prepared with PyMOL 1.5.

References

    1. Ambudkar SV, Dey S, Hrycyna CA, Ramachandra M, Pastan I, Gottesman MM. Biochemical, cellular, and pharmacological aspects of the multidrug transporter. Annual Review of Pharmacology and Toxicology. 1999;39:361–98. - PubMed
    1. Chufan EE, Sim HM, Ambudkar SV. Molecular Basis of the Polyspecificity of P-Glycoprotein (ABCB1): Recent Biochemical and Structural Studies. Adv Cancer Res. 2015;125:71–96. - PMC - PubMed
    1. Li JZ, Jaimes KF, Aller SG. Refined structures of mouse P-glycoprotein. Protein Science. 2014;23:34–46. - PMC - PubMed
    1. Jin MS, Oldham ML, Zhang QJ, Chen J. Crystal structure of the multidrug transporter P-glycoprotein from Caenorhabditis elegans. Nature. 2012;490:566. - PMC - PubMed
    1. Szewczyk P, Tao H, McGrath AP, Villaluz M, Rees SD, Lee SC, et al. Snapshots of ligand entry, malleable binding and induced helical movement in P-glycoprotein. Acta Crystallogr D Biol Crystallogr. 2015;71:732–41. - PMC - PubMed

Publication types

MeSH terms