. 2015 Dec 17;163(7):1716-29.
doi: 10.1016/j.cell.2015.11.045. Epub 2015 Dec 10.

Limiting Cholesterol Biosynthetic Flux Spontaneously Engages Type I IFN Signaling

Affiliations

Limiting Cholesterol Biosynthetic Flux Spontaneously Engages Type I IFN Signaling

Autumn G York et al. Cell. .

Abstract

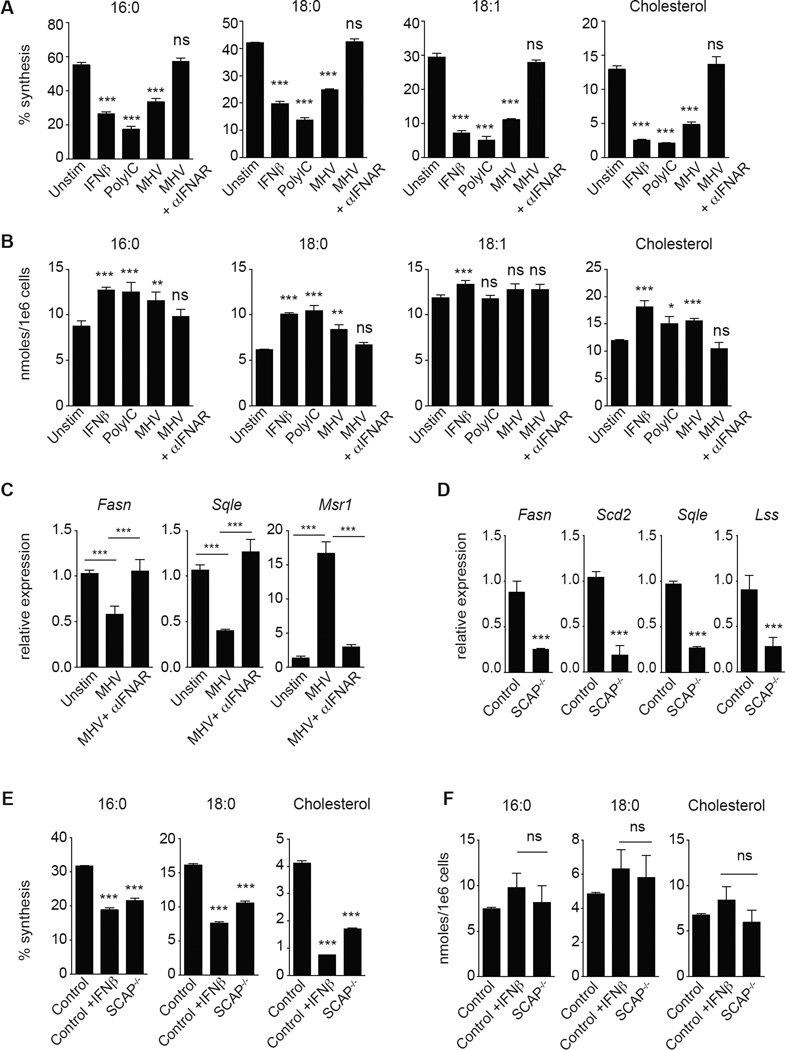
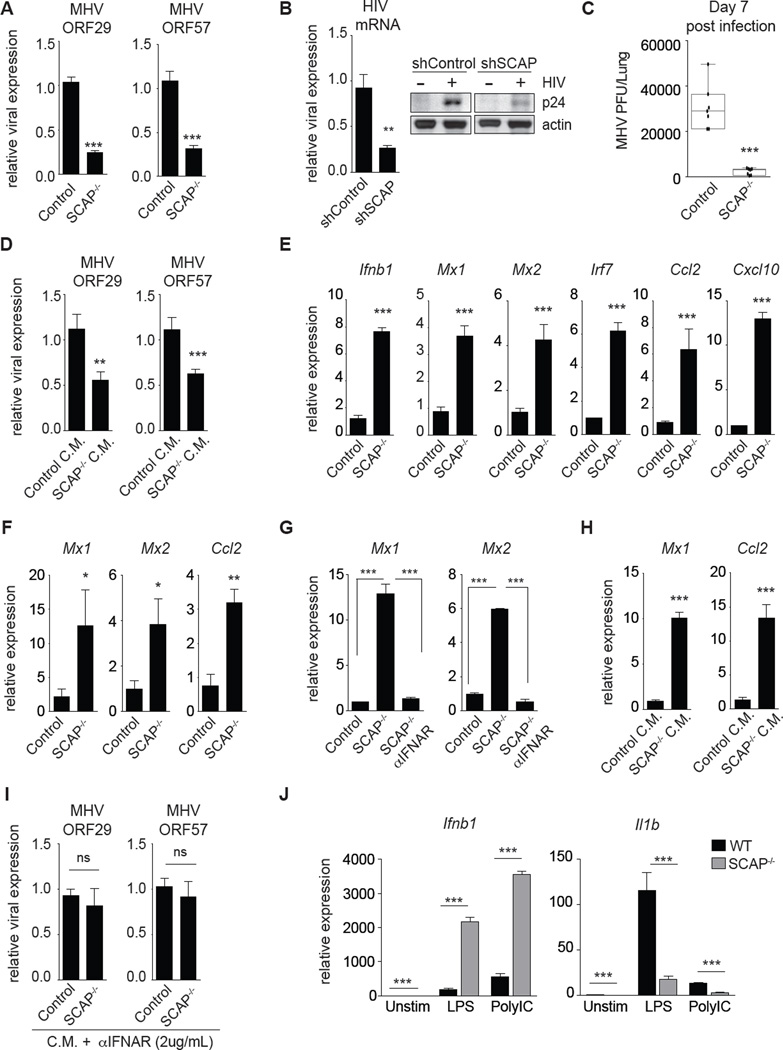
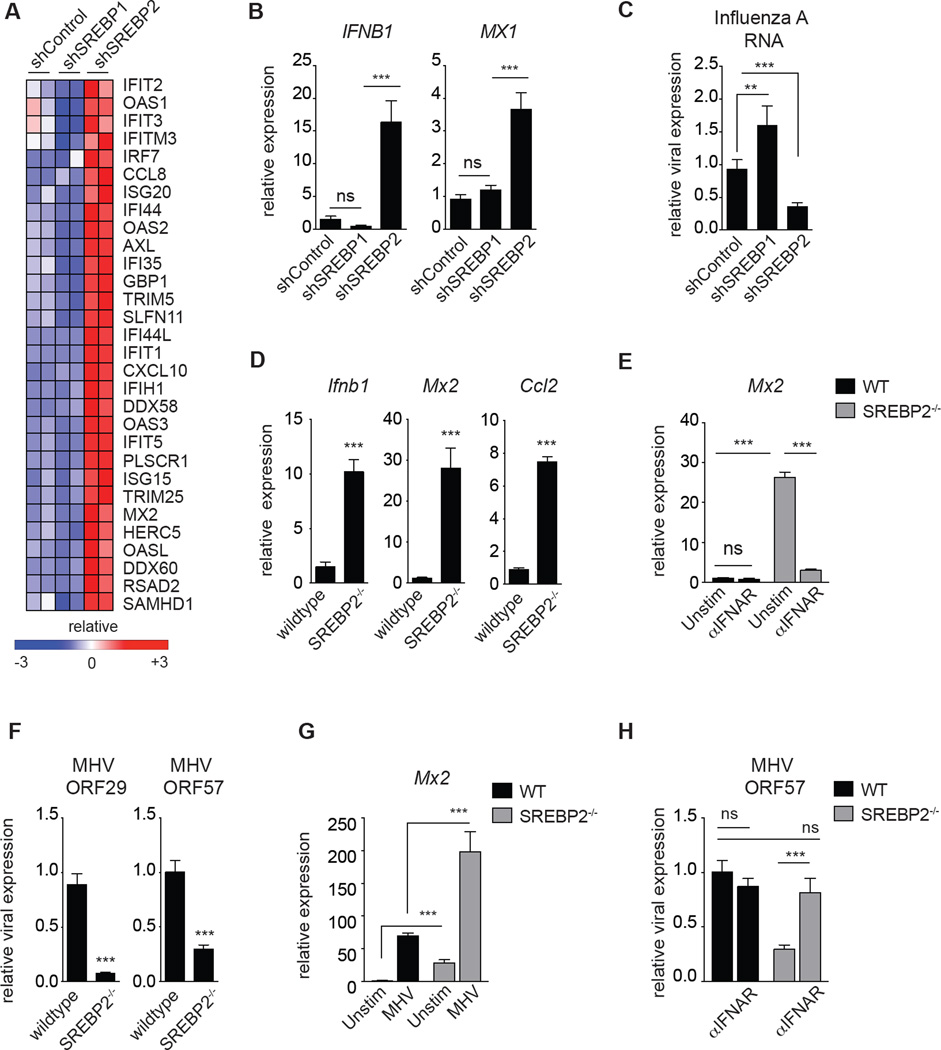
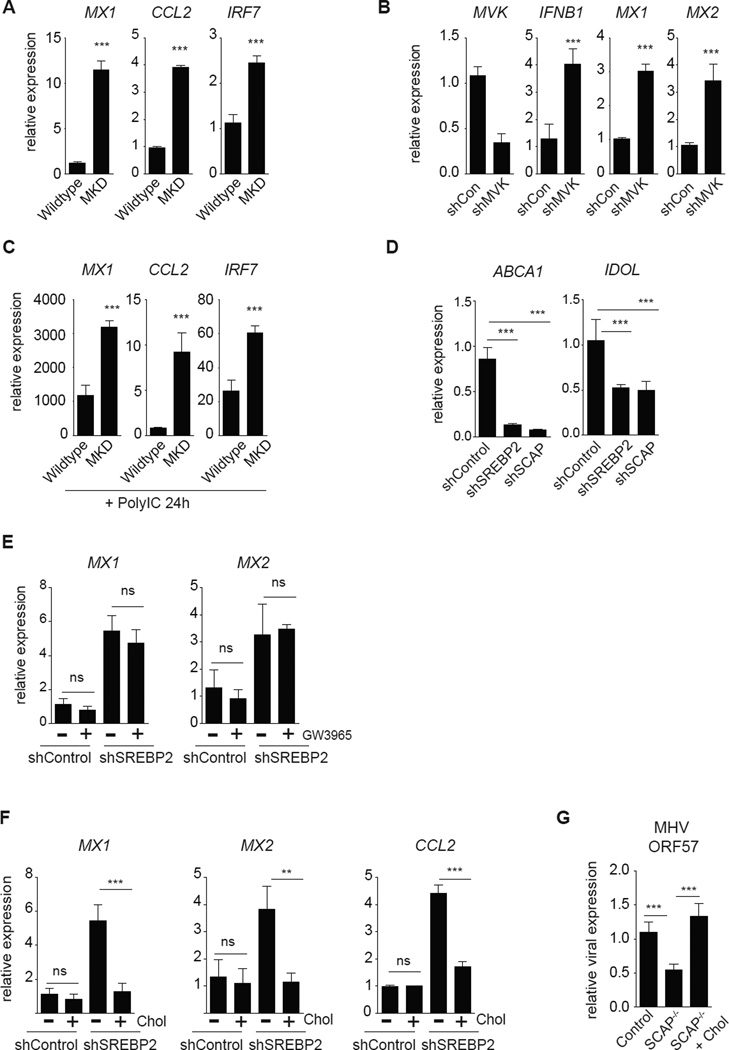
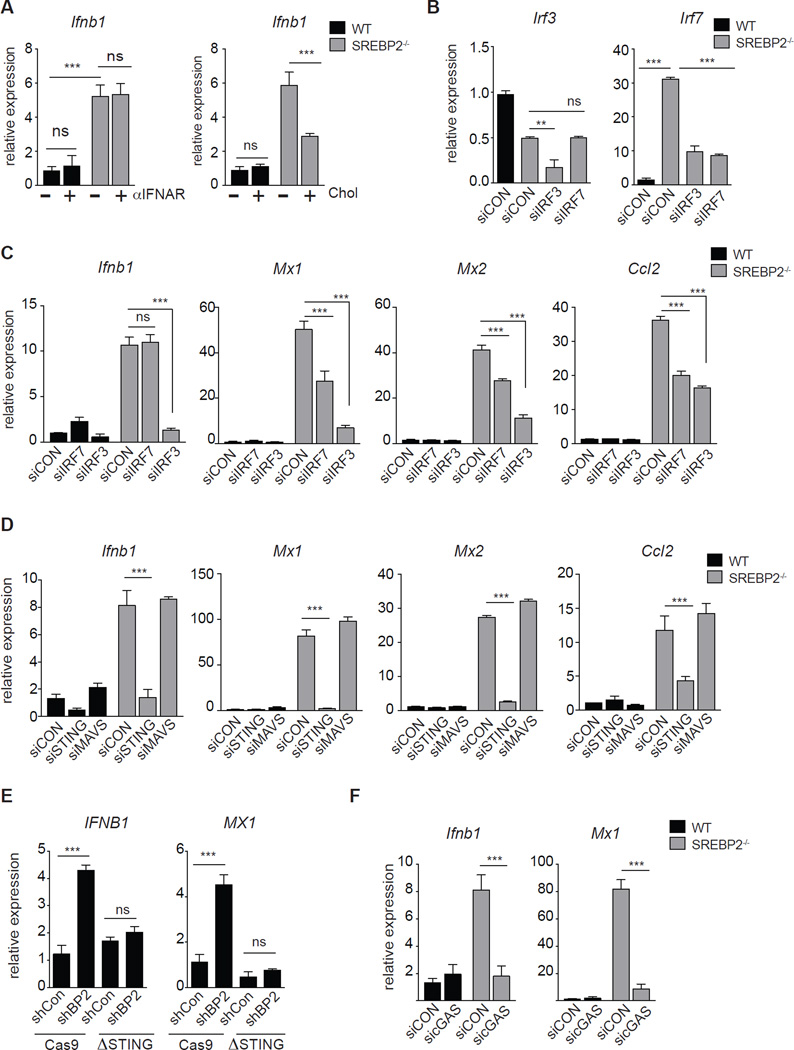
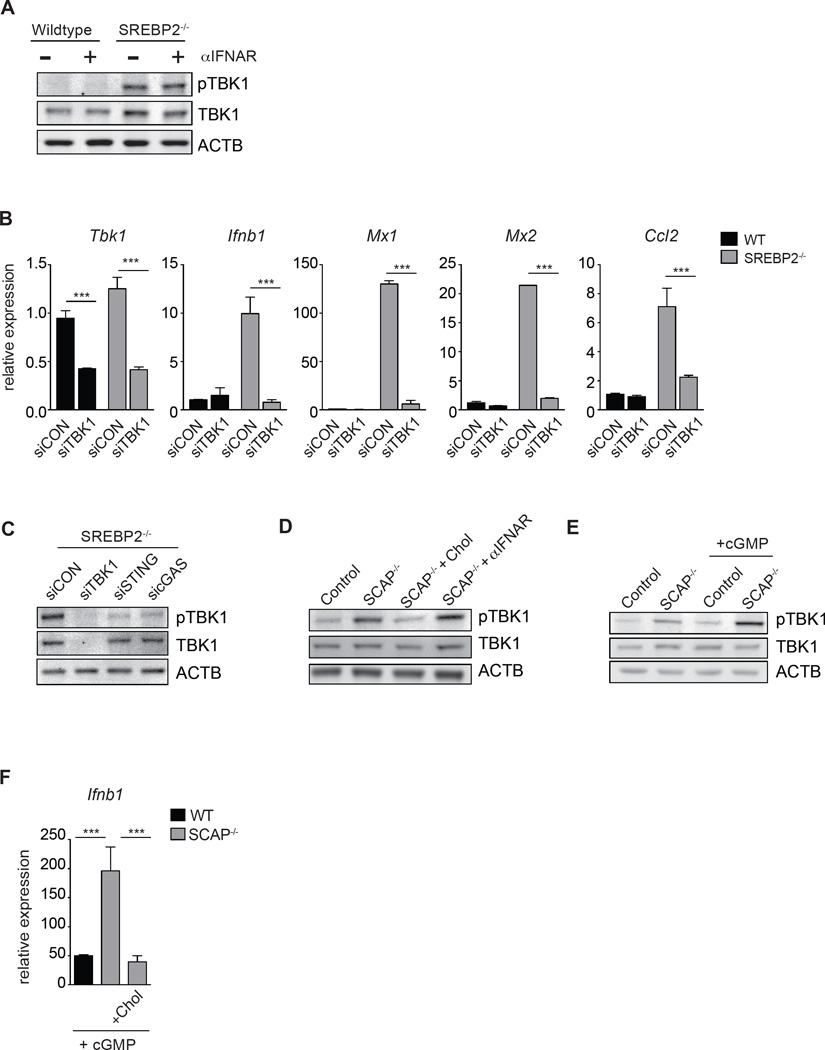
Cellular lipid requirements are achieved through a combination of biosynthesis and import programs. Using isotope tracer analysis, we show that type I interferon (IFN) signaling shifts the balance of these programs by decreasing synthesis and increasing import of cholesterol and long chain fatty acids. Genetically enforcing this metabolic shift in macrophages is sufficient to render mice resistant to viral challenge, demonstrating the importance of reprogramming the balance of these two metabolic pathways in vivo. Unexpectedly, mechanistic studies reveal that limiting flux through the cholesterol biosynthetic pathway spontaneously engages a type I IFN response in a STING-dependent manner. The upregulation of type I IFNs was traced to a decrease in the pool size of synthesized cholesterol and could be inhibited by replenishing cells with free cholesterol. Taken together, these studies delineate a metabolic-inflammatory circuit that links perturbations in cholesterol biosynthesis with activation of innate immunity.


Figures

Figure 1
Figure 1. Type I interferon signaling shifts the balance of lipid synthesis and import
(A) Percent synthesis of palmitic acid (16:0), stearic acid (18:0), oleic acid (18:1) and cholesterol as measured by Isotopic Spectral Analysis (ISA) on C75BL/6 BMDMs with or without interferonβ (1000U/mL IFNβ), Poly:IC (2ug/mL) or MHV-68 (MOI=0.5) +/− 10ug/mL IFNAR neutralizing antibody for 48h. (B) Total cellular palmitic acid (16:0), stearic acid (18:0), oleic acid (18:1) and cholesterol from BMDMs stimulated as in (A). (C) qPCR analysis of Fasn, Sqle, and Msr1 gene expression in BMDMs infected with MHV-68 (MOI=0.5) +/− 10ug/mL IFNAR neutralizing antibody for 48h. (D) qPCR analysis of indicated lipid synthesis genes in quiescent LysM Cre+/− control (designated Control) or LysM Cre+/− SCAPfl/fl (SCAP−/−). (E) Percent synthesis of palmitic acid (16:0), stearic acid (18:0) and cholesterol as measured by ISA of Control or SCAP−/− BMDMs unstimulated or stimulated with IFNβ as above for 24h. (F) Total cellular palmitic acid (16:0), stearic acid (18:0) and cholesterol from Control or SCAP−/− BMDMs unstimulated or stimulated with IFNβ as above for 24h. All mass spec and gene expression experiments are expressed as means ± SD from three independent experiments. *P < 0.05; **P < 0.01, ***P < 0.005 (two-tailed unpaired Student’s t test). See also Figures S1 and S2.
Figure 2
Figure 2. Genetic inhibition of the lipid biosynthetic program primes antiviral immunity
(A) qPCR analysis of murine gammaherpesvirus-68 (MHV-68) genes in Control or SCAP−/− BMDMs infected with MHV-68 (MOI=0.5) for 48h. (B) qPCR analysis of HIV-1 mRNA (left) and representative immunoblots of HIV-1 p24 protein levels (right) from shControl or shSCAP THP1 macrophages 96h after infection. (C) MHV-68 titers from the lungs of LysM Cre+/− control (Control) or LysM Cre+/− SCAPfl/fl (SCAP−/−) mice on d.7 post intranasal infection (N=7; data shown is the combined results from two separate infection experiments of n=3 per group and n=4 per group). (D) qPCR analysis of indicated MHV-68 genes in WT BMDMs pretreated for 4h with Control or SCAP−/− conditioned media (C.M.) before MHV-68 infection (MOI=0.5) for 48h. C.M. from Control or SCAP−/− BMDMs was collected on d.7 post-differentiation. (E) qPCR analysis of Ifnb1 and representative interferon stimulated genes (ISGs) in unstimulated control or SCAP−/− BMDMs on d.8 of differentiation. (F) qPCR analysis of ISGs in ex vivo alveolar macrophage isolated from bronchoalveolar lavage from LysM Cre+/− control (Control) or LysM Cre+/− SCAPfl/fl (SCAP−/−) (3 mice/group). (G) qPCR analysis of indicated ISGs in unstimulated control or SCAP−/− BMDMs on d.9 of differentiation +/− 5ug/mL IFNAR blocking antibody for last 48h. (H) qPCR analysis of ISGs in WT BMDMs treated for 4h with Control or SCAP−/− conditioned media (C.M.). (I) MHV-68 ORF29 and ORF57 gene expression in WT BMDMs pretreated for 4h with Control or SCAP−/− conditioned media (CM) + 2ug/mL IFNAR blocking antibody before MHV-68 infection (MOI=0.5) for 48h. (J) qPCR analysis of Ifnb1 and Il1b expression in Control or SCAP−/− BMDMs unstimulated or stimulated with LPS (50ng/mL) or Poly:IC (1ug/mL) for 1h on d.8 of differentiation. All experiments are reported as means ± SD from three independent experiments, unless noted otherwise. *P < 0.05; **P < 0.01, ***P < 0.005 (two-tailed unpaired Student’s t test). See also Figure S3.
Figure 3
Figure 3. Inhibiting the SREBP2 transcriptional pathway engages a type I IFN inflammatory response
(A) RNA-seq data from unstimulated shControl, shSREBP1 and shSREBP2 THP1 cells 72 h after PMA-differentiation into macrophages. Data shown are biologic replicates of each genotype. (B) qPCR analysis of IFNB1 and MX1 in unstimulated shControl, shSREBP1 and shSREBP2 primary PBMC-derived human macrophages. (C) qPCR analysis of Influenza A RNA from shControl, shSREBP1 or shSREBP2 THP1 cells 72h post infection. (D) qPCR analysis of Ifnb1 and indicated ISGs expression in WT control or SREBP2−/− MEFs cultured in DMEM containing 1% FBS for 24h. (E) qPCR analysis of Mx2 expression in WT or SREBP2−/− MEFs cultured in 1% FBS for 24h +/− 5ug/mL IFNAR blocking antibody as indicated (F) qPCR analysis of indicated MHV-68 gene expression in WT or SREBP2−/− MEFs infected with MHV-68 (MOI=1.0) for 24h. (G) qPCR analysis of Mx2 in WT or SREBP2−/− MEFs +/− MHV infection (MOI=1.0) for 24h. (H) qPCR analysis of MHV-68 ORF57 expression in WT or SREBP2−/− MEFs infected with MHV-68 (MOI=1.0) for 24h +/− 24h pretreatment with 5ug/mL IFNAR blocking antibody. All experiments are reported as means ± SD from three independent experiments. *P < 0.05; **P < 0.01, ***P < 0.005 (two-tailed unpaired Student’s t test). See also Figure S4.
Figure 4
Figure 4. Limiting flux throught the cholesterol biosynthetic pathway engages a type I IFN response
(A) qPCR analysis of ISG expression in population control (Wildtype) primary human fibroblasts or fibroblasts from an individual with MVK-deficiency (MKD; ~2% MVK activity compared to population controls). (B) qPCR analysis of MVK, IFNB1 and ISG expression in shControl or shMVK THP1 cells after 72h of PMA-differentiation (C) qPCR analysis of ISG expression in population control (Wildtype) primary human fibroblasts or fibroblasts from an individual with MVK-deficiency (MKD) primed with 2ug/mL Poly:IC for 24h. (D) qPCR analysis of ABCA1 and IDOL expression in shControl, shSREBP2 and shSCAP THP1 macrophages differentiated for 72h. (E) qPCR analysis of indicated ISG expression in THP1 shControl or shSREBP2 cells differentiated as above and stimulated with vehicle (DMSO) or LXR ligand (1uM GW3965) for 72h. (F) qPCR analysis of indicated ISG expression of differentiated THP1 shControl or shSREBP2 macrophages in media supplemented with 0.1mg/mL methyl beta cyclodextrin (MβCD)-cholesterol (“Chol”) as indicated for 72h. G. qPCR analysis of MHV-68 ORF57 expression in Control or SCAP−/− BMDMs +/− 0.25mg/mL MβCD-cholesterol (Chol) for 48h, then infected with MHV-68 (MOI=0.5) for 24h. All experiments are reported as means ± SD from three independent experiments. *P < 0.05; **P < 0.01, ***P < 0.005 (two-tailed unpaired Student’s t test). See also Figure S5.
Figure 5
Figure 5. IRF3/STING link changes in cholesterol biosynthesis with type I IFN production
(A) Left: qPCR analysis of Ifnb1 in WT or SREBP2−/− MEFs cultured in 1% FBS for 24h +/− 5ug/mL IFNAR blocking antibody as indicated. Right: qPCR analysis of Ifnb1 in WT and SREBP2−/− MEFs treated 0.075mg/mL MβCD-cholesterol (Chol) as indicated for 72h. (B) qPCR analysis of Irf3 and Irf7 in WT or SREBP2−/− MEFs transfected with control siRNA, siIRF3 or siIRF7 (C) qPCR analysis of Ifnb1, Mx1, Mx2 and Ccl2 in WT or SREBP2−/− MEFs transfected with control siRNA, siIRF3 or siIRF7 (D) qPCR analysis of Ifnb1, Mx1, Mx2 and Ccl2 in WT or SREBP2−/− MEFs transfected with control siRNA, siMAVS or siSTING as indicated (E) qPCR of IFNB1 and MX1 gene expression from control (Cas9) or CRISPR/Cas9-edited STING (ΔSTING) THP1 cells stably transduced with shControl or shSREBP2. (F) qPCR analysis of Ifnb1 and Mx1 in WT or SREBP2−/− MEFs transfected with control siRNA or siRNA to cGAS. All experiments are reported as means ± SD from three independent experiments. *P < 0.05; **P < 0.01, ***P < 0.005 (two-tailed unpaired Student’s t test). See also Figure S6.
Figure 6
Figure 6. Perturbations in cholesterol homeostasis alters STING sensitivity to di-cyclic nucleotides
(A) Western blot analysis of phospho-TBK1 (pTBK1) and total TBK1 from whole cell lysates in WT or SREBP2−/− MEFs cultured in 1% FBS for 24h +/− 5ug/mL IFNAR blocking antibody as indicated. (B) qPCR analysis of Tbk1, Ifnb1, Mx1, Mx2 and Ccl2 in WT or SREBP2−/− MEFs transfected with control siRNA, or siTBK1. (C) Representative western blot analysis of phospho-TBK1 (pTBK1) and total TBK1 from whole cell lysates of SREBP2−/− MEFs transfected with control siRNA, siSTING or sicGAS as indicated. (D) Western blot analysis of pTBK1 and TBK1 total in Control or SCAP−/− BMDMs +/− 0.25mg/mL MβCD-cholesterol (Chol) for 48h or 10ug/mL IFNAR neutralizing antibody. (E) Western blot analysis of pTBK1 and TBK1 total in Control or SCAP−/− BMDMs +/− 5ug/mL c-di-GMP (cGMP) for 45 min. (F) qPCR analysis of Ifnb1 expression in Control or SCAP−/− BMDMs cultured +/− 0.25mg/mL MβCD-cholesterol for 48h, then stimulated with 5ug/mL cGMP for 1h.

Comment in

References

    1. Baek SH, Li AH, Sassetti CM. Metabolic regulation of mycobacterial growth and antibiotic sensitivity. PLoS biology. 2011;9:e1001065. - PMC - PubMed
    1. Bard M, Sturm AM, Pierson CA, Brown S, Rogers KM, Nabinger S, Eckstein J, Barbuch R, Lees ND, Howell SA, et al. Sterol uptake in Candida glabrata: rescue of sterol auxotrophic strains. Diagnostic microbiology and infectious disease. 2005;52:285–293. - PubMed
    1. Blanc M, Hsieh WY, Robertson KA, Kropp KA, Forster T, Shui G, Lacaze P, Watterson S, Griffiths SJ, Spann NJ, et al. The transcription factor STAT-1 couples macrophage synthesis of 25-hydroxycholesterol to the interferon antiviral response. Immunity. 2013;38:106–118. - PMC - PubMed
    1. Blanc M, Hsieh WY, Robertson KA, Watterson S, Shui G, Lacaze P, Khondoker M, Dickinson P, Sing G, Rodriguez-Martin S, et al. Host defense against viral infection involves interferon mediated down-regulation of sterol biosynthesis. PLoS biology. 2011;9:e1000598. - PMC - PubMed
    1. Castrillo A, Joseph SB, Vaidya SA, Haberland M, Fogelman AM, Cheng G, Tontonoz P. Crosstalk between LXR and toll-like receptor signaling mediates bacterial and viral antagonism of cholesterol metabolism. Molecular cell. 2003;12:805–816. - PubMed

Publication types

Associated data