

Early detection of Alzheimer's disease using MRI hippocampal texture
- PMID: 26686837
- PMCID: PMC6867374
- DOI: 10.1002/hbm.23091
Early detection of Alzheimer's disease using MRI hippocampal texture
Abstract
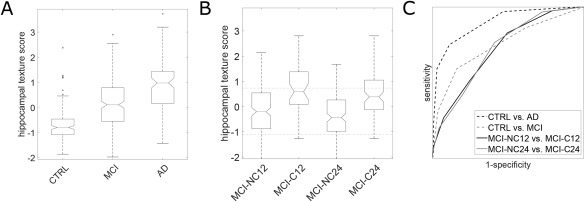
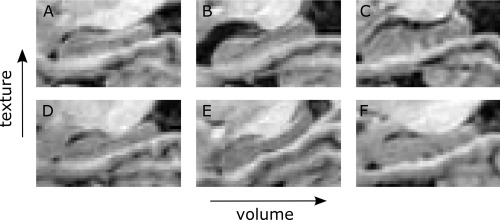
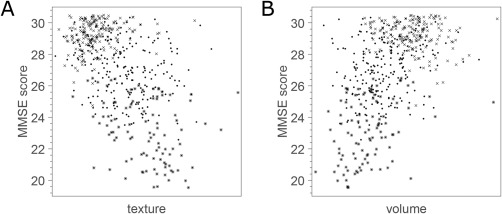
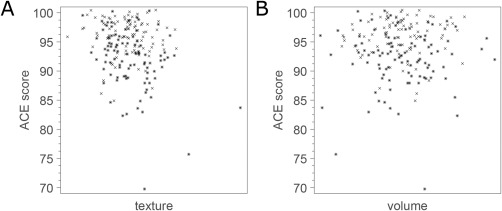
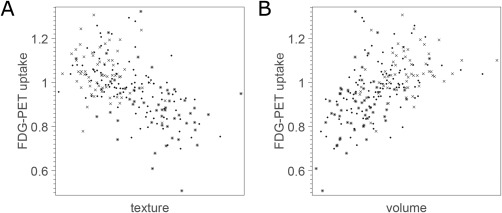
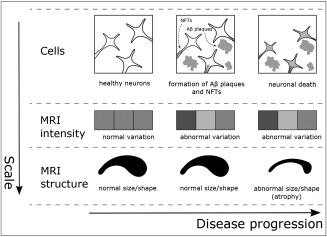
Cognitive impairment in patients with Alzheimer's disease (AD) is associated with reduction in hippocampal volume in magnetic resonance imaging (MRI). However, it is unknown whether hippocampal texture changes in persons with mild cognitive impairment (MCI) that does not have a change in hippocampal volume. We tested the hypothesis that hippocampal texture has association to early cognitive loss beyond that of volumetric changes. The texture marker was trained and evaluated using T1-weighted MRI scans from the Alzheimer's Disease Neuroimaging Initiative (ADNI) database, and subsequently applied to score independent data sets from the Australian Imaging, Biomarker & Lifestyle Flagship Study of Ageing (AIBL) and the Metropolit 1953 Danish Male Birth Cohort (Metropolit). Hippocampal texture was superior to volume reduction as predictor of MCI-to-AD conversion in ADNI (area under the receiver operating characteristic curve [AUC] 0.74 vs. 0.67; DeLong test, p = 0.005), and provided even better prognostic results in AIBL (AUC 0.83). Hippocampal texture, but not volume, correlated with Addenbrooke's cognitive examination score (Pearson correlation, r = -0.25, p < 0.001) in the Metropolit cohort. The hippocampal texture marker correlated with hippocampal glucose metabolism as indicated by fluorodeoxyglucose-positron emission tomography (Pearson correlation, r = -0.57, p < 0.001). Texture statistics remained significant after adjustment for volume in all cases, and the combination of texture and volume did not improve diagnostic or prognostic AUCs significantly. Our study highlights the presence of hippocampal texture abnormalities in MCI, and the possibility that texture may serve as a prognostic neuroimaging biomarker of early cognitive impairment.
Keywords: biomarker; classification; early diagnosis; hippocampus; image analysis; machine learning; magnetic resonance imaging; mild cognitive impairment.
© 2015 Wiley Periodicals, Inc.
Figures
References
-
- Bobinski M, de Leon MJ, Wegiel J, Desanti S, Convit A, Saint Louis LA, Rusinek H, Wisniewski HM (2000): The histological validation of post mortem magnetic resonance imaging‐determined hippocampal volume in Alzheimer's disease. Neuroscience 95:721–725. - PubMed
-
- Bobinski M, Wegiel J, Wisniewski HM, Tarnawski M, Reisberg B, Mlodzik B, de Leon MJ, Miller DC (1995): Atrophy of hippocampal formation subdivisions correlates with stage and duration of Alzheimer disease. Dementia 6:205–210. - PubMed
-
- EE Bron, M Smits, WM van der Flier, H Vrenken, F Barkhof, P Scheltens, JM Papma, RM Steketee, C Mendez Orellana, R Meijboom, M Pinto, JR Meireles, C Garrett, AJ Bastos‐Leite, A Abdulkadir, O Ronneberger, N Amoroso, R Bellotti, D Cárdenas‐Peña, AM Álvarez‐Meza, CV Dolph, KM Iftekharuddin, SF Eskildsen, P Coupé, VS Fonov, K Franke, C Gaser, C Ledig, R Guerrero, T Tong, KR Gray, E Moradi, J Tohka, A Routier, S Durrleman, A Sarica, G Di Fatta, F Sensi, A Chincarini, GM Smith, ZV Stoyanov, L Sørensen, M Nielsen, S Tangaro, P Inglese, C Wachinger, M Reuter, JC van Swieten, WJ Niessen, S Klein, for The Alzheimer's Disease Neuroimaging Initiative (2015): Standardized evaluation of algorithms for computer‐aided diagnosis of dementia based on structural MRI: the CADDementia challenge. Neuroimage 111:562–579. - PMC - PubMed
-
- Braak H, Braak E (1997): Frequency of stages of Alzheimer‐related lesions in different age categories. Neurobiol Aging 18:351–357. - PubMed
Publication types
MeSH terms
Substances
Grants and funding
LinkOut - more resources
Full Text Sources
Other Literature Sources
Medical
