. 2015 Dec 21:6:10063.
doi: 10.1038/ncomms10063.

Rapid antibiotic-resistance predictions from genome sequence data for Staphylococcus aureus and Mycobacterium tuberculosis

Affiliations

Rapid antibiotic-resistance predictions from genome sequence data for Staphylococcus aureus and Mycobacterium tuberculosis

Phelim Bradley et al. Nat Commun. .

Erratum in

Abstract

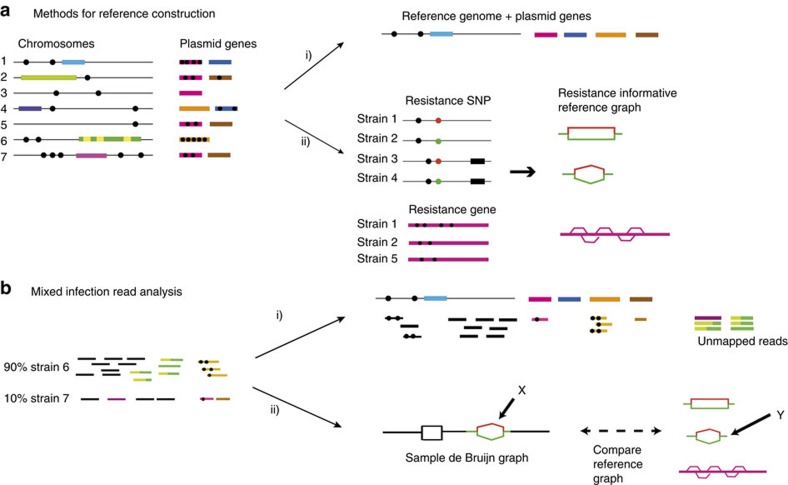
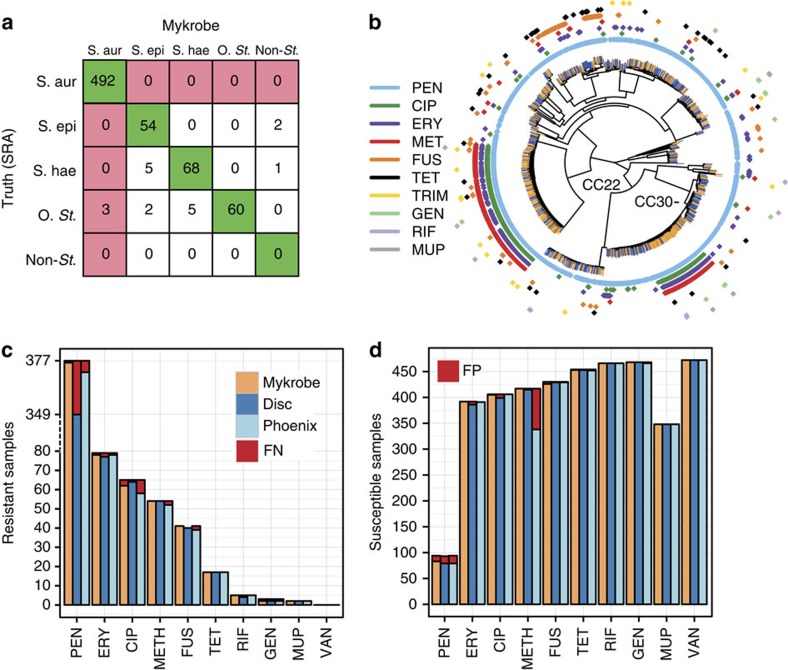
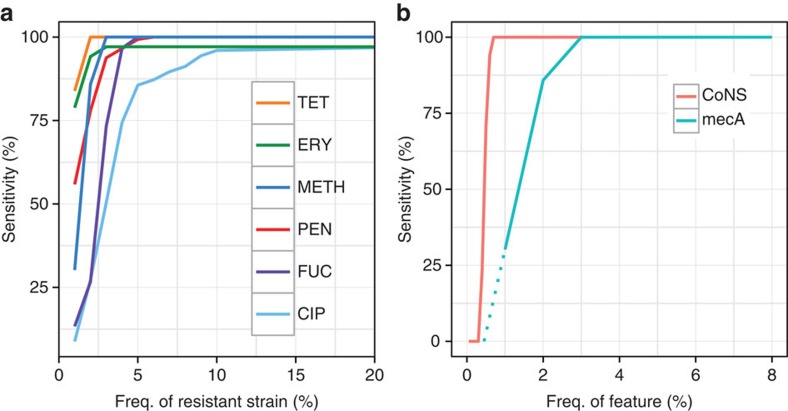
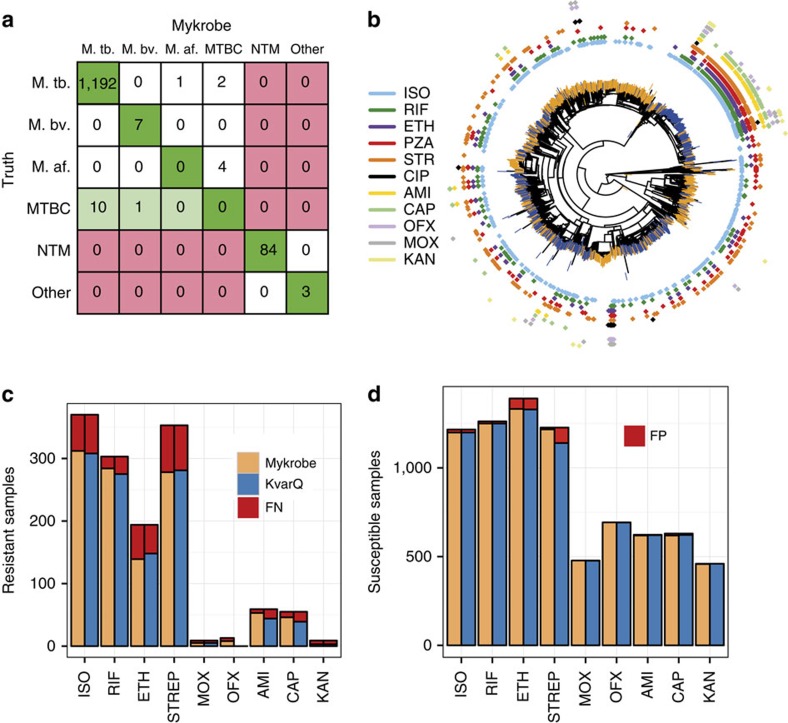
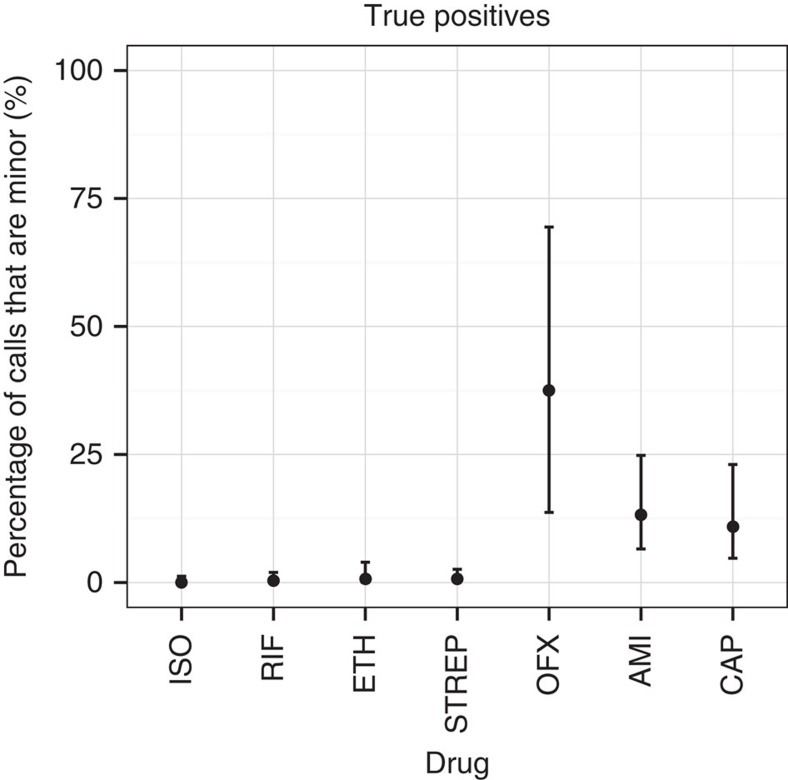
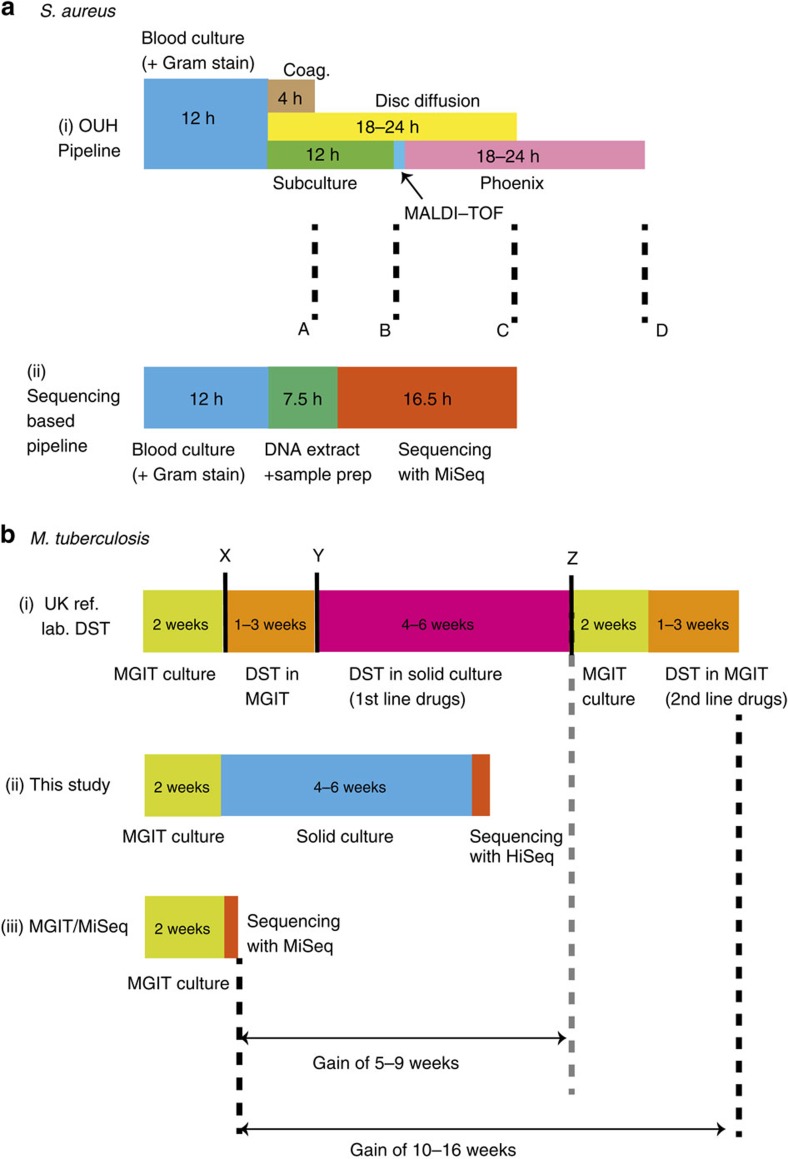
The rise of antibiotic-resistant bacteria has led to an urgent need for rapid detection of drug resistance in clinical samples, and improvements in global surveillance. Here we show how de Bruijn graph representation of bacterial diversity can be used to identify species and resistance profiles of clinical isolates. We implement this method for Staphylococcus aureus and Mycobacterium tuberculosis in a software package ('Mykrobe predictor') that takes raw sequence data as input, and generates a clinician-friendly report within 3 minutes on a laptop. For S. aureus, the error rates of our method are comparable to gold-standard phenotypic methods, with sensitivity/specificity of 99.1%/99.6% across 12 antibiotics (using an independent validation set, n=470). For M. tuberculosis, our method predicts resistance with sensitivity/specificity of 82.6%/98.5% (independent validation set, n=1,609); sensitivity is lower here, probably because of limited understanding of the underlying genetic mechanisms. We give evidence that minor alleles improve detection of extremely drug-resistant strains, and demonstrate feasibility of the use of emerging single-molecule nanopore sequencing techniques for these purposes.


Conflict of interest statement

Z.I. and P.B. are potential beneficiaries of licensing of Mykrobe predictor by the University of Oxford. The remaining authors declare no conflict of interest.

Figures

Figure 1
Figure 1. Representation and analysis of bacterial genetic variation.
(a) Reference construction methods. Left: chromosomes with SNPs (black circles) and genes (coloured blocks) from strains of a bacterial species. Option (i) picks strain 1 to be reference, plus one example of each plasmid resistance gene. In option (ii), our method is to build the de Bruijn graph of all strains, restrict to loci of interest, and annotate resistance (red) and susceptible (green) alleles. For SNPs, local graph topology is determined by adjacent SNPs (black dots) and indels (black blocks). (b) Mixed infection read analysis. Left: sequence data from a clinical sample harbouring major (90%) and minor (10%) strains. Right: option (i) maps the reads to the reference genome to detect SNPs and genes. In option (ii), our approach, we construct the de Bruijn graph of the sample and compare with the reference graph. We see a specific SNP is present both in the sample and the reference graph (marked X, Y). Both the resistant (red) and susceptible (green) alleles are present in the sample, and within-sample frequency is estimated from sequencing depth on each allele.
Figure 2
Figure 2. Species and susceptibility predictions for S. aureus.
(a) Species classification results on species validation set St_B (n=692). Red shading of box indicates errors we wish to minimize. S.aur, S. aureus; S.epi, S. epidermidis; S.hae, S. haemolyticus; O.st, other staphylococcus; Non-st, non staphylococcal. ‘Truth (SRA)' is the species as annotated in the SRA metadata, which was used as truth for comparisons. (b) Phylogeny of S. aureus samples used in evaluating resistance prediction, with tips marked orange or blue to represent samples in training set (St_A1, n=495) or validation set (St_B1, n=471). Drug resistance is indicated in concentric rings around the phylogenetic tree; plasmid-mediated resistance (erythromycin in purple, tetracycline in black) is distributed across the whole tree. The two multi-drug resistant clades are in UK hospital clonal complexes CC22 and CC30. (c) Proportion of resistant S. aureus samples (St_B1) correctly identified as resistant by Mykrobe predictor (orange), disc test (dark blue) and Phoenix (light blue) compared with consensus, with false negatives in red. Note the break in the y axis between 80 and over 300 to show penicillin on same plot. (d) As c, but showing proportion of susceptible samples correctly identified as susceptible—false positives in red. A small number of failed disc tests for fusidic acid in panel c result in a lower bar. PEN, penicillin; ERY, erythromycin; CIP, ciprofloxacin; METH, methicillin; FUS, fusidic acid; CLIN, clindamycin; TET, tetracycline; RIF, rifampicin; GEN, gentamicin; MUP, mupirocin; TRIM, trimethoprim; VAN, vancomycin.
Figure 3
Figure 3. Photograph of BSAC disc test showing heteroresistant phenotype.
Seen on re-running Erythromycin disc test on a sample (accession: ERS398183) where Mykrobe predictor had called a false positive (resistant) that neither disc nor Phoenix had called.
Figure 4
Figure 4. Power to detect minor populations.
(a) Simulation 2: power to detect minor resistant alleles in 27,000 in silico mixtures created by taking 1,000 pairs of S. aureus samples and mixing each pair in 27 different ratios. As above, we do not estimate false-negative rates for drugs where we have <10 resistant samples, as confidence intervals would be unreasonably large. Power is greatest for the drugs where resistance genes reside on multi-copy plasmids, namely erythromycin and tetracycline. Tet, tetracycline; Ery, erythromycin; Meth, methicillin; Pen, penicillin; Fuc, fusidic acid; Cip, ciprofloxacin. (b) Power to detect low-frequency coagulase-negative species (red, simulation 1, N=540, described above) is consistently higher than power to detect mecA (blue, simulation 2, N=27,000, frequencies down to 1% only due to large sample numbers; dotted lines extrapolate linearly from points at 1 and 2%), which causes methicillin resistance in S. aureus. Thus, the risk of detecting mecA but not detecting the coagulase-negative species it comes from is limited.
Figure 5
Figure 5. Species predictions for mycobacteria and resistance predictions for MTBC.
(a) Species classification results on a validation set (MTBC_A2+Myco_Retro, n=1,304). Colours indicate misclassifications between NTM/MTBC (red), concordance with ‘truth' (dark green), or greater resolution from Mykrobe predictor than PCR (light green). M.tb., M. tuberculosis; M.af., M. africum; M.bv., M. bovis. See Supplementary Table 1 for details of ‘truth' species. (b) Phylogeny of MTBC samples with phenotype data, with tips marked orange or blue to indicate training set (MTBC_A, n=1,920) or validation set (MTBC_B, n=1,609). Drug resistance is shown in concentric rings around the phylogenetic tree. Resistance exists across the phylogeny, especially against isoniazid (light blue), with a clustering of multi-drug resistance in the Beijing lineage. (c) Proportion of resistant MTBC samples correctly identified as resistant by Mykrobe predictor (yellow) and KvarQ (light blue) compared with DST phenotype—false negatives in red. (d) As c, but showing proportion of susceptible samples called as susceptible—false positives in red. ISO, isoniazid; RIF, rifampicin; ETH, ethambutol; STREP, streptomycin; MOX, moxifloxacin; OFX, ofloxacin; AMI, amikacin; CAP, capreomycin; KAN, kanamycin.
Figure 6
Figure 6. Percentage of true positive resistant calls in M. tuberculosis validation set due to minor alleles.
Confidence intervals are calculated using the Clopper–Pearson interval. Drugs with <10 resistant samples were excluded to avoid overly large confidence intervals. For aminoglycosides and quinolones, minor populations explain between 11–38% of true positive resistance predictions. ISO, isoniazid; RIF, rifampicin; ETH, ethambutol; STREP, streptomycin; OFX, ofloxacin; AMI, amikacin; CAP, capreomycin.
Figure 7
Figure 7. Timelines for sequencing-based analysis and culture-based DST.
The timelines are shown for (a) S. aureus and (b) M. tuberculosis. In (a) both culture-based (a,i) and sequencing-based (a,ii) options involve 12 h of blood culture. After this, the culture-based approach (at Oxford University Hospitals clinical laboratory) follows with a direct coagulase test (Coag.) that provides a presumptive species identification at 4 h (marked ‘A'). Concurrently, blood culture is subcultured to blood agar, and MALDI-TOF confirms the species at 12 h (‘B'). A disc diffusion test for five antimicrobials (including methicillin) is performed directly from a positive blood culture providing first-line susceptibility information 18–24 h later (‘C'), assuming an acceptable inoculum. Finally, post-subculture samples are undergo extended susceptibility testing by automated broth microdilution (brandname ‘Phoenix'), giving final results after another 18–24 h (‘D'). For the sequencing-based workflow (a,ii), the DNA extraction plus sample preparation takes 7.5 h because samples are from blood culture, not colony isolates. With the Illumina MiSeq v3 reagents, a 16.5 h run is possible (giving paired 75 bp reads, adequate for this purpose), giving full susceptibility results at the same time as direct disc tests provide results for five drugs. (b) The culture-based process (b,i; in a typical UK reference laboratory) starts with two weeks of mycobacterial growth indicator tube (MGIT) culture, followed by a species identification test (‘X'). If the species belongs to the MTBC, then DST is run in MGIT, and at decision point ‘Y', if the sample tests susceptible to all first-line drugs, no further testing is done. MGIT DST is repeated for pyrazinamide if the first test revealed resistance to this drug. If there is resistance to any other drug, then solid culture DST is performed. If these tests show there is resistance to rifampicin then another round of MGIT culture followed by MGIT DST is done for second-line drugs. For sequencing-based approaches we show timelines for the present study (b,ii) and a potential alternative (b,iii), which would reduce time-to-results to just over 2 weeks.

References

    1. Nathan C. & Cars O. Antibiotic resistance—problems, progress, and prospects. N. Engl. J. Med. 371, 1761–1763 (2014) . - PubMed
    1. Didelot X., Bowden R., Wilson D. J., Peto T. E. & Crook D. W. Transforming clinical microbiology with bacterial genome sequencing. Nat. Rev. Genet. 13, 601–612 (2012) . - PMC - PubMed
    1. Gordon N. et al.. Prediction of Staphylococcus aureus Antimicrobial Resistance by Whole-Genome Sequencing. J. Clin. Microbiol. 52, 1182–1191 (2014) . - PMC - PubMed
    1. Segata N. et al.. Metagenomic microbial community profiling using unique clade-specific marker genes. Nat. Methods 9, 811–814 (2012) . - PMC - PubMed
    1. Huson D. H., Auch A. F., Qi J. & Schuster S. C. MEGAN analysis of metagenomic data. Genome Res. 17, 377–386 (2007) . - PMC - PubMed

Publication types

MeSH terms

Substances