. 2015 Dec 19:4:e08890.
doi: 10.7554/eLife.08890.

Many lncRNAs, 5'UTRs, and pseudogenes are translated and some are likely to express functional proteins

Affiliations

Many lncRNAs, 5'UTRs, and pseudogenes are translated and some are likely to express functional proteins

Zhe Ji et al. Elife. .

Abstract

Using a new bioinformatic method to analyze ribosome profiling data, we show that 40% of lncRNAs and pseudogene RNAs expressed in human cells are translated. In addition, ~35% of mRNA coding genes are translated upstream of the primary protein-coding region (uORFs) and 4% are translated downstream (dORFs). Translated lncRNAs preferentially localize in the cytoplasm, whereas untranslated lncRNAs preferentially localize in the nucleus. The translation efficiency of cytoplasmic lncRNAs is nearly comparable to that of mRNAs, suggesting that cytoplasmic lncRNAs are engaged by the ribosome and translated. While most peptides generated from lncRNAs may be highly unstable byproducts without function, ~9% of the peptides are conserved in ORFs in mouse transcripts, as are 74% of pseudogene peptides, 24% of uORF peptides and 32% of dORF peptides. Analyses of synonymous and nonsynonymous substitution rates of these conserved peptides show that some are under stabilizing selection, suggesting potential functional importance.

Keywords: 5'UTR; biological function; cell biology; evolutionary biology; genomics; human; non-coding RNAs; pseudogene; ribosome profiling; translation.


Conflict of interest statement

KS: Reviewing editor, eLife.

The other authors declare that no competing interests exist.

Figures
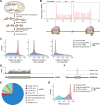
Figure 1.
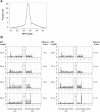
Figure 1.. Ribosome profiling reveals in vivo translation with single nucleotide resolution.
(A) Ribosome profiling experiment. (B) Read distribution (reads/million mappable reads; RPM) around start and stop codons of canonical protein coding genes. (C) Fractions of reads in 1st, 2nd and 3rd nucleotides of codons in the indicated types of ORFs. (D) Read distribution in the protein-coding gene CPSF2. The RPM value was calculated for every 20-nt region along the transcript. (E) Distribution of reads across human genome. (F) Read distribution of the snoRNA gene SNORA49 in cells treated with cycloheximide (Chx) or harringtonine (Harr). (G) Distribution of PME values in the indicated types of ORFs. DOI: http://dx.doi.org/10.7554/eLife.08890.003
Figure 1—figure supplement 1.
Figure 1—figure supplement 1.. Ribosome profiling data.
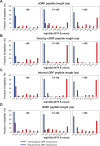
(A) RPF length distribution. (B) The read distribution of RPFs around start and stop codons of canonical mRNA ORFs. RPFs were grouped based on their length. DOI: http://dx.doi.org/10.7554/eLife.08890.004
Figure 2.
Figure 2.. RibORF identifies translating ORFs.
(A) Receiver-operating characteristic (ROC) curves to measure algorithm performance using different training parameters. (B) Types of translated ORFs identified in this study, with ORF number:gene number shown in parenthesis. (C) Distribution of reads upon cycloheximide treatment around start codon of predicted positive and negative lncRNA ORFs. Examples of (D) a translated lncRNA (E) an mRNA with a uORF (F) an mRNA with a dORFs; the 3’ most exon is shown. Enlarged figures show 3-nt periodicity can be observed for each codon in Figure 2D–F. DOI: http://dx.doi.org/10.7554/eLife.08890.005
Figure 2—figure supplement 1.
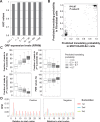
Figure 2—figure supplement 1.. RibORF algorithm performance.
(A) ORFs were grouped based on expression levels, and corresponding AUC values were plotted as in Figure 2A. (B) Correlation of predicted translating probability of candidate ORFs, using ribosome profiling data from MCF10A-ER-Src cells and fibroblast cells. 1000 randomly selected candidate ORFs were used in the analyses. (C) Candidate ORFs were grouped based on predicted translating probability. Fractions of reads in 1st, 2nd and 3rd nucleotides of codons and PME values in different groups were shown. (D) Distribution of ribosome profiling reads around start codon of predicted positive and negative uORFs. DOI: http://dx.doi.org/10.7554/eLife.08890.006
Figure 2—figure supplement 2.
Figure 2—figure supplement 2.. Analysis of ribosome-associated RNA.
(A) Sucrose gradient fractionation of polyribosomes with fractions indicated. (B) Analysis of RNAs associated with 80S monoribosomes (fraction 1) and polyribosomes with 2 (fraction 2) or 3+ (combining fractions 3–6) ribosomes. The RNAs analyzed including seven predicted translated lncRNAs, the IL6 mRNA as a positive control, and non-translating lncRNA ENSG00000256973.1 and snoRNA SNORD105 as negative controls. The amounts for the ribosome-associated RNAs are expressed with respect to the amounts of these RNAs in the unfractionated samples prior to sucrose gradient centrifugation. DOI: http://dx.doi.org/10.7554/eLife.08890.007
Figure 3.
Figure 3.. RNA subcellular localization is a major determinate of translation efficiency.
(A) RNA expression levels of lncRNAs with or without translated ORFs and canonical mRNAs in MCF10A-ER-Src cells. (B) Relative subcellular location of translated and untranslated lncRNAs and canonical mRNAs. (C) Translation efficiency of translated lncRNAs and canonical mRNAs. (D) Distribution of translation efficiency of canonical mRNAs, calculated as averaged translation efficiency values in breast epithelial and fibroblast cells. (E) Relative subcellular locations of mRNAs grouped based on translation efficiency. DOI: http://dx.doi.org/10.7554/eLife.08890.008
Figure 3—figure supplement 1.
Figure 3—figure supplement 1.. RNA subcellular localization regulates translation.
(A) RNA expression levels of expressed lncRNAs with or without translated ORFs and mRNAs in fibroblast cells measure by RNA-seq. (B) Translation efficiency of translated ORFs in lncRNAs and canonical ORFs in mRNAs in fibroblast cells. (C,D) Relative subcellular location of translated/untranslated lncRNAs and mRNAs. RPKM values were calculated using RNA-seq data for nucleus and cytosol fractions of K562 (C) and Hepg2 (D) cells. (E–G) Relative subcellular localization of translated/untranslated pseudogenes. (H, I) mRNAs were grouped based on translation efficiency as in Figure 3D, and relative subcellular locations of mRNAs in K562 (H) and Hepg2 (I) cells were shown. DOI: http://dx.doi.org/10.7554/eLife.08890.009
Figure 4.
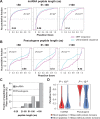
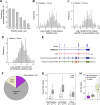
Figure 4.. Features and conservation of lncRNA peptides.
(A) Fraction of expressed lncRNAs that encode peptides longer than a certain length. (B) Peptide length encoded by lncRNAs. (C) Length of the longest peptide in a given lncRNAs. (D) Length of conserved lncRNA peptides. (E) LncRNA LOC284023 encodes two peptides, the upstream one being conserved in the mouse lncRNA Chd3os. (F) Ka and Ks values of types of conserved lncRNA peptides with Z-Test p-values shown. (G) Ka/Ks ratios of types of conserved lncRNA peptides. DOI: http://dx.doi.org/10.7554/eLife.08890.010
Figure 4—figure supplement 1.
Figure 4—figure supplement 1.. Features of lncRNA translation.
(A) Start codon of translated ORFs in lncRNAs and mRNAs. (B) Start codon of translated ORFs in lncRNA grouped based on length. (C) Length of the longest candidate ORFs in a given lncRNAs considering start codon variants (A/C/G/UUG). (D) Length of the longest candidate ORFs in a given lncRNAs versus length of the longest peptides translated in a given lncRNAs. DOI: http://dx.doi.org/10.7554/eLife.08890.011
Figure 4—figure supplement 2.
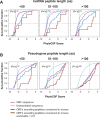
Figure 4—figure supplement 2.. Conservation of nucleotides encoding lncRNA and pseudogene peptides.
(A) PhastCon scores of nucleotides encoding lncRNA peptide grouped based on length. The median PhastCon value of translated ORFs in each group was shown. The PhastCon scores of random untranslated sequences of matching sizes and locations are also plotted. (B) PhastCon scores of nucleotides encoding pseudogene peptide grouped based on length. The median PhastCon value of translated ORFs in each group was shown. The PhastCon scores of random untranslated sequences of matching sizes and locations are also plotted. (C) Fractions of lncRNA and pseudogene peptides with protein domain annotated by Pfam (including both Pfam-A and Pfam-B) using default cutoff E-value <1). (D) PhastCon scores of nucleotides in ORFs of short lncRNA and pseudogene peptides (<100 aa) with or without protein domains. p-values based on the Wilcoxon Rank Sum Test were shown. DOI: http://dx.doi.org/10.7554/eLife.08890.012
Figure 4—figure supplement 3.
Figure 4—figure supplement 3.. Coding potential of nucleotides encoding lncRNA and pseudogene peptide.
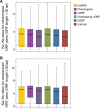
(A) PhyloCSF scores of nucleotides encoding lncRNA peptide grouped based on length. The PhyloCSF scores of random untranslated sequences of matching sizes and locations are also plotted. Wilcoxon Rank Sum Test p-value comparing ORF sequences and untranslated sequences were shown. And scores of ORFs encoding peptides conserved in mouse and those with Ka/Ks < 0.5 were also shown. (B) PhyloCSF scores of nucleotides encoding pseudogene peptide grouped based on length. The PhyloCSF scores of random untranslated sequences of matching sizes and locations are also plotted. Wilcoxon Rank Sum Test p-value comparing ORF sequences and untranslated sequences were shown. And scores of ORFs encoding peptides conserved in mouse and those with Ka/Ks < 0.5 were also shown. DOI: http://dx.doi.org/10.7554/eLife.08890.013
Figure 4—figure supplement 4.
Figure 4—figure supplement 4.. BLASTP E-values of peptide sequences encoded by homologous human and mouse ORF.
(A) LncRNAs (B) Pseudogene RNAs BLASTP E-values between human translated ORFs and their randomized sequences were shown as the control. DOI: http://dx.doi.org/10.7554/eLife.08890.014
Figure 4—figure supplement 5.
Figure 4—figure supplement 5.. BLASTP E-values of peptide sequences encoded by homologous human and mouse peptides.
(A) uORFs (B) Overlapping uORFs (C) Internal ORFs (D) dORFs BLASTP E-values between human translated ORFs and their randomized sequences were shown as the control. DOI: http://dx.doi.org/10.7554/eLife.08890.015
Figure 4—figure supplement 6.
Figure 4—figure supplement 6.. The Ka/Ks ratios between human translated ORFs and 50 randomly generated sequences with BLASTP alignment E-value <10-4.
(A) ORFs < 50 aa. (B) ORFs ≥ 50 aa. DOI: http://dx.doi.org/10.7554/eLife.08890.016
Figure 5.
Figure 5.. Features and conservation of pseudogene peptides.
(A) Fraction of expressed pseudogenes that encode peptides longer than a certain length. (B) Peptide length encoded by pseudogenes. (C) Length of the longest peptides in a given pseudogenes. (D) Length of conserved pseudogene peptides. (E) Peptide in a human pseudogene FAM86C2P is conserved in the mouse protein coding gene Fam86. FAM86C2P also has a homologous human protein coding gene FAM86A. (F) Conserved human pseudogene peptides, grouped based on their homologous ORF types in mouse genome. (G) Ka and Ks values of types of conserved pseudogene peptides with Z-Test p-values shown. (H) Ka/Ks ratios of types of conserved pseudogene peptides. DOI: http://dx.doi.org/10.7554/eLife.08890.017
Figure 6.
Figure 6.. Features of ORFs encoded by protein coding genes.
(A) Length distribution of peptides encoded by human protein coding genes. (B) Relative translation efficiency comparing non-canonical ORF vs. canonical ORF from the same gene. (C) Translation efficiency of canonical ORFs comparing genes with/without uORFs. (D) RNA expression level of genes with/without uORFs, measured by RNA-seq. (E) ATF4 encoded 3 uORFs and 1 overlapping uORF, whose translation efficiency is much higher than the canonical ORF. (F) Start codon types of uORFs showing differential relative expression levels to canonical ORFs. High: >three-fold higher than canonical ORFs. Low: >three-fold lower than canonical ORFs. DOI: http://dx.doi.org/10.7554/eLife.08890.018
Figure 6—figure supplement 1.
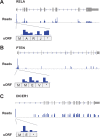
Figure 6—figure supplement 1.. Example genes showing high translation of uORFs.
(A) RELA (B) PTEN (C) DICER1 Enlarged figures show supporting read distribution in uORFs. DOI: http://dx.doi.org/10.7554/eLife.08890.019
Figure 7.
Figure 7.. Conservation of non-canonical peptides encoded by mRNAs.
(A) Fraction of human mRNA peptides conserved in mouse. (B) Ka and Ks values of conserved mRNA peptides with Z-Test p-values shown. (C) Ka/Ks ratios of conserved mRNA peptides. DOI: http://dx.doi.org/10.7554/eLife.08890.020
Figure 7—figure supplement 1.
Figure 7—figure supplement 1.. Conservation of nucleotides encoding uORF and dORF peptides.
(A,B) PhastCon scores of nucleotides in uORFs (A) and dORFs (B) and their neighboring untranslated sequences of matching size and location (See methods for detail) were plotted. (C,D) PhyloCSF scores of nucleotides in uORFs (C) and dORFs (D) and their neighboring untranslated sequences of matching size and location were plotted. And scores of ORFs encoding peptides conserved in mouse and those with Ka/Ks < 0.5 were also shown. DOI: http://dx.doi.org/10.7554/eLife.08890.021
Figure 7—figure supplement 2.
Figure 7—figure supplement 2.. Examples of conserved uORF peptides.
DOI: http://dx.doi.org/10.7554/eLife.08890.022

Comment in

References

    1. Aspden JL, Eyre-Walker YC, Phillips RJ, Amin U, Mumtaz MAS, Brocard M, Couso J-P. Extensive translation of small open reading frames revealed by poly-ribo-seq. eLife. 2014;3 doi: 10.7554/eLife.03528. - DOI - PMC - PubMed
    1. Barbosa C, Peixeiro I, Romão L, Fisher EMC. Gene expression regulation by upstream open reading frames and human disease. PLoS Genetics. 2013;9:e08890. doi: 10.1371/journal.pgen.1003529. - DOI - PMC - PubMed
    1. Batista PJ, Chang HY. Long noncoding RNAs: cellular address codes in development and disease. Cell. 2013;152:1298–1307. doi: 10.1016/j.cell.2013.02.012. - DOI - PMC - PubMed
    1. Bazzini AA, Johnstone TG, Christiano R, Mackowiak SD, Obermayer B, Fleming ES, Vejnar CE, Lee MT, Rajewsky N, Walther TC, Giraldez AJ. Identification of small ORFs in vertebrates using ribosome footprinting and evolutionary conservation. The EMBO Journal. 2014;33:981–993. doi: 10.1002/embj.201488411. - DOI - PMC - PubMed
    1. Bosley KS, Botchan M, Bredenoord AL, Carroll D, Charo RA, Charpentier E, Cohen R, Corn J, Doudna J, Feng G, Greely HT, Isasi R, Ji W, Kim J-S, Knoppers B, Lanphier E, Li J, Lovell-Badge R, Martin GS, Moreno J, Naldini L, Pera M, Perry ACF, Venter JC, Zhang F, Zhou Q, Regev A, Struhl K. CRISPR germline engineering—the community speaks. Nature Biotechnology. 2015;33:478–486. doi: 10.1038/nbt.3227. - DOI - PubMed

Publication types