. 2015 Dec 17;163(7):1641-54.
doi: 10.1016/j.cell.2015.11.054.

Chromothripsis and Kataegis Induced by Telomere Crisis

Affiliations

Chromothripsis and Kataegis Induced by Telomere Crisis

John Maciejowski et al. Cell. .

Abstract

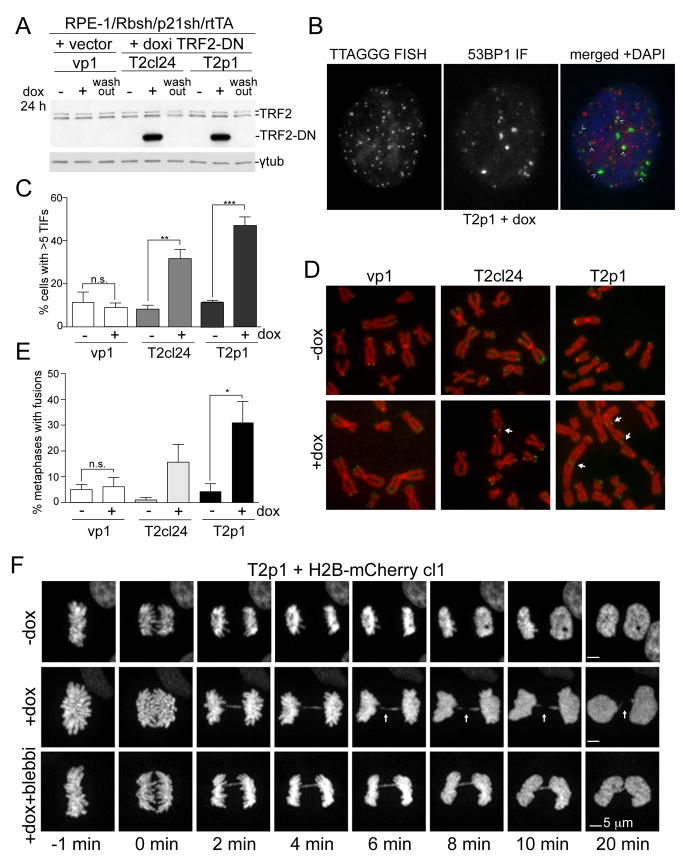
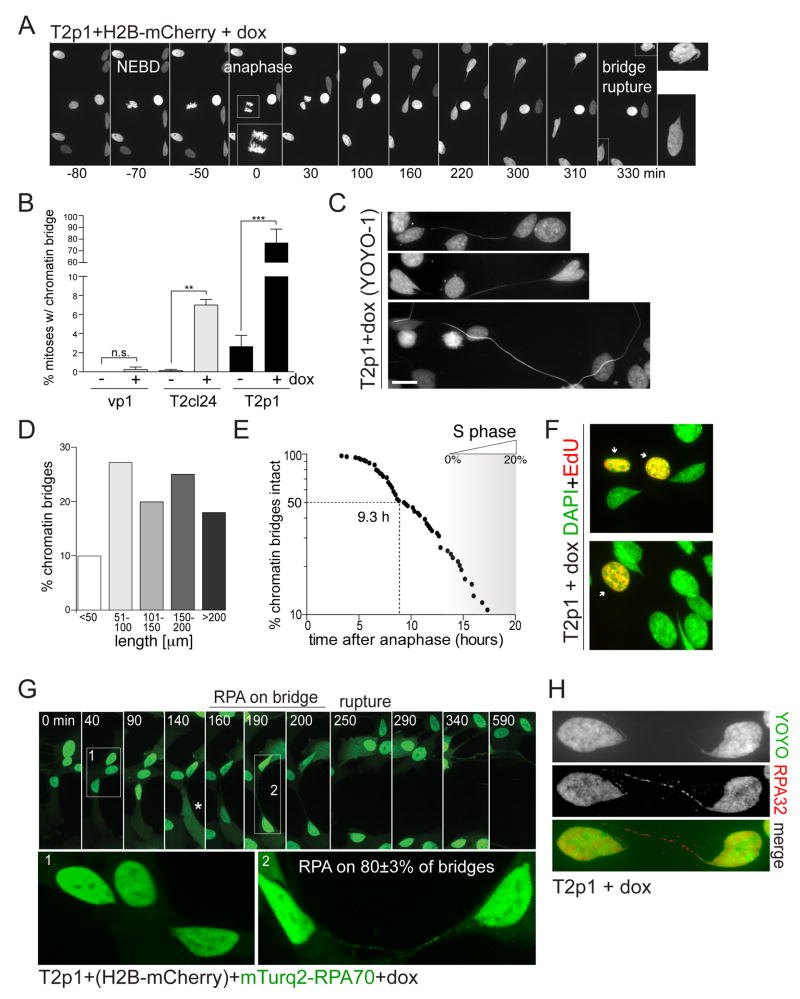
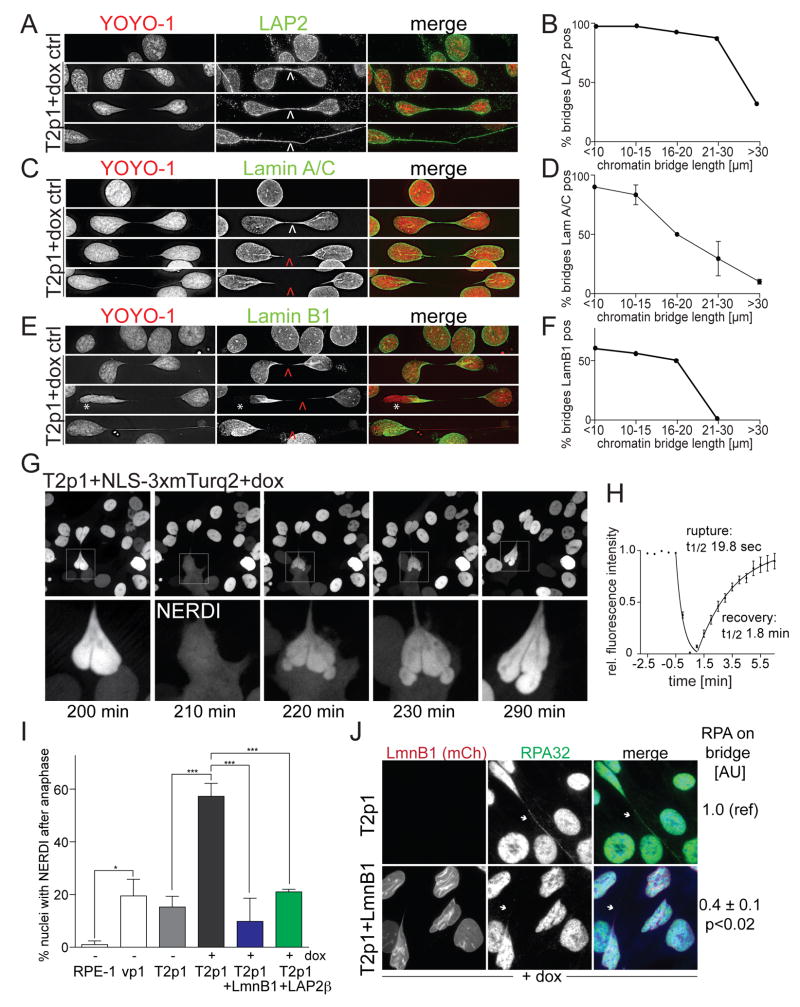
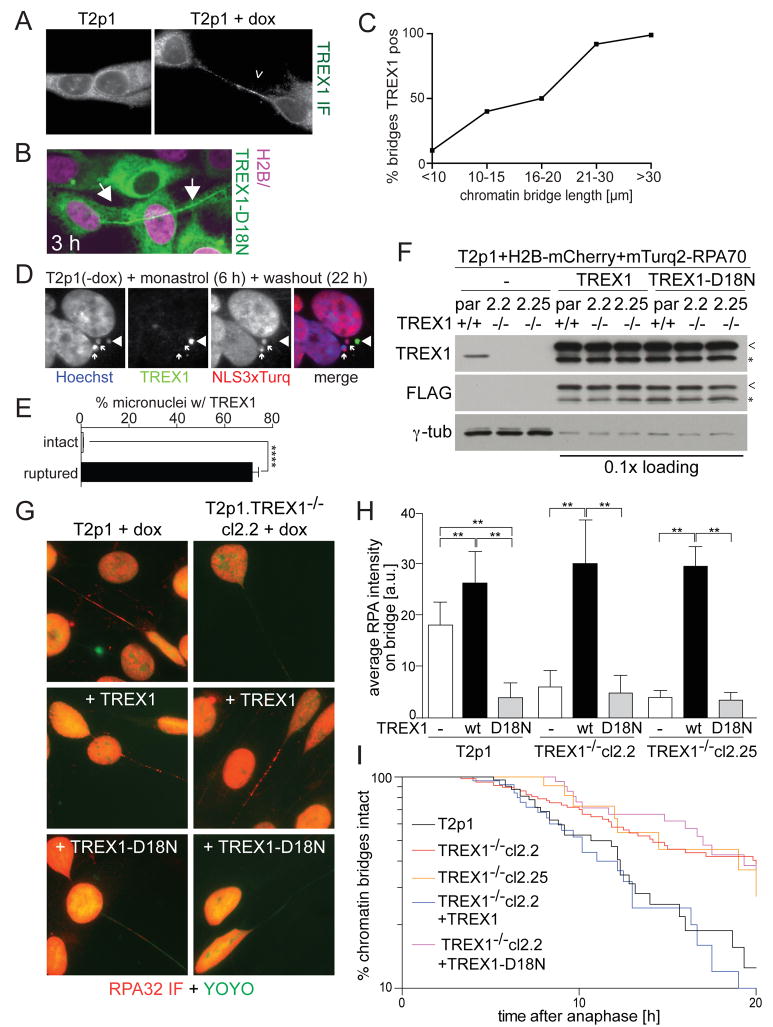
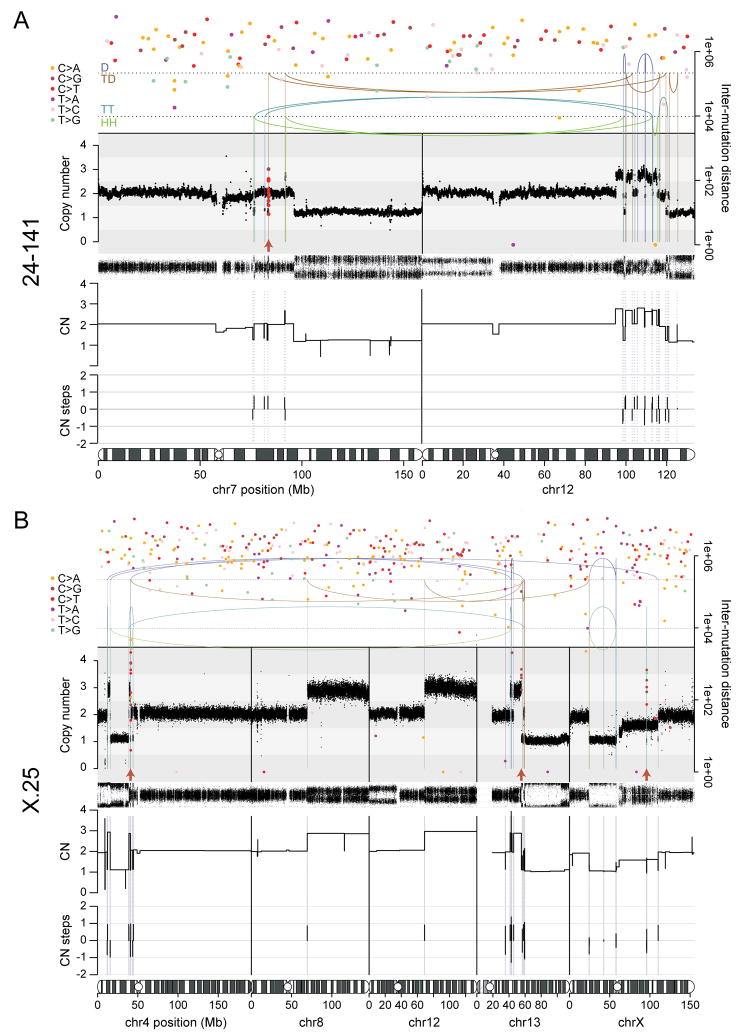
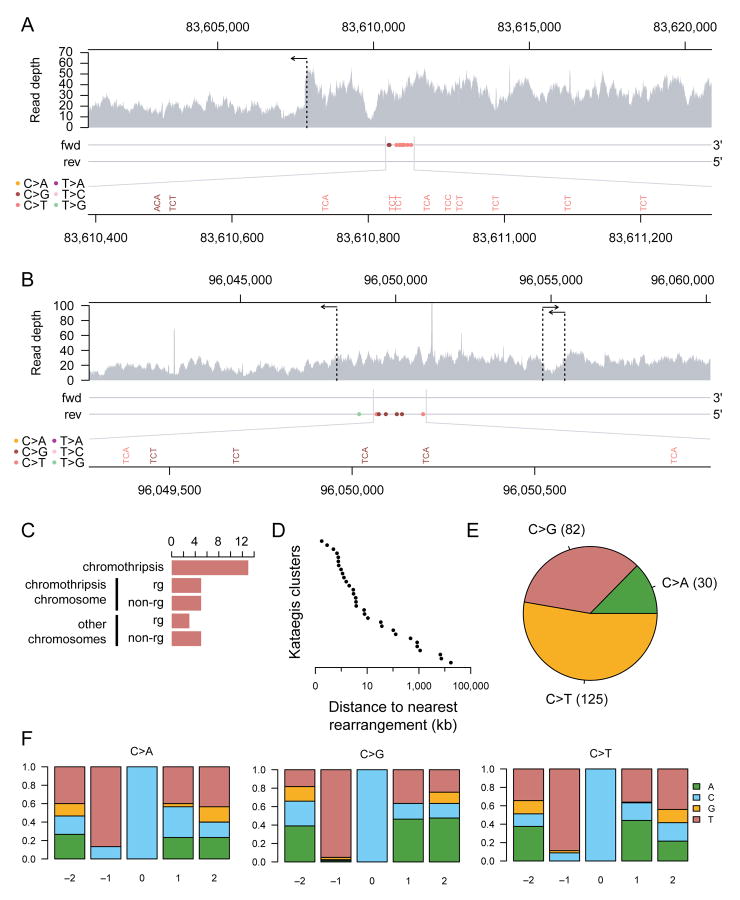
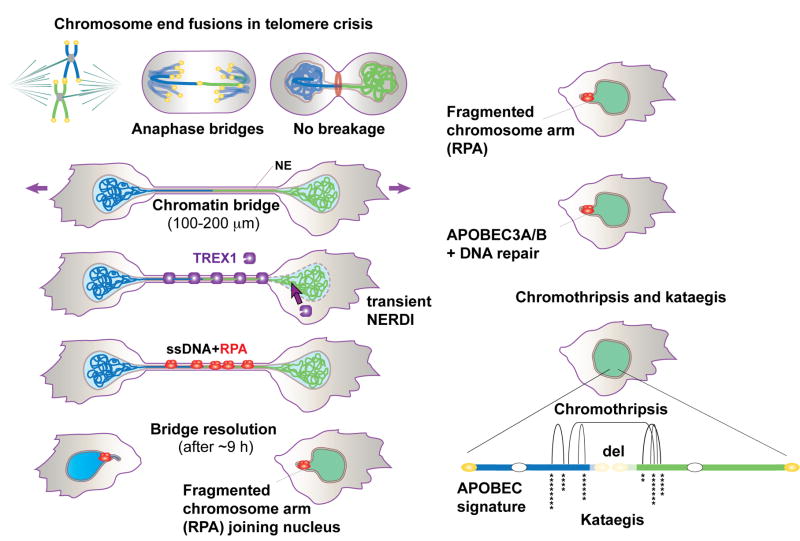
Telomere crisis occurs during tumorigenesis when depletion of the telomere reserve leads to frequent telomere fusions. The resulting dicentric chromosomes have been proposed to drive genome instability. Here, we examine the fate of dicentric human chromosomes in telomere crisis. We observed that dicentric chromosomes invariably persisted through mitosis and developed into 50-200 μm chromatin bridges connecting the daughter cells. Before their resolution at 3-20 hr after anaphase, the chromatin bridges induced nuclear envelope rupture in interphase, accumulated the cytoplasmic 3' nuclease TREX1, and developed RPA-coated single stranded (ss) DNA. CRISPR knockouts showed that TREX1 contributed to the generation of the ssDNA and the resolution of the chromatin bridges. Post-crisis clones showed chromothripsis and kataegis, presumably resulting from DNA repair and APOBEC editing of the fragmented chromatin bridge DNA. We propose that chromothripsis in human cancer may arise through TREX1-mediated fragmentation of dicentric chromosomes formed in telomere crisis.

Keywords: APOBEC; NERDI; TREX1; chromothripsis; dicentric chromosome; kataegis; telomere crisis.


Figures

Figure 1
Figure 1. Dicentric chromosomes persist through anaphase
(A) Immunoblotting for TRF2 and TRF2-DN 48 h after dox in the indicated RPE-1 cell lines. Wash-out: 48 h after removal of dox. (B) Example of 53BP1 TIFs (arrows) in T2p1 48 h after dox. Red: telomeric FISH; green: IF for 53BP1; blue; DAPI DNA stain. (C) Quantification of TIFs as shown in (B). Bar graphs present mean values from three independent experiments (>49 cells each) and SDs. **, P ≤ 0.01, ***; P ≤ 0.001 (Student’s t-test). (D) Metaphases with telomere fusions (arrows) in the indicated cells 48 h after dox. Red: DAPI DNA stain; green: telomeric FISH. (E) Quantification of telomere fusions as determined in (D). Data are means and SDs from three independent experiments (>5600 telomeres per cell line per experiment). n.s., not significant; *, P ≤ 0.05 (Student’s t-test). (F) Images of H2B-mCherry marked chromatin at the indicated time points from T2p1 with and without induction (+ and -dox) of telomere fusions with and without blebbistatin. Arrows (+dox images) highlight positions with absent H2B signals. See also related Figure S1 and Movie S1.
Figure 2
Figure 2. Dicentric chromosomes form RPA-containing chromatin bridges
(A) Images of chromatin from live-cell imaging of T2p1+H2B-mCherry treated with dox. Time points as indicated. NEBD: Nuclear envelope breakdown. Anaphase is shown in enlarged inset. The bridge resolves ~5.5 h after anaphase. The images of the two daughter nuclei are enlarged on the right. (B) Quantification of chromatin bridge induction derived from movies as in (A). Bar graphs represent the means and SDs of three independent experiments (>50 cell divisions per experiment). n.s., not significant; **, P ≤ 0.01 (Student’s t-test). (C) Chromatin bridges with YOYO-1 DNA stain. Scale bar, 10 μm. (D) Quantification of chromatin bridge length at resolution. Data derived from movies as in (A). (E) Measurements of the timing of chromatin bridge resolution in h after anaphase. Data obtained from movies as in (A) (n=84 from three independent experiments). Entry into S phase was based on RPA patterns. At 20 h, ~20% of the cells are in S phase. (F) Two examples of EdU staining (30 min pulse; red) and DAPI stain (green). Note the lack of EdU signal on the chromatin bridges and connected nuclei. (G) Accumulation of RPA on chromatin bridges before their resolution. T2p1+H2B-mCherry+mTurquoise2-RPA70 cells were examined by live-cell imaging. Stills showing the mTurquoise-RPA70 signal on one chromatin bridge are shown. Enlargements: bridge without and later with RPA70. 80±3% of bridges (mean±SD; 102 bridges from 3 independent experiments) contained RPA. Asterisk: apparent NERDI. (H) IF for RPA32 (red) on fixed cells with a chromatin bridge. DNA stained with YOYO-1 (green). See also Figure S2, S3, and S4, and Movies S2 and S3.
Figure 3
Figure 3. Transient NERDI is frequently associated with chromatin bridges
(A,C,E) IF for LAP2, Lamin A/C, or Lamin B1 IF (green) in T2p1 before and 48 h after induction with dox. DNA stained with YOYO-1 (red). Arrows: white, signals present; red, signals undetectable. Asterisk: loss of Lamin B1 from NE of primary nucleus. (B,D,F) Quantification of LAP2, Lamin A/C, and Lamin B1 signals on chromatin bridges of the indicated length classes. Chromatin bridges were classified as positive if the IF signal was contiguous across the entire length of the bridge. Data from >100 chromatin bridges in two independent experiments. Error bars: SEMs. (G) Example of transient NERDI in cells with a chromatin bridge. NLS-3xmTurq2 images at the indicated time points from Movie S4. Bottom: enlargements of the transient NERDI. (H) Duration of NERDI. Data obtained from movies generated with 30 sec interval imaging on 10 cells as in (G). (I) Quantification of the frequency of NERDI events occurring in at least one of the two daughter cells within 6 h of anaphase before and after induction with dox. NERDI was assessed as in (G) but at 5 min intervals over 8 h after anaphase. For the +dox samples, only cells with chromatin bridges were scored. Data from at least two experiments with > 40 anaphases each. *, P ≤ 0.05; ***, P ≤ 0.001 (one-way ANOVA with Tukey’s correction for multiple comparisons). (J) IF of RPA32 (green) with mCherry-Lamin B1 (red) and YOYO-1 stained DNA (blue) in cells with and without Lamin B1 overexpression. Arrows mark chromatin bridges. Note absence of RPA32 on the chromatin bridge in mCherry-Lamin B1 expressing cells. Numbers to the right show quantification (means±SEMs) from >40 chromatin bridges from two independent experiments. P value from Student’s t-test. See also Figure S4 and Movie S4.
Figure 4
Figure 4. TREX1 generates ssDNA in chromatin bridges and promotes resolution
(A) IF for TREX1 (white) on Tp21 cells with and without dox. (B) Images from live-cell imaging of mTurq2-TREX1-D18N on a chromatin bridge (Movie S5). (C) Quantification of TREX1 positive chromatin bridges of the indicated length classes. Positively scored chromatin bridges had at least 5 TREX1 foci. Data from three independent experiments with 100 chromatin bridges each. (D) IF for TREX1 (green) in T2p1 cells with intact (NLS-3xTurq+; arrows) and disrupted (NLS-3xTurq-; arrowhead) micronuclei induced with monastrol. (E) Quantification of TREX1 positive micronuclei as in (D). Over 300 micronuclei were analyzed from three independent experiments. ****, P ≤ 0.0001 (Student’s t-test). (F) Immunoblotting for endogenous TREX1 and exogenous wild type and mutant TREX1 (FLAG) in the indicated cell lines. Par: parental T2p1+H2B-mCherry+mTurq2-RPA70 cells. Cl.2.2 and cl.2.25: TREX1 CRISPR KO clones. Arrowheads: full length FLAG-TREX1. Asterisks: degradation products. (G) Examples of the RPA32 IF in cells as in (F). (H) Quantification of the RPA32 IF intensity on chromatin bridges in cells as in (F). Data was obtained from 55 chromatin bridges from three independent experiments. Bars indicate SDs. **, P ≤ 0.01 (Student’s t-test). (I) Timing of chromatin bridge resolution after anaphase in the indicated cell lines. See legend to Figure 2E. See also related Figure S4 and S5 and MovieS5.
Figure 5
Figure 5. Chromothripsis and kataegis in post-crisis clones 24-141 and X-25
(A) Chromothripsis and rainfall plot of sample 24-141 involving chromosomes 7 and 12. (B) Chromothripsis and rainfall plot of sample X-25 involving chromosomes 4, 13 and X. The unbalanced rearrangements involving chromosomes 8 and 12 may have taken place together with the chromothripsis event. In (A) and (B), top: the arcs represent the two ends of rearrangements. Arcs are grouped from top to bottom by the type of rearrangement orientation as follows: deletion (D; +-); tandem duplication (TD; -+); tail-tail (TT; ++); head-head (HH; --). Middle: estimated copy number over genomic windows. The variant allele frequency (VAF) track is shown below the copy number track. Inferred copy number segments are shown below the VAF track. Bottom: amount of copy number change between copy number segments. Chromothripsis after a duplication will yield three copy number states with copy number steps of +1 or -1. Duplication after chromothripsis will yield some copy number steps of +2 or -2. Filled circles: positions of point mutations colored by mutation type. The Y-axis shows the distance of each mutation to the next on the same chromosome, with the respective axis on the right-hand side of the graph. Red arrows: kataegis clusters. See also related Figure S6 and S7.
Figure 6
Figure 6. Mutational patterns of kataegis in post-crisis clones
(A) A chromothripsis-associated kataegis in sample 24-141 on chromosome 7. (B) A kataegis event in sample X-25 on chromosome X. This kataegis event took place on a chromosome with evidence for chromothripsis, but the rearrangements associated with the kataegis event do not appear to be part of the chromothripsis (Figure 5B). For both (A) and (B), the top panel shows raw read coverage of the region. The horizontal arrows indicate the positions of rearrangements. The two horizontal lines in the middle panel represent the forward and reverse strands. The pyrimidine strands of the mutations called are indicated by their placement on one of the two strands. Mutations are colored by mutation type. The bottom panel magnifies the mutation cluster regions and shows mutation contexts. (C) The number of kataegis events grouped by their association with rearrangements as follows. From top to bottom: kataegis events within 10 kb of a chromothripsis rearrangement; kataegis events on a chromothripsis chromosome within 10 kb of a non-chromothripsis rearrangement; kataegis events on a chromothripsis chromosome with no rearrangements within 10 kb; kataegis events on a non-chromothripsis chromosome within 10 kb of a rearrangement; and kataegis events on non-chromothripsis chromosome with no rearrangements within 10 kb. (D) The distance of each of the 31 detected kataegis events to their nearest respective rearrangement breakpoint. (E) The frequency distribution of mutation types in the detected kataegis clusters. (F) The nucleotide context around the mutated cytosine grouped by cytosine mutation type. The relative positions shown are on the pyrimidine (cytosine) strand. The Y-axes show the fraction of each nucleotide on the pyrimidine strand. See also related Figure S7.
Figure 7
Figure 7. The fate of dicentric chromosomes formed in telomere crisis
Telomere fusions in telomere crisis give rise to anaphase bridges that persist and develop into chromatin bridges. Cells with chromatin bridges undergo frequent NERDI and TREX1 accumulates on the chromatin bridge. TREX1 generates RPA-marked ssDNA in the chromatin bridge before their resolution. The RPA marked bridge remnants eventually join the primary nucleus where DNA repair and APOBEC3A/B editing are inferred to take place. Clonal descendants derived from telomere crisis cells show chromothripsis and kataegis.

References

    1. Artandi SE, Chang S, Lee SL, Alson S, Gottlieb GJ, Chin L, DePinho RA. Telomere dysfunction promotes non-reciprocal translocations and epithelial cancers in mice. Nature. 2000;406:641–5. - PubMed
    1. Artandi SE, DePinho RA. Telomeres and telomerase in cancer. Carcinogenesis. 2010;31:9–18. - PMC - PubMed
    1. Bennink ML, Leuba SH, Leno GH, Zlatanova J, de Grooth BG, Greve J. Unfolding individual nucleosomes by stretching single chromatin fibers with optical tweezers. Nat Struct Biol. 2001;8:606–610. - PubMed
    1. Bignell GR, et al. Architectures of somatic genomic rearrangement in human cancer amplicons at sequence-level resolution. Genome Res. 2007;17:1296–1303. - PMC - PubMed
    1. Burns MB, et al. APOBEC3B is an enzymatic source of mutation in breast cancer. Nature. 2013a;494:366–370. - PMC - PubMed

Publication types