. 2015 Dec 17;163(7):1796-806.
doi: 10.1016/j.cell.2015.11.061.

SPED Light Sheet Microscopy: Fast Mapping of Biological System Structure and Function

Affiliations

SPED Light Sheet Microscopy: Fast Mapping of Biological System Structure and Function

Raju Tomer et al. Cell. .

Abstract

The goal of understanding living nervous systems has driven interest in high-speed and large field-of-view volumetric imaging at cellular resolution. Light sheet microscopy approaches have emerged for cellular-resolution functional brain imaging in small organisms such as larval zebrafish, but remain fundamentally limited in speed. Here, we have developed SPED light sheet microscopy, which combines large volumetric field-of-view via an extended depth of field with the optical sectioning of light sheet microscopy, thereby eliminating the need to physically scan detection objectives for volumetric imaging. SPED enables scanning of thousands of volumes-per-second, limited only by camera acquisition rate, through the harnessing of optical mechanisms that normally result in unwanted spherical aberrations. We demonstrate capabilities of SPED microscopy by performing fast sub-cellular resolution imaging of CLARITY mouse brains and cellular-resolution volumetric Ca(2+) imaging of entire zebrafish nervous systems. Together, SPED light sheet methods enable high-speed cellular-resolution volumetric mapping of biological system structure and function.


Figures

Figure 1
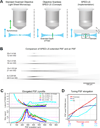
Figure 1. SPherical-aberration-assisted Extended Depth-of-field (SPED) light sheet microscopy
(A) SPED light sheet concept compared with standard light-sheet microscopy (left). In standard light-sheet scanning (left), the light-sheet and the detection objective are moved synchronously to acquire a 3-dimensional volume. The detection objective is typically mounted on a piezo motor for synchronous z-scanning. This design limits the speed of imaging (1–3 volumes per second) because of the mass of the objective and also limits the depth coverage to the piezo travel range (typically a few hundred microns). SPED light sheet scanning (middle) combines a greatly extended depth of field with the optical sectioning of light sheet to provide the capacity to scan thousands of volumes per second. A simple and scalable new method (right) was developed to extend the PSF by more than an order of magnitude. The method involves placing of a block of higher (or lower) refractive index (nb) material between the objective and the sample to induce spherical aberrations that elongate the PSF. t, thickness of the block. (B) A comparison of the native PSF of an objective (measured in air) with the elongated PSF, for four different objectives: Olympus 20×/0.4NA/12mm WD/Air, Nikon 10×/0.3NA/16mm WD/Air, Olympus 10×/0.25NA/21mm WD/Air and Olympus 4×/0.28NA/29.5mm WD/Air + Water (5mm). The 3-dimensional SPED light sheet empirical PSF measurements for each objective were obtained (Methods) by scanning 1 µm-diameter beads and the light sheet synchronously (thus maintaining the uniform illumination of beads) along the z-axis, while keeping the detection objective stationary. Individual bead images (n >= 5) were manually extracted from the 3D image volume to generate the final average PSFs. A block of refractive index (1.454) liquid was used to span the entire available working distance of the objective (see Figure S1 for further details). (C) Characterization of PSF elongation. Top graph plots the fold change in lateral FWHM of the PSF as function of z-position relative to the minimum FWHM of the nonextended air PSF of the same objective. The distribution shows that the lateral extent of the PSF (i.e. lateral resolution) remains largely unchanged for several hundred microns. Note: 4× / 0.28 NA objective is designed for air and 5 mm thick water layer, because of which the PSF measured in air shows aberrations. Bottom graph plots the maximum intensity of the PSF as a function of depth. (D) Simulations of the SPED microscope were performed to assess the effect of the SPED-LS system parameters: Refractive Index (RI) of the block, its thickness (t) and the NA of the detection objective used. The PSF elongation increases rapidly and reach saturation with increasing RI of the block, increases linearly with the RI block thickness and increases non-linearly with the increasing NA of the detection objective used. See also Figures S1–S2 and Movie S1 for details of SPED-LS implementation and PSF simulations.
Figure 2
Figure 2. SPED light sheet microscopy implementation
(A) One or two light-sheets (second identical light-sheet illumination path is not shown in the figure) are created from opposite sides, and the emitted signal is detected with an orthogonal wide-field detection arm. In addition, a block of higher refractive index material is placed between the objective and the sample to induce uniform spherical aberrations for PSF elongation. The illumination arm includes laser source, filter wheel, shutter, x-y 2d galvanometer scanner, scan lens, tube lens, mirror and the illumination objective. The detection arm contains a detection objective, filter wheel, tube lens and sCMOS camera. (B) First SPED prototype as implemented on the CLARITY-optimized light-sheet microscopy (COLM) backbone (Tomer et al., 2014). The large horizontal COLM sample chamber was filled with a specific refractive index (nb) liquid (1.454 was used for the majority of experiments) to implement the requisite refractive index block for inducing spherical aberration-based PSF extension. Lens tubes (containing quartz glass cover slips for separating the objectives from RI liquid) of varying lengths were used to achieve varying RI block thickness (t). The same effect can be used on the illumination side to achieve increased field of view while maintaining light sheet thickness. Samples were mounted in custom thin-walled (0.5 mm thick) quartz glass cuvettes. All parts are as described in detail for the COLM framework (Tomer et al., 2014). Although the first prototype is implemented on the COLM backbone, SPED is easily adaptable to any light sheet microscope by incorporating a liquid or solid block of transparent material of defined thickness and refractive index to achieve desired axial elongation of the system PSF.
Figure 3
Figure 3. SPED light sheet imaging depth characterization
1 mm deep volumes of clarified Thy1-eYFP transgenic mouse brain were imaged with SPED light sheet microscopy and with CLARITY-optimized light sheet microscopy (COLM) using a 4×/0.28NA objective to assess the SPED imaging depth. (A) compares the x-y projections and (B) the x-z projections of the raw SPED light sheet image volume, after deconvolution using standard Richardson-Lucy deconvolution with the empirically measured PSF and the standard COLM imaging by moving the sample through stationary light-sheet and in-focus detection objective. (C) Volume rendering of the SPED light sheet volume. Note that because of the low magnification (4×) of the imaging objective, the pixel sampling size was ~1.46 microns which is not sufficient to visualize finer details such as dendritic spines or thinner axons. See also Figure S3 and Movie S2 for detailed comparison of SPED raw and deconvolved data with the COLM imaging, and Figure S4 for a detailed description of the deconvolution pipeline.
Figure 4
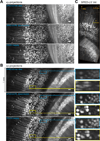
Figure 4. Cellular-resolution imaging of the entire larval zebrafish central nervous system with SPED light sheet microscopy
Volume renderings of 10 dpf Tg(elavl3:H2B-GCaMP6s) zebrafish larvae imaged with 4×/0.28NA (A) and 10×/0.25NA (B) objectives demonstrate the large field of view of SPED microscopy, while maintaining cellular resolution. Cyan and magenta boxes provide magnified views. (A) Image volumes of 10 consecutive time points were collapsed into one volume by taking the maximum values voxel-wise across the recording duration. The bounding box size is 0.75mm × 2.99mm × 0.48mm. (B) Image volumes of 7 consecutive time points were collapsed into one volume by taking the maximum values voxelwise across the recording duration. The bounding box size is 0.65mm × 1.20mm × 0.30mm. See Movies S3, S4 for detailed 3-dimensional rendering and Figure S5 for comparison of raw and deconvolved data.
Figure 5
Figure 5. Comparing resolution of light field microscopy (LFM) and SPED light sheet methods
Three-dimensional volumes were acquired from a 10 dpf Tg(elavl3:H2B-GCaMP6s) zebrafish larva with LFM and SPED light sheet microscopy, using 10×/0.6NA (water immersion, Olympus) objective with 500 ms exposure and 10×/0.3NA (air, Olympus) objectives with 460 ms exposure respectively. SPED light sheet images in Figure 6B were acquired with less than 100 ms exposure/volume, still yielding cellular resolution. Scale bars: 100 µm.
Figure 6
Figure 6. Rapid cellular-resolution functional mapping of the entire larval zebrafish nervous system
The camera-frame-rate limited volumetric imaging speed of SPED light sheet is demonstrated by performing rapid cellular-resolution functional mapping of the nervous system of 10 dpf Tg(elavl3:H2B-GCaMP6s) zebrafish larvae. Three smaller regions of interests (ROIs) of the camera frame were used to image: (A) the entire nervous system with a 4×/0.28 NA objective at 6.23 volumes per second (3mm × 0.5mm × 0.2mm, 39 z-slices), (B) the whole brain with a 4×/0.28NA objective at 12 volumes per second (0.9mm × 0.4mm × 0.2mm, 40 z-slices), and (C) the whole brain and anterior spinal cord with a 10×/0.25NA objective at 4.14 volumes per second (1.2mm × 0.43mm × 0.2 mm, 39 z-slices). The maximum intensity projection images were generated from a collapsed 3D volume generated by voxel-wise standard deviation across the entire recording durations. Cellular resolution is demonstrated by several examples of activity traces (ΔF/F vs. time) of neurons marked by colored arrows, and of neighboring cells shown in optical slices from respective volumes and their automated 3D segmentation. See Figures S6 for the top 99 example activity traces (ordered according to the variance across time) from the three datasets, Movies S5–S7 visualize the activity time series (ΔF/F vs. time) of these datasets, and Movie S8 shows details of automated 3D segmentation.
Figure 7
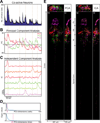
Figure 7. Population analysis of global zebrafish central nervous system activity recorded by SPED light sheet microscopy
Principal component analysis (PCA) and independent component analysis (ICA) were used to analyze the population dynamics of neurons spread across the entire zebrafish larva central nervous system. The dataset was acquired using a 4×/0.28 NA objective at 6.23 volumes/sec (as in Figure 5A). ΔF/F activity profiles of all cells were first filtered to identify active neurons by choosing a noise level corresponding to 5% false positive rate as the cutoff, followed by PCA and ICA; early time points that may represent nonspecific responses to initial laser illumination were excluded from analysis. (A) Number of co-active neurons as a function of time across the recording duration. (B) Temporal traces of top three principal components (PC) shown in red, green and magenta respectively. Y-axis represents arbitrary units in PCA space. (C) Temporal traces of 6 recovered independent components (IC) out of 10 (filtered to retain traces in which the sum of minimum and maximum values was greater than zero); units are arbitrary. The dotted lines across panels indicate peaks in the ICs that correspond to the peaks in PCA and cellular activity. (D) Eigenvalues for the top 100 dimensions of cellular (top) and time points (bottom) principal components. Dashed lines mark the top 3 cellular and the top 20 temporal PCA dimensions, which were used in (B) and for data “whitening” before ICA (methods) in (C). (E) Spatial plots of each PC coefficient (absolute value) and each IC (absolute value) were generated to visualize the locations and identities of the neurons associated with each component. Different components were combined into multi-color images (each color corresponding to coloring of the temporal traces in B and C) after scaling for contrast. Images shown are maximum intensity projections through x, y or z. Fb, Forebrain; Mb, midbrain, Hb, Hindbrain.

References

    1. Abrahamsson S, Chen J, Hajj B, Stallinga S, Katsov AY, Wisniewski J, Mizuguchi G, Soule P, Mueller F, Dugast Darzacq C, et al. Fast multicolor 3D imaging using aberration-corrected multifocus microscopy. Nat Methods. 2013;10:60–63. - PMC - PubMed
    1. Abrahamsson S, McQuilken M, Mehta SB, Verma A, Larsch J, Ilic R, Heintzmann R, Bargmann CI, Gladfelter AS, Oldenbourg R. MultiFocus Polarization Microscope (MF-PolScope) for 3D polarization imaging of up to 25 focal planes simultaneously. Opt Express. 2015;23:7734–7754. - PMC - PubMed
    1. Ahrens MB, Orger MB, Robson DN, Li JM, Keller PJ. Whole-brain functional imaging at cellular resolution using light-sheet microscopy. Nat Methods. 2013;10:413–420. - PubMed
    1. Bouchard MB, Voleti V, Mendes CS, Lacefield C, Grueber WB, Mann RS, Bruno RM, Hillman EM. Swept confocally-aligned planar excitation (SCAPE) microscopy for high speed volumetric imaging of behaving organisms. Nat Photonics. 2015;9:113–119. - PMC - PubMed
    1. Broxton M, Grosenick L, Yang S, Cohen N, Andalman A, Deisseroth K, Levoy M. Wave optics theory and 3-D deconvolution for the light field microscope. Opt Express. 2013;21:25418–25439. - PMC - PubMed

Publication types