. 2016 Jan 11;26(1):38-51.
doi: 10.1016/j.cub.2015.11.034. Epub 2015 Dec 10.

Shadow Enhancers Are Pervasive Features of Developmental Regulatory Networks

Affiliations

Shadow Enhancers Are Pervasive Features of Developmental Regulatory Networks

Enrico Cannavò et al. Curr Biol. .

Abstract

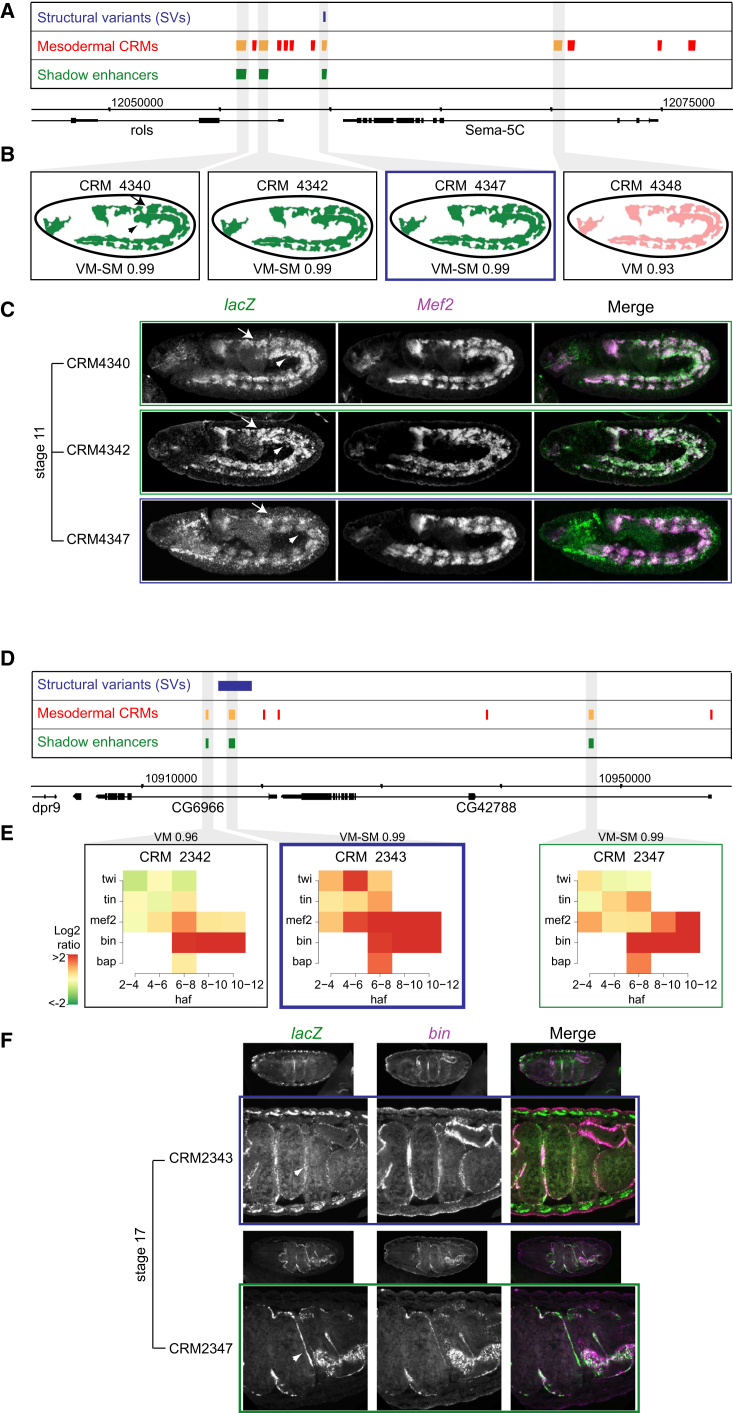
Embryogenesis is remarkably robust to segregating mutations and environmental variation; under a range of conditions, embryos of a given species develop into stereotypically patterned organisms. Such robustness is thought to be conferred, in part, through elements within regulatory networks that perform similar, redundant tasks. Redundant enhancers (or "shadow" enhancers), for example, can confer precision and robustness to gene expression, at least at individual, well-studied loci. However, the extent to which enhancer redundancy exists and can thereby have a major impact on developmental robustness remains unknown. Here, we systematically assessed this, identifying over 1,000 predicted shadow enhancers during Drosophila mesoderm development. The activity of 23 elements, associated with five genes, was examined in transgenic embryos, while natural structural variation among individuals was used to assess their ability to buffer against genetic variation. Our results reveal three clear properties of enhancer redundancy within developmental systems. First, it is much more pervasive than previously anticipated, with 64% of loci examined having shadow enhancers. Their spatial redundancy is often partial in nature, while the non-overlapping function may explain why these enhancers are maintained within a population. Second, over 70% of loci do not follow the simple situation of having only two shadow enhancers-often there are three (rols), four (CadN and ade5), or five (Traf1), at least one of which can be deleted with no obvious phenotypic effects. Third, although shadow enhancers can buffer variation, patterns of segregating variation suggest that they play a more complex role in development than generally considered.

Keywords: development; enhancer; redundancy; robustness; shadow enhancer; transcriptional networks.


Figures

Figure 1
Figure 1
Frequency of Enhancers Pairs with Similar versus Identical Activity The level of similarity (partial overlap) in tissue expression of enhancers (A and B) and genes (C and D) within 50 kb windows of each other, compared to what would be expected by chance. Vertical red line represents the observed data, and the histogram and associated density plots show the values achieved from randomly shuffling enhancers/genes in the genome. (A) The Euclidean distance was used to summarize the (multidimensional) distance between pairs of enhancers in tissue expression space. Plotted here is the median Euclidean distance for the observed (red line) and expected (gray histogram) distribution of enhancers with similar tissue expression. (B) Number of co-located enhancers with identical spatiotemporal activity. (C) Median Euclidean distance (measure of similarity in multidimensional tissue expression) between co-located genes (within 50 kb of each other). (D) Number of co-located genes with identical patters of expression.
Figure 2
Figure 2
Genome-wide Prediction of Shadow Enhancers Two complementary criteria used to identify shadow enhancers throughout the genome: (A) Enhancers with highly correlated TF occupancy, using ChIP data from 15 conditions for mesoderm/muscle TFs [33], within 50 kb of each other and an associated gene with mesoderm and/or muscle expression. An example of a locus with two enhancers (CRM868 and CRM869) that have highly correlated binding (rho = 0.85; predicted shadow enhancers) compared to one that is not (CRM870) is shown. The bottom panels show the similarity (or dissimilarity) of TF binding as heatmaps using the ChIP peak height (red, high, to white, unbound), with TFs indicated on the y axis and developmental time (hr) on the x axis. (B) Enhancers with similar activity, predicted for all 8,008 mesodermal enhancers using a support vector machine (SVM) [33]. Enhancers within a 50 kb window of each other, with the same predicted expression (SVM score ≥0.95) and associated with a gene expressed in the same tissue were defined as shadow enhancers. The predicted tissue expression of enhancers is represented by cartoons. In (A) and (B), ChIP-chip data for the TFs Twist (red), Tin (green), Mef2 (blue), and Bin (purple) at different developmental time windows (2–4 hr, 4–6 hr, 6–8 hr, and 8–10 hr) are shown.
Figure 3
Figure 3
Shadow Enhancers in the rols and CG42788 Loci Predicted shadow enhancers based on similarity in activity (rols; A–C) or TF occupancy (CG42788; D–F). (A) rols locus showing structural variants (blue), mesodermal cis-regulatory modules defined by TF-ChIP (CRMs; red), and shadow enhancers (green). (B) Predicted spatial expression of enhancers. Tissue class and SVM score are shown at bottom. VM-SM, visceral muscle-somatic muscle; VM, visceral muscle. (C) Double FISH of transgenic embryos showing lacZ reporter (green) under the transcriptional control of three shadow enhancers (CRM4340, CRM4342, and CRM4347) with the pan-mesoderm/muscle marker Mef2 (magenta). CRM4347 is deleted by an SV (blue, A) and has overlapping expression with CRM4340 and CRM4342 (B and C). SM is indicated by arrows and VM by arrowheads in (D) and (C). A fourth enhancer, CRM4348, which was not predicted to be a shadow enhancer, drives expression in ectodermal strips (data not shown). (D) CG42788 locus showing structural variants (blue), mesodermal cis-regulatory modules (CRMs; red), and shadow enhancers (green). (E) Three shadow enhancers predicted based on both similar activity and highly correlated TF occupancy. The heatmap shows the ChIP peak height signal for each factor/time point. SVM prediction and score are shown above. (F) Double FISH of transgenic embryos showing lacZ reporter (green) under the transcriptional control of two shadow enhancers (CRM2343 and CRM2347) with the visceral muscle (VM) marker biniou (bin) (magenta). CRM2343 is completely deleted by an SV (A) and has overlapping expression with CRM2347. VM is indicated by the white arrowhead. CRM2342 did not share regions of spatial overlap with the other enhancers. Enhancers tested in transgenic embryos are indicated in orange. All embryos oriented with anterior to the left and dorsal at the top. See also Figures S2–S4.
Figure 4
Figure 4
Shadow Enhancers in ade5 Locus (A) ade5 locus showing structural variants (blue), mesodermal cis-regulatory modules (CRMs; red), shadow enhancers (green). Enhancers tested in transgenic embryos are indicated in orange. (B) Predicted spatial activity of enhancers and SVM scores. VM-SM, visceral muscle-somatic muscle. (C) Double FISH of transgenic embryos showing lacZ reporter (green) under the transcriptional control of four shadow enhancers (CRM7483, CRM7487/88, CRM7489, and CRM7490) with the pan-mesoderm/muscle marker Mef2 (magenta). SM is indicated by arrows and VM by arrowheads in (B) and (C). CRM7490 is almost completely deleted by an SV (blue, A) and has overlapping expression with CRM7483, CRM7487-88, and CRM7489 (green) in VM. More stages are shown in Figure S5. All embryos oriented with anterior to the left and dorsal at the top. See also Figures S2 and S5.
Figure 5
Figure 5
Complexity of Traf1 Regulation (A) Traf1 locus showing structural variants (blue), mesodermal cis-regulatory modules (CRMs; red), and shadow enhancers (green). Enhancers tested in transgenic embryos are indicated in orange. (B) Predicted spatial activity of enhancers and SVM scores are shown. Meso, mesoderm; Meso-SM, mesoderm and somatic muscle. Three shadow enhancers were predicted (CRM5432, CRM5435/6, and CRM5437) and two additional tested below the applied SVM specificity score (CRM5429 and CRM5440). (C) Double FISH of transgenic embryos showing lacZ reporter (green) under the transcriptional control of five shadow enhancers (CRM5429, CRM5432, CRM5435/6, CRM5437, and CRM5440) with the early mesoderm marker Twist (Twi; magenta). Mesoderm is indicated by arrowheads in (B) and (C). CRM5435/6 is almost completely deleted by an SV (blue, A) and has overlapping expression with CRM5429, CRM5432, and CRM5440 in the mesoderm. All embryos oriented with anterior to the left and dorsal at the top. See also Figures S2 and S5.
Figure 6
Figure 6
CadN Locus Has Many Enhancers with Partially Overlapping Activity (A) CadN locus showing structural variants (blue), mesodermal cis-regulatory modules (CRMs; red), and shadow enhancers (green). Enhancers tested in transgenic embryos are indicated in orange. (B) Shadow enhancers predicted based on both similarity in activity and correlated TF occupancy. The heatmap shows ChIP peak height signal for each factor/time point. SVM prediction and score are shown above. (C) Double FISH of transgenic embryos showing lacZ reporter (green) under the transcriptional control of four enhancers (CRM6248, CRM6250, CRM6252/3, and CRM6254) with the early mesoderm marker Twist (Twi; magenta). CRM6248 is partially deleted by an SV (blue, A) and has overlapping expression with CRM6250 and two additional CRMs just below the applied cutoff (CRM6252 and CRM6254) in the presumptive mesoderm. Double FISH for lacZ (green) and the marker expressed early in the mesoderm Twist (magenta). All embryos oriented with anterior to the left and dorsal at the top. See also Figure S2.
Figure 7
Figure 7
Conservation and Selection of Shadow Enhancers (A) Difference in conservation level (median PhastCons) of shadow versus non-redundant enhancers (Wilcoxon rank-sum test, ∗∗∗p < 0.001). (B) Difference in conservation level between shadow enhancers deleted or not by segregating SVs within a natural population (Wilcoxon rank-sum test, ∗∗p < 0.01). (C) Biological process enrichment for genes with shadow enhancers; significant terms are shown (based on Fisher’s exact test, p < 0.05). See also Figure S1.

Similar articles

Cited by

References

    1. Degenhardt K.R., Milewski R.C., Padmanabhan A., Miller M., Singh M.K., Lang D., Engleka K.A., Wu M., Li J., Zhou D. Distinct enhancers at the Pax3 locus can function redundantly to regulate neural tube and neural crest expressions. Dev. Biol. 2010;339:519–527. - PMC - PubMed
    1. Hong J.-W., Hendrix D.A., Levine M.S. Shadow enhancers as a source of evolutionary novelty. Science. 2008;321:1314. - PMC - PubMed
    1. Frankel N., Davis G.K., Vargas D., Wang S., Payre F., Stern D.L. Phenotypic robustness conferred by apparently redundant transcriptional enhancers. Nature. 2010;466:490–493. - PMC - PubMed
    1. Montavon T., Soshnikova N., Mascrez B., Joye E., Thevenet L., Splinter E., de Laat W., Spitz F., Duboule D. A regulatory archipelago controls Hox genes transcription in digits. Cell. 2011;147:1132–1145. - PubMed
    1. Perry M.W., Boettiger A.N., Bothma J.P., Levine M. Shadow enhancers foster robustness of Drosophila gastrulation. Curr. Biol. 2010;20:1562–1567. - PMC - PubMed

Publication types

LinkOut - more resources