Comparative Study
. 2016 Jan 7;61(1):170-80.
doi: 10.1016/j.molcel.2015.11.003. Epub 2015 Dec 10.

A Multiplexed System for Quantitative Comparisons of Chromatin Landscapes

Affiliations
Comparative Study

A Multiplexed System for Quantitative Comparisons of Chromatin Landscapes

Peter van Galen et al. Mol Cell. .

Abstract

Genome-wide profiling of histone modifications can provide systematic insight into the regulatory elements and programs engaged in a given cell type. However, conventional chromatin immunoprecipitation and sequencing (ChIP-seq) does not capture quantitative information on histone modification levels, requires large amounts of starting material, and involves tedious processing of each individual sample. Here, we address these limitations with a technology that leverages DNA barcoding to profile chromatin quantitatively and in multiplexed format. We concurrently map relative levels of multiple histone modifications across multiple samples, each comprising as few as a thousand cells. We demonstrate the technology by monitoring dynamic changes following inhibition of p300, EZH2, or KDM5, by linking altered epigenetic landscapes to chromatin regulator mutations, and by mapping active and repressive marks in purified human hematopoietic stem cells. Hence, this technology enables quantitative studies of chromatin state dynamics across rare cell types, genotypes, environmental conditions, and drug treatments.


Figures

Figure 1
Figure 1. A multiplexed, quantitative and low-input assay for profiling chromatin states
(A) Overview of Mint-ChIP protocol. Following (1) lysis and MNase digestion, (2) a ligation mix inactivates MNase, repairs DNA ends and ligates barcoded T7-adapters to nucleosomes (index #1). (3) Indexed samples are pooled and then split for parallel ChIP assays. (4) DNA is isolated and amplified by in vitro transcription, yielding RNA, which is then (5) reverse transcribed. (6) PCR amplification yields (7) an Illumina sequencing library (index #2). (8) Sequencing data are demultiplexed in silico based on their barcodes, yielding profiles for each sample (index #1) and each mark (index #2). (B) Plot depicts proportions of Mint-ChIP reads that align to the human or mouse genomes. X-axis indicates the relative ratios of T7-adapter-ligated chromatin (human) to carrier chromatin (mouse). The mouse carrier lacks T7-adapters and is not amplified or sequenced. Data is shown as mean ± SD of 4 ChIP assays × 5 MNase concentrations. (C) Pie charts indicate T7-adapter barcode representations in Mint-ChIP sequencing data for total H3. These data validate the Mint-ChIP procedures for indexing and pooling chromatin and in silico demultiplexing. (D) Four human samples (K562, T7-adapter barcode 1–4) and two mouse samples (YAC-1, T7-adapter barcode 5–6) were indexed, pooled and split for three parallel Mint-ChIP assays. Plot depicts the proportions of reads for each barcode that align to the human or mouse genomes. Data is shown as mean ± SD of 3 ChIP assays. See also Fig. S1.
Figure 2
Figure 2. Validation of chromatin data and sensitivity to low-input samples
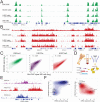
Data tracks show (A) H3K4me3 and (B) H3K27me3 profiles derived by Mint-ChIP using indicated starting cell numbers. For comparison, ENCODE data generated by conventional ChIP-seq is also shown. (C) Density plots compare Mint-ChIP and ENCODE data for K562 cells. Datapoints compare the number of reads in Mint-ChIP (x-axis) vs. ENCODE (y-axis) for all promoter intervals (H3K4me3), H3K27ac peaks called from ENCODE data (H3K27ac) or all annotated transcripts (H3K27me3). R indicates Pearson correlation. (D) Workflow for hematopoietic stem cell analysis. CD34+CD38CD45RA cells were isolated from human bone marrow by flow cytometry. Mint-ChIP was used to analyze histone modifications. (E) Data tracks show H3K27ac, H3K27me3 and H3K36me3 profiles of hematopoietic stem cells at the HOXA locus. (F) Density plots depict correlation between methylation within genes (H3K36me3 and H3K27me3) and mRNA expression in human hematopoietic stem cells. Each data point corresponds to a single gene; some genes are highlighted as examples. See also Fig. S1.
Figure 3
Figure 3. Mint-ChIP quantitative normalization clarifies global differences in histone modification levels
(A) Graphic for Mint-ChIP quantitative normalization. Control or drug treated cells are indexed, pooled and then split for parallel ChIP assays. The ratio between H3K27me3 reads and H3 reads is used to compare global H3K27me3 levels between samples and normalize corresponding profiles. (B) Western blot shows H3K27ac and H3K27me3 levels in K562 cells following treatment with the p300 inhibitor C646 or the EZH2 inhibitor GSK126 (compared to DMSO control). Total H3 is shown as a loading control. (C) Bar plots show global modification levels inferred from western blot (top) or Mint-ChIP (bottom). The respective methods were applied in parallel to the same sample of K562 cells treated for 48 hours with the indicated inhibitors. Data is shown as mean ± SD of n = 3 independent experiments (symbols indicate values from independent experiments). (D) Diagram explains difference between normalization methods. Global differences in histone modification levels (e.g. by demethylase inhibition) may be masked by conventional ChIP-seq signal normalization (RPM). In contrast, quantitative normalization enables direct peak height comparisons between samples. (E) Western blot shows increased H3K4me3 levels in K562 cells following treatment with the demethylase inhibitor KDM5-C70. Total H3 is shown as a loading control, n = 3 experiments are shown. (F) Bar plots show global H3K4me3 levels inferred from Mint-ChIP. Data is shown as mean ± SD of 4 replicates; n = 3 experiments are shown. (G) Data tracks show H3K4me3 profiles, scaled by conventional or quantitative normalization. (H) Composite plot depicts average H3K4me3 signals in K562 cells treated with DMSO or KDM5-C70. Ten kb regions surrounding the centers of 36,875 peaks are shown. (I) Barplot shows the fraction of peaks within size windows. Peaks of >10 kb were classified as 10 kb such that the total area is one. (J) Venn diagram shows the number of peaks detected in K562 cells treated with DMSO or KDM5-C70. See also Fig. S2.
Figure 4
Figure 4. Quantitative normalization resolves distinct chromatin landscapes resulting from cancer mutations and drug treatment
(A-B) Heatmaps compare H3K27me3 or H3K27ac levels in different cell lines treated with GSK126, as quantified by Mint-ChIP. These experiments were performed using 2 different MNase concentrations, which are typically averaged. (C) Bar plot shows mass spectrometry quantification of H3K27ac in Pfeiffer, SKM-1 and Toledo (Jaffe et al., 2013). The mass spectrometry data match the normalized Mint-ChIP data. (D) Composite plots depict average H3K27ac signals over 20 kb regions surrounding the centers of 23,176 peaks. Values were computed by conventional normalization, wherein signal is relative to total read numbers (RPM, left) or by the quantitative normalization afforded by Mint-ChIP (right). (E) Bar plots depict viable cell counts following 72 hour GSK126 treatment of Pfeiffer, SKM-1 and Toledo. Data is shown as mean ± SD of technical triplicates × n = 2 independent experiments (* P < 0.05, ** P < 0.01, **** P < 0.0001). (F) Composite plots depict average H3K27me3 signals over 40 kb regions surrounding the centers of 2,052 peaks. Together, these data demonstrate the unique capacity of Mint-ChIP to quantitatively map and compare chromatin landscapes and modification levels between cell types and epigenetic inhibitor treatments. See also Fig. S3-4.

References

    1. Adli M, Zhu J, Bernstein B. Genome-wide chromatin maps derived from limited numbers of hematopoietic progenitors. Nat. Methods. 2010;7:615–8. - PMC - PubMed
    1. Andersen C, Asmar F, Klausen T, Hasselbalch H, Grønbæk K. Somatic mutations of the CREBBP and EP300 genes affect response to histone deacetylase inhibition in malignant DLBCL clones. Leuk Res Rep. 2012:2. - PMC - PubMed
    1. Bonhoure Bounova, Bernasconi Praz, Lammers Canella, Willis Herr, Hernandez Delorenzi, et al. Quantifying ChIP-seq data: a spiking method providing an internal reference for sample-to-sample normalization. Genome Research. 2014;24:1157–1168. - PMC - PubMed
    1. Brind’Amour J, Liu S, Hudson M, Chen C, Karimi M, Lorincz M. An ultra-low-input native ChIP-seq protocol for genome-wide profiling of rare cell populations. Nat Comms. 2015:6. - PubMed
    1. Chabbert CD, Adjalley SH, Klaus B, Fritsch ES, Gupta I, Pelechano V, Steinmetz LM. A high-throughput ChIP-Seq for large-scale chromatin studies. Molecular Systems Biology. 2015;11:777. - PMC - PubMed

Publication types

MeSH terms