. 2016 Jan 6;89(1):37-53.
doi: 10.1016/j.neuron.2015.11.013. Epub 2015 Dec 10.

Purification and Characterization of Progenitor and Mature Human Astrocytes Reveals Transcriptional and Functional Differences with Mouse

Affiliations

Purification and Characterization of Progenitor and Mature Human Astrocytes Reveals Transcriptional and Functional Differences with Mouse

Ye Zhang et al. Neuron. .

Abstract

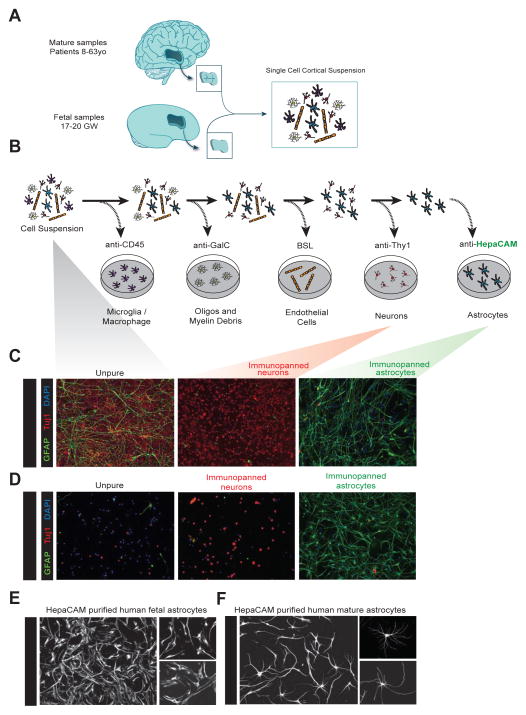
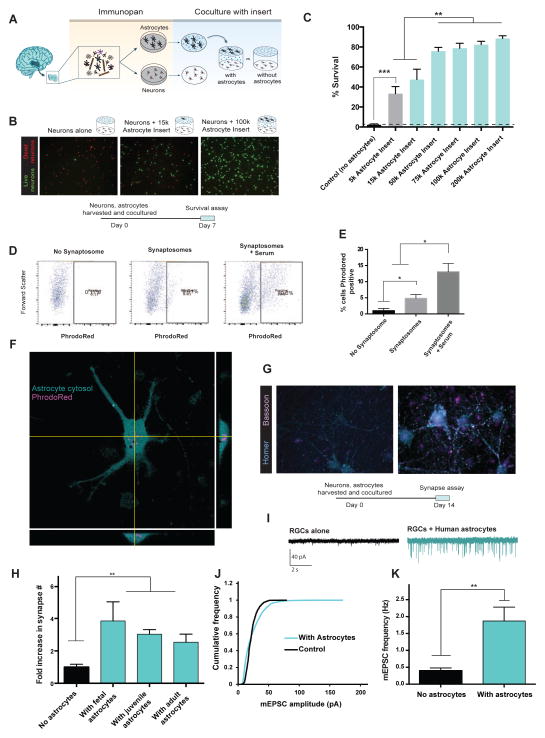
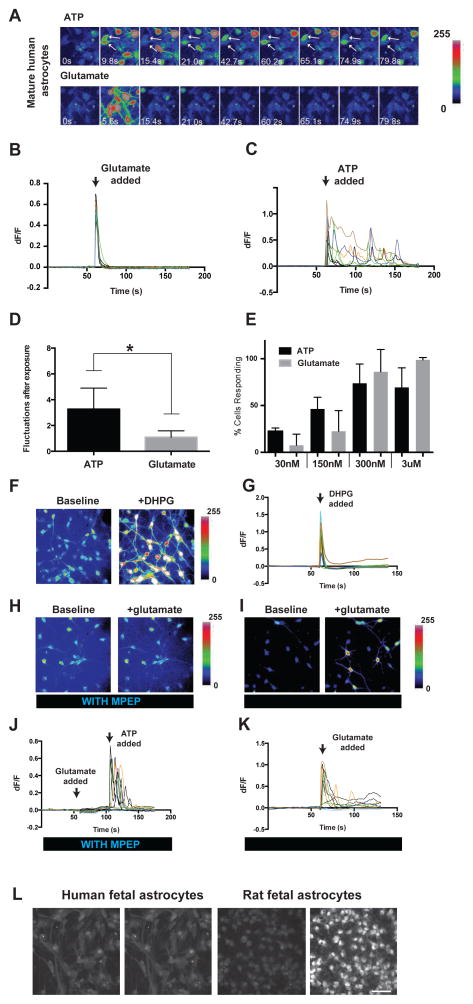
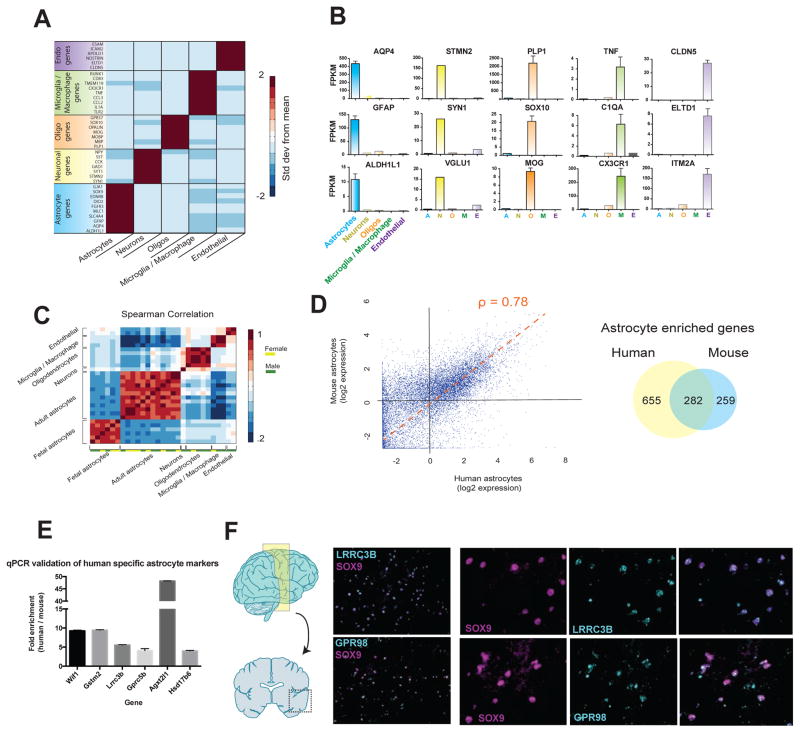
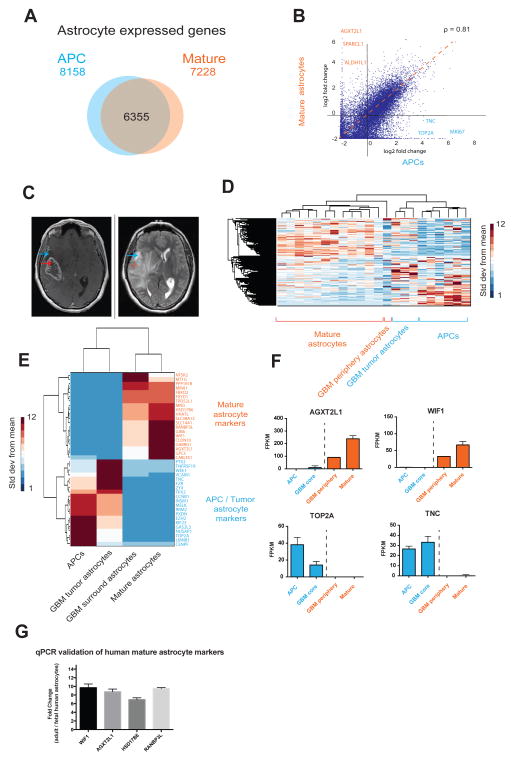
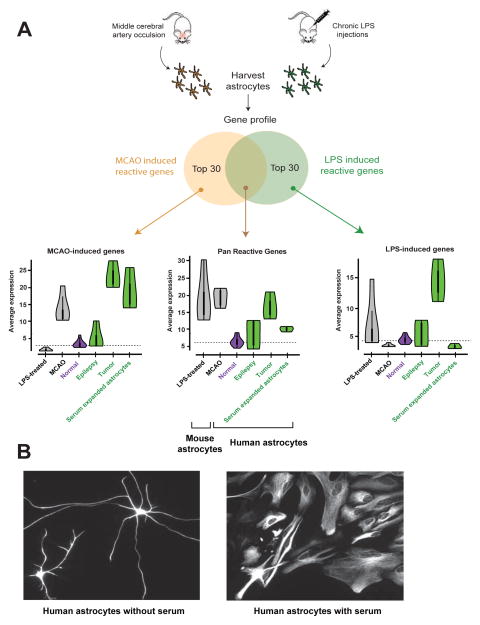
The functional and molecular similarities and distinctions between human and murine astrocytes are poorly understood. Here, we report the development of an immunopanning method to acutely purify astrocytes from fetal, juvenile, and adult human brains and to maintain these cells in serum-free cultures. We found that human astrocytes have abilities similar to those of murine astrocytes in promoting neuronal survival, inducing functional synapse formation, and engulfing synaptosomes. In contrast to existing observations in mice, we found that mature human astrocytes respond robustly to glutamate. Next, we performed RNA sequencing of healthy human astrocytes along with astrocytes from epileptic and tumor foci and compared these to human neurons, oligodendrocytes, microglia, and endothelial cells (available at http://www.brainrnaseq.org). With these profiles, we identified novel human-specific astrocyte genes and discovered a transcriptome-wide transformation between astrocyte precursor cells and mature post-mitotic astrocytes. These data represent some of the first cell-type-specific molecular profiles of the healthy and diseased human brain.


Figures

Figure 1
Figure 1
Acute purification of fetal and mature human astrocytes. A. Juvenile and adult (8 to 63 years old) patient temporal lobe cortex tissue and fetal (17–20 gestational week) brain tissue is first dissociated into single cell suspensions. B. Schematics of immunopanning purification of cell types from human brain samples. C and D. Unpurified brain cells (left), Thy1-purified neurons (middle), and HepaCAM-purified astrocytes (right) from fetal (C) and mature (D) brains stained at 7div for neurons (TuJ1, red), astrocytes (GFAP, green), and nuclei of all cells (DAPI, blue). Scale bars: 100μm. E and F. Cultured human fetal (E) and mature (F) astrocytes grown in culture for 7 days and stained with GFAP. Scale bars: 100μm, insets 50 μm.
Figure 2
Figure 2
Functional characterization of human astrocytes. A. Schematics of co-culture experiments. 17–20 gestation week fetal human astrocytes and neurons were purified by immunopanning, grown in the same wells separated by porous inserts. B. Calcein stain of live neurons (green) and ethidium homodimer stain of dead neurons (red) in the presence and absence of astrocytes. Scale bars: 100μm C. Quantification of survival rate. N=7–8 images per condition. Data represent mean ± SEM in all the figures unless otherwise noted. **, p<0.01. ***, p<0.001. Two-tail unpaired T-test was used for data in C, H, and K. D. Human astrocytes engulf synaptosomes in vitro. FACS plot of human fetal astrocytes incubated without synaptosomes, with synaptosomes, or with synaptosomes and 5% serum. E. Percentages of synaptosome-positive astrocytes. *, p=0.05, one-tailed Wilcoxon rank sum test. n=3 patients. F. Confocal image of a human fetal astrocyte stained with Vibrant CFDA (cyan) engulfing PhrodoRed labeled synaptosomes (magenta) Scale bar: 20μm. G. Retinal ganglion cells form more synapses in the presence of human astrocytes. Cyan: immunofluorescence of post-synaptic marker, Homer. Magenta: immunofluorescence of pre-synaptic marker, Bassoon. Scale bar: 10μm. H. The number of synapses (Homer/Bassoon double positive puncta) in the presence and absence of human astrocytes. N=10–20 images per patient. Each image contains on average two cells. Fetal: 1 patient, age: 18 gw. Juvenile: 3 patients, age: 8, 13, 18 yo. Adult: 3 patients, age: 26, 41, 47 yo. **, p<0.01. I. Representative traces of whole-cell patch clamp recordings from RGCs cultured with or without feeder layers of human astrocytes in the presence of TTX. Few mEPSCs were observed without feeder layers of human astrocytes. J. Human astrocytes significantly increased the amplitude of mEPSCs (p=.0001 Kolmogorov-Smirnov test, n= 488 and 2837 mEPSCs from 16 and 18 cells for no astrocyte and with astrocytes respectively). K. The frequency of mEPSCs was significantly increased in the presence of human astrocytes (Two-tailed Wilcoxon rank sum test. p=0.004. n = 16–18 neurons per condition).
Figure 3
Figure 3
Calcium responses of human astrocytes in vitro. A. Representative images of calcium responses to 3μM ATP (top) and glutamate (bottom) of mature human astrocytes (21 yo). Time is labeled in each image. Arrows point to two cells showing calcium fluctuations in response to ATP. B, C. ΔF/F of all cells in (A). Each ΔF/F trace represents a single cell. D. Average number of calcium fluctuations in human astrocytes after exposure to ATP or glutamate. N=11 movies. Concentration of ATP and Glutamate: 30nM–3μM. Two-tailed Wilconxon rank-sum test. *, p<0.05. E. Percentage of cells responding to ATP or glutamate at different concentrations. Cells with ΔF/F >5% are counted as responsive. N=3–5 movies per condition. Each movie has 5–20 cells. Data were collected from 2 patients 21 and 26 years of age, respectively. F. Fluo4-AM fluorescence of adult human astrocytes before and after addition of DHPG (200μM). G. ΔF/F of adult human astrocytes before and after addition of DHPG. H. Fluo4-AM fluorescence of adult human astrocytes before and after addition of 3 μM glutamate in the presence of 25 μM MPEP. I. Fluo4-AM fluorescence of adult human astrocytes before and after addition of 3 μM glutamate after washing out MPEP for 30 minutes. J. ΔF/F of adult human astrocytes before and after addition of 3 μM glutamate and 3 μM ATP in the presence of 25 μM MPEP. Arrowheads represent addition of glutamate or ATP K. ΔF/F of adult human astrocytes before and after addition of 3 μM glutamate after washing out MPEP. L. Representative images of calcium responses to 3μM glutamate in fetal human (17–20 gestation week, left) and rat (E18.5, right) astrocytes. Scale bar: 50μm.
Figure 4
Figure 4
RNA-seq transcriptome profiling of acutely purified human neurons, astrocytes, oligodendrocytes, microglia/macrophages, and endothelial cells. A. Expression of classic cell type-specific genes by acutely purified mature human neurons, astrocytes, oligodendrocytes, microglia/macrophages, and endothelial cells. Data represent standard deviation from mean across rows. N=12, 1, 5, 3, and 2 patients for astrocytes, neurons, oligodendrocytes, microglia, and endothelial cells, respectively. Age range: 8–63 years. B. Representative examples of the expression of cell type-specific genes by acutely purified cell samples. C. Spearman correlation between all fetal and mature samples. Fetal, n=6 patients. Age range: 18.0–18.5 gw. Mature, n=12, 1, 5, 3, and 2 patients for astrocytes, neurons, oligodendrocytes, microglia, and endothelial cells, respectively. Age range: 8–63 years. D. Scatterplot of human and mouse astrocyte gene expression. ρ represents the Spearman correlation coefficiency. Venn diagram indicates the number of astrocyte enriched genes (>4 fold, FPKM>5) for human and mouse astrocytes. Average expression data from all samples of mature human astrocytes were used for this analysis. Human, n=12 patients. Mouse, n=4 batches of astrocytes each comprising 3 mouse brains combined. Age range of human patients: 8–63 years. Age range of mice: 1–9 months. Fold enrichment in astrocytes is calculated as FPKM in astrocytes divided by the average FPKM in all the other cell types (neurons, oligodendrocytes, microglia, and endothelial cells). E. Differences in gene expression between purified human and mouse astrocytes measured using qPCR. Fold changes reflect enrichment of specific genes in human tissues. F. In situ hybridization performed on temporal lobe cortices from healthy patients (separate source from the RNAseq samples). Probes were designed against LRRC3B and GPR98 (cyan) and sections were counterstained against the astrocyte specific transcription factor, SOX9 (magenta). Scale bars: 100μm zoomed out, 50μm insets.
Figure 5
Figure 5
The transcriptome of HepaCAM purified glioblastoma cells is more similar to APCs than mature astrocytes. A. Venn diagram of the number of genes expressed (FPKM>0.5) by APCs alone, mature astrocytes alone, and both APCs and mature astrocytes. Fetal, n=6 patients. Mature, n=12 patients. B. Scatter plot of gene expression by APCs and mature astrocytes. ρ represents the Spearman correlation coefficiency. C. MRI of a patient with a glioblastoma who underwent surgical resection shows the T1 weighted, heterogenously ring contrast enhancing core of the GBM (left) and the T2 hyperintensity of the surrounding brain (right), representing infiltrating tumor or edema. Blue arrows indicate a representative location of the peripheral tumor sample, and the red arrows indicate sample resected from the contrast-enhancing tumor core. D. Unsupervised hierarchical clustering of gene expression profiles of APCs, mature astrocytes as well as astrocytes from GBM core and peripheral regions using. Linkage; average, ColumnPdistance; Spearman, standardized across rows. Data represent standard deviation over means. E. Expression of genes that distinguish APCS and mature astrocytes in humans. Tumor core and surround astrocytes share expression patterns of APC and mature astrocyte markers, respectively. Tumor: n=3 patients. Tumor periphery: n=1 patient. F. Expression of some APC marker genes (blue) and mature astrocyte marker genes (red) in healthy and tumor samples. G. Differences in gene expression between adult and fetal human brain assessed with qPCR. Fold changes in gene expression were calculated to reflect enrichment in adult tissue (normalized to GAPDH levels).
Figure 6
Figure 6
Acutely purified human astrocytes display resting gene profiles. A. The Zamanian et al. dataset was used to identify the top 30 reactive astrocyte genes upregulated following MCAO injury, LPS infection, or both. Expression of this suite of ‘reactive’ genes was then probed in various astrocyte samples. The white dots in the Violin plots represent the median. Thick vertical black lines represent interquantile ranges. Horizontal dashed lines indicate median in normal human astrocytes for each condition. N=12, 4, 3, and 3 for normal, epilepsy, tumor, and serum-expanded astrocytes, respectively. B. Representative images of acutely purified human astrocytes grown in culture for 7 days in the absence (left) or presence (right) of serum. Scale bar: 20μm.

Comment in

References

    1. Agulhon C, Fiacco TA, McCarthy KD. Hippocampal short- and long-term plasticity are not modulated by astrocyte Ca2+ signaling. Sci (New York, NY) 2010;327:1250–1254. - PubMed
    1. Allen NJ, Barres BA. Neuroscience: Glia - more than just brain glue. Nature. 2009;457:675–677. - PubMed
    1. Allen NJ, Bennett ML, Foo LC, Wang GX, Chakraborty C, Smith SJ, Barres BA. Astrocyte glypicans 4 and 6 promote formation of excitatory synapses via GluA1 AMPA receptors. Nature. 2012;486:410–414. - PMC - PubMed
    1. Attwell D, Buchan AM, Charpak S, Lauritzen M, MacVicar BA, Newman EA. Glial and neuronal control of brain blood flow. Nature. 2010;468:232–243. - PMC - PubMed
    1. Banker GA. Trophic interactions between astroglial cells and hippocampal neurons in culture. Science. 1980;209:809–810. - PubMed

Publication types