. 2016 Jan 6;89(1):147-62.
doi: 10.1016/j.neuron.2015.11.023. Epub 2015 Dec 10.

Mice with Shank3 Mutations Associated with ASD and Schizophrenia Display Both Shared and Distinct Defects

Affiliations

Mice with Shank3 Mutations Associated with ASD and Schizophrenia Display Both Shared and Distinct Defects

Yang Zhou et al. Neuron. .

Abstract

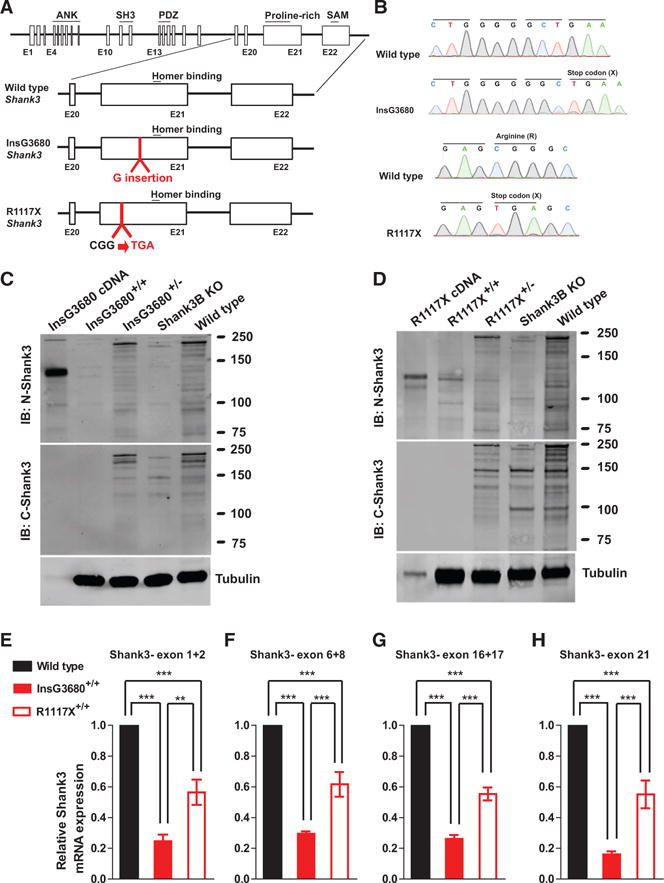
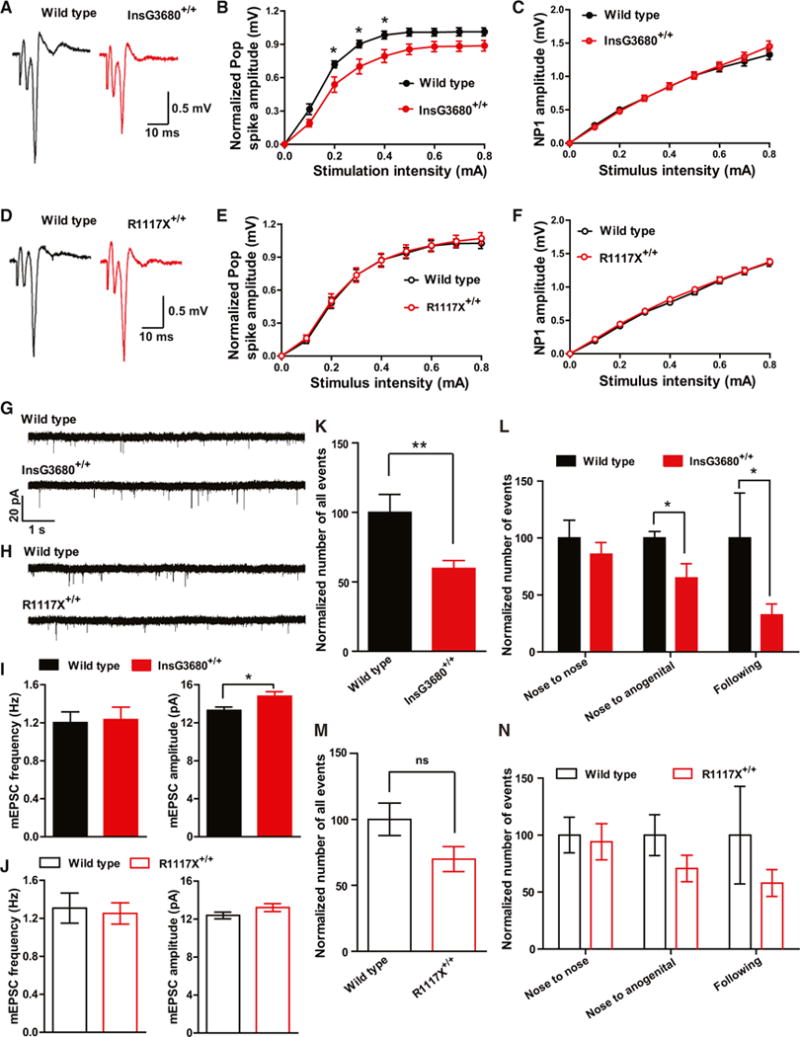
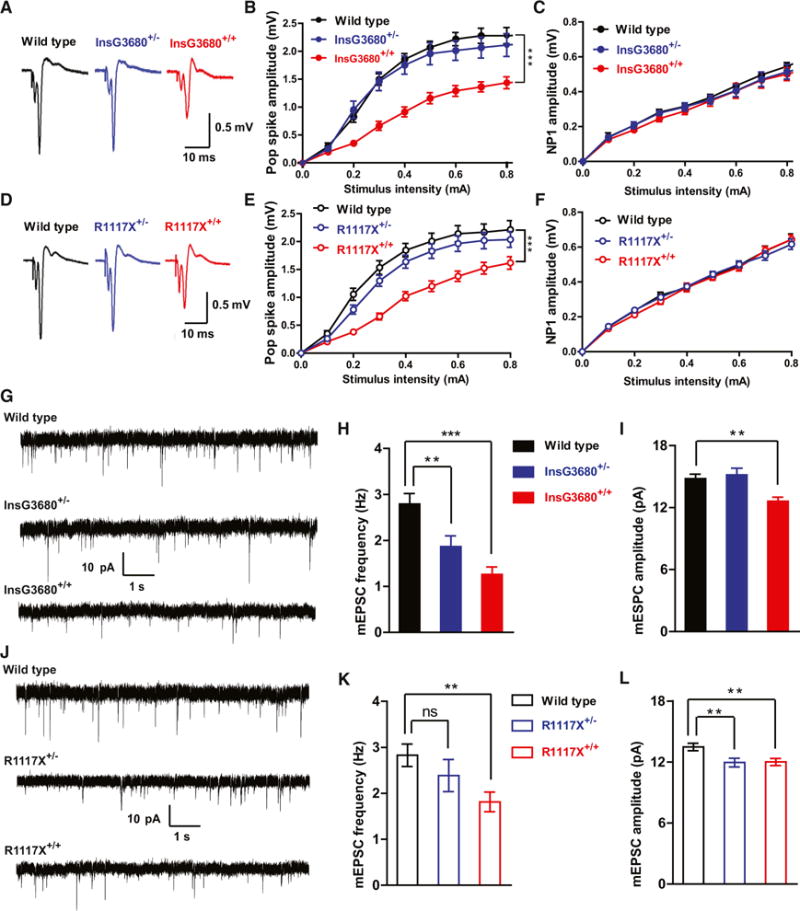
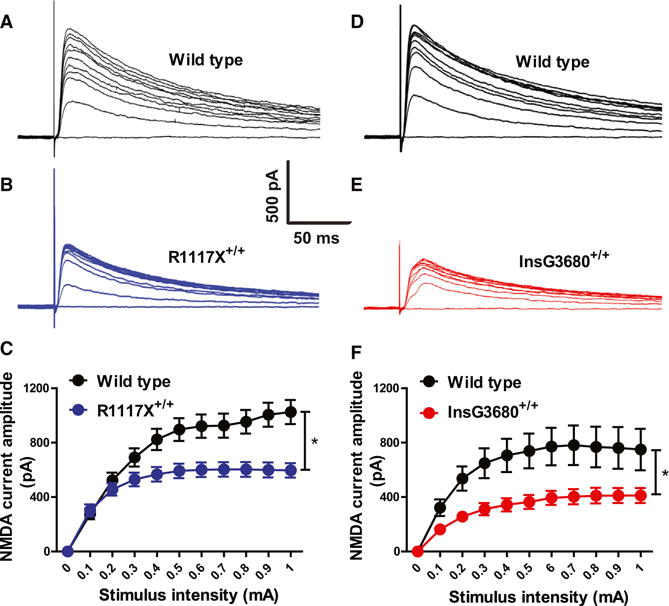
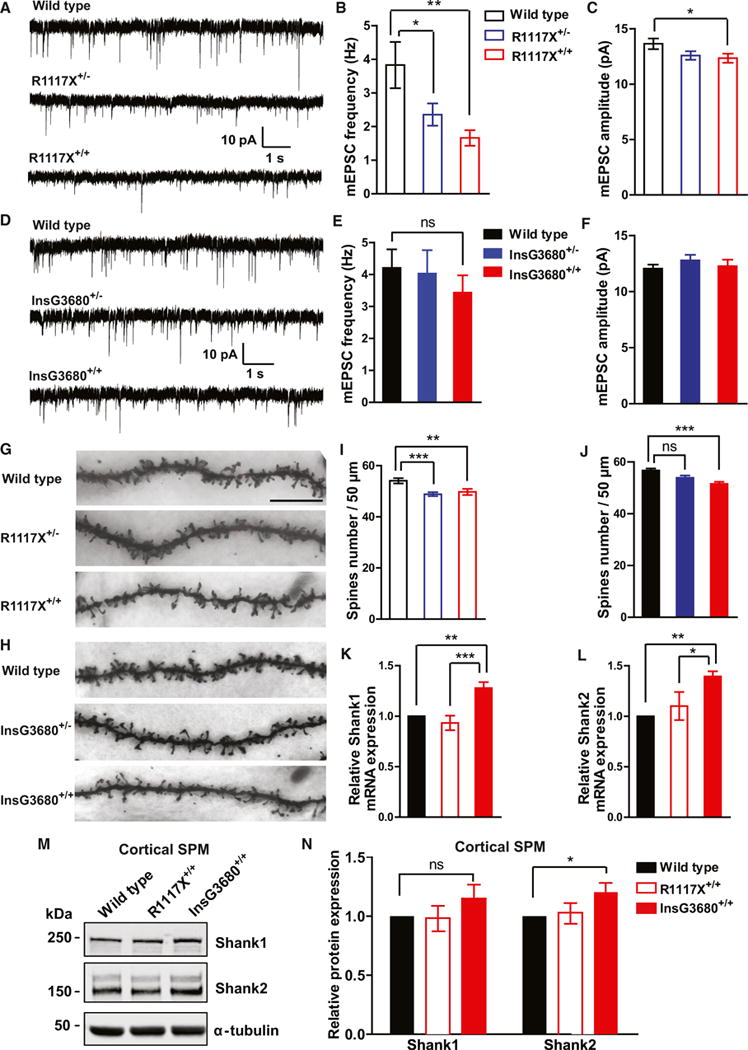
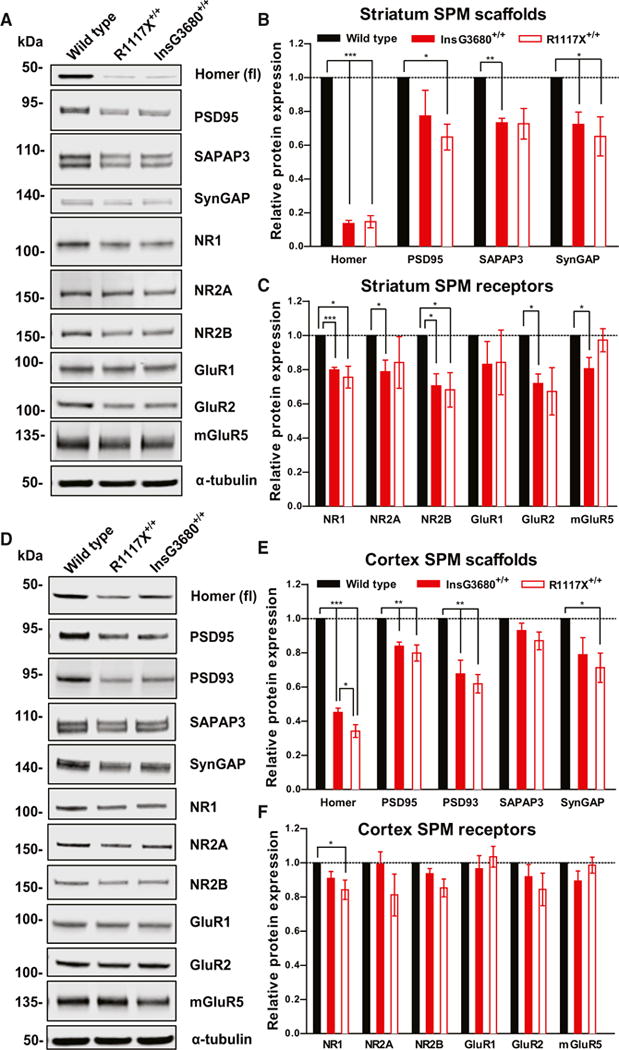
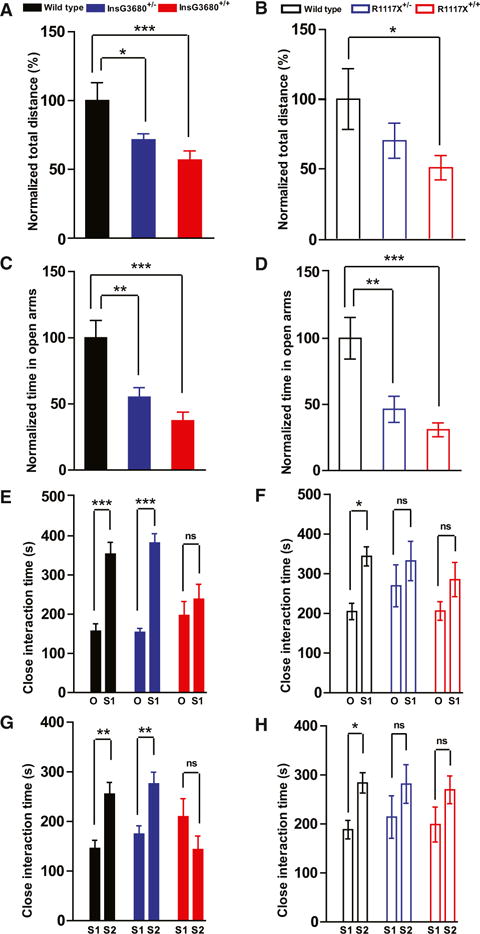
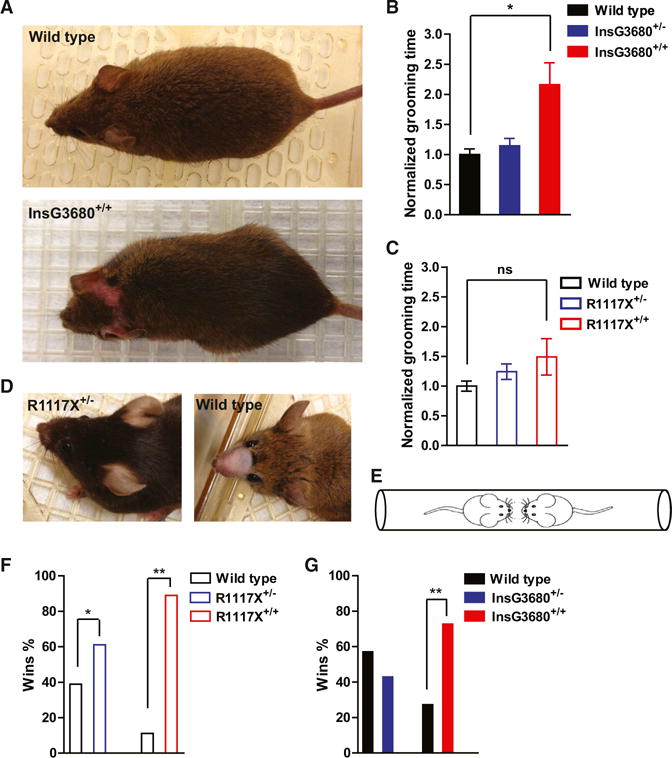
Genetic studies have revealed significant overlaps of risk genes among psychiatric disorders. However, it is not clear how different mutations of the same gene contribute to different disorders. We characterized two lines of mutant mice with Shank3 mutations linked to ASD and schizophrenia. We found both shared and distinct synaptic and behavioral phenotypes. Mice with the ASD-linked InsG3680 mutation manifest striatal synaptic transmission defects before weaning age and impaired juvenile social interaction, coinciding with the early onset of ASD symptoms. On the other hand, adult mice carrying the schizophrenia-linked R1117X mutation show profound synaptic defects in prefrontal cortex and social dominance behavior. Furthermore, we found differential Shank3 mRNA stability and SHANK1/2 upregulation in these two lines. These data demonstrate that different alleles of the same gene may have distinct phenotypes at molecular, synaptic, and circuit levels in mice, which may inform exploration of these relationships in human patients.


Figures

Figure 1
Figure 1. Genetically Engineered Mice with InsG3680 or R1117X Shank3 Mutation Differentially Express SHANK3 Protein and mRNA
(A) Schematic diagram for wild-type Shank3-, InsG3680-, and R1117X-targeted Shank3 alleles. Gene structure of wild-type mouse Shank3 gene and magnified panels on the structure between exon 20 and exon 22 are shown below. Top: wild-type Shank3; middle: autism-associated InsG3680 Shank3 mutation with an insertion of “guanine” nucleotide at position 3680; bottom: schizophrenia-associated R1117X Shank3 mutation changing the “CGG” codon for arginine to a “TGA” stop codon. (B) Representative sequencing chromatograms of wild-type and InsG3680 mutated alleles; wild-type and R1117X mutated alleles showing the point mutations. (C) Representative western blots using striatal PSD fractions prepared from wild-type, Shank3B KO mice, InsG3680+/− mice, InsG3680+/+ mice; lysate from HEK239 cells expressing cDNA plasmid encoding the InsG3680 mutated Shank3. Note that neither the antibody against the N nor C terminus detected SHANK3 protein in InsG3680+/+ mice. (D) Representative western blots using striatal PSD fractions prepared from wild-type, Shank3B KO mice, R1117X+/− mice, R1117X+/+ mice; lysate from HEK239 cells expressing cDNA plasmid encoding the R1117X mutated Shank3. Note that SHANK3 protein expression is almost abolished except for a prominent truncated isoform in the R1117X+/+ line that is detected with the antibody against the N terminus. (E–H) The relative level of Shank3 mRNA in striatum is different between the two lines as quantified by primers amplifying exon 1 to 2, exon 6 to 8, 16 to 17, and partial exon 21 before both Shank3 mutation sites. Data are normalized to Gapdh mRNA and presented as mean ± SEM. **p < 0.01, ***p < 0.001; one-way ANOVA with Bonferroni post hoc test, WT mice (n = 5), R1117X+/+ mice (n = 5) and InsG3680+/+ mice (n = 5).
Figure 2
Figure 2. InsG3680+/+ but Not R1117X+/+ Mice Display Altered Striatal Synaptic Transmission at P14 and Reduced Social Interaction at P23
(A and D) Representative cortico-striatal pop spike traces recorded from P14 mice with indicated genotypes. (B and C) Cortical-striatal input-output curve shows reduced pop spike responses in InsG3680+/+ mice compared to wild-type littermates. NP1 amplitude is similar between the genotypes, suggesting that presynaptic input is not different. (E and F) Cortical-striatal input-output curve shows similar pop spike responses and NP1 amplitude between R1117X+/+ mice and their wild-type littermates. In (B), (C), (E), and (F), data are presented as mean ± SEM. *p < 0.05; two-way ANOVA repeated-measures with Bonferroni post hoc test. n = 12 slices from 4 pairs of littermates for each cohort. (G and H) Typical AMPA receptor-mediated mEPSC traces recorded from P14 MSNs with indicated genotypes. (I and J) Amplitude but not frequency of mEPSC is increased in InsG3680+/+ MSNs compared to wild-type. No change of amplitude or frequency of mEPSC in R1117X+/+ MSNs. In InsG3680 cohort, n = 29 neurons for wild-type; n = 29 neurons for InsG3680+/+ from 3 pairs of littermates; in R1117X cohort, n = 30 neurons for wild-type, n = 31 neurons for R1117X+/+ from 3 pairs of littermates. Data are presented as mean ± SEM; two-tailed t test. (K and M) Total number of interaction events from mice pairs with indicated genotypes as normalized to wild-type control. (L and N) Normalized number of categorized interaction events from mice pairs with indicated genotypes as normalized to wild-type control. In (K), (L), (M), and (N), in R1117X cohort, n = 9 pairs of mice for wild-type; n = 9 pairs of mice for R1117X+/+; in InsG3680 cohort, n = 8 pairs of mice for wild-type; n = 10 pairs of mice for InsG3680+/+. Data are presented as mean ± SEM, *p < 0.05, **p < 0.01; two-tailed t test.
Figure 3
Figure 3. Striatal Synaptic Transmission Is Reduced in Adult R1117X and InsG3680 Mutant Mice
(A and D) Representative cortical-striatal pop spike traces from mice with indicated genotypes. (B and E) Reduced striatal pop spike amplitude in both InsG3680+/+ and R1117X+/+ mice. (C and F) No difference of NP1 amplitude among genotypes. In (B), (C), (E), and (F) data are presented as mean ± SEM. ***p < 0.001; two-way ANOVA repeated-measures with Bonferroni post hoc test. n = 12 slices per genotype from 4 pairs of mice. (G and J) Typical AMPA receptor-mediated mEPSC traces recorded from MSNs with indicated genotypes. (H and I) mEPSC frequency of MSNs is reduced in both homozygous and heterozygous InsG3680 mutant mice compared to wild-type littermates. mEPSC amplitude is also reduced in homozygous InsG3680 mutant mice. n = 26 neurons for WT; n = 24 neurons for InsG3680+/−; n = 21 neurons for InsG3680+/+ from three pairs of mice. (K and L) mEPSC frequency of MSNs is reduced in homozygous R1117X mutant mice compared to wild-type littermates. mEPSC amplitude is reduced in both homozygous and heterozygous R1117X mutant mice. n = 23 neurons for WT; n = 24 neurons for R1117X+/−; n = 26 neurons for R1117X+/+ from three pairs of mice. In (H), (I), (K), and (L), data are presented as mean ± SEM. **p < 0.01, ***p < 0.001; one-way ANOVA with Bonferroni post hoc test.
Figure 4
Figure 4. Reduced NMDA Receptors Mediated Synaptic Transmission in Both R1117X+/+and InsG3680+/+ Shank3 Mutant Mice
(A–C) Typical NMDA receptors mediated currents from striatal MSNs by stimulating corpus callosum and quantification. n = 16 neurons for wild-type; n = 18 neurons for R1117X+/+ from three pairs of littermates at 7 week’s age. (D–F) Typical NMDA receptors mediated currents from striatal MSNs by stimulating corpus callosum and quantification. n = 14 neurons for wild-type; n = 12 neurons for InsG3680+/+ from three pairs of littermates at 8 week’s age. In both (C) and (F), data are presented as mean ± SEM. *p < 0.05; two-way ANOVA test.
Figure 5
Figure 5. Profound Cortical Synaptic Defects Manifest in Mice Carrying the Schizophrenia-Associated R1117X Mutation
(A–C) Typical AMPA receptor-mediated mEPSC recordings in the prefrontal cortex and statistical results for R1117X mice. n = 13 neurons for WT; n = 20 neurons for R1117X+/−; n = 18 neurons for R1117X+/+ from three pairs of mice. Note the highly significant reduction of mEPSC frequency in both heterozygous and homozygous mice and a modest reduction of amplitude in homozygotes. (D–F) Typical AMPA receptor-mediated mEPSC recordings in the prefrontal cortex and statistical results for InsG3680 cohort. n = 18 neurons for WT; n = 16 neurons for InsG3680+/−; n = 17 neurons for InsG3680+/+ from three pairs of mice. Both heterozygous and homozygous mice display comparable miniature events to wild-type mice. In (B), (C), (E), and (F), data are presented as mean ± SEM. *p < 0.05, **p < 0.01; one-way ANOVA with Bonferroni post hoc test. (G and H) Representative confocal images of secondary dendrites of pyramidal neurons from frontal association area of mice with indicated genotypes (scale bar, 10 μm). (I and J) Quantification of spine number from neurons with indicated genotypes from three littermate pairs indicates reduced spine numbers in R1117X+/−, R1117X+/+, and InsG3680+/+ mice. (K and L) mRNAs of Shank3 homologs Shank1 and Shank2 are upregulated in cortical tissue from InsG3680+/+ compared to wild-type mice. Data are normalized to Gapdh mRNA and presented as mean ± SEM. WT mice (n = 5), R1117X+/+ mice (n = 5), and InsG3680+/+ mice (n = 5). In all the panels, data were collected from 2-month-old mice. In (I), (J), (K), and (L), *p < 0.05, **p < 0.01, **p < 0.001; one-way ANOVA with Bonferroni post hoc test. (M) Representative blots for proteins detected by specific antibodies in the cortical SPM fraction from adult wild-type, R1117X+/+, and InsG3680+/+ mice. (N) Adult InsG3680+/+ but not R1117X+/+ mice show increased Shank2 expression in cortical tissue. Quantification of relative levels of proteins as normalized to tubulin from cortical SPM. Data are presented as mean ± SEM *p < 0.05; one sample t test. (n = 8 samples per protein per genotype, each n being pooled tissue from two mice).
Figure 6
Figure 6. InsG3680 and R1117X Mutant Mice Display Common and Differential Disruptions of Post-synaptic Signaling Complexes
(A) Representative blots for proteins detected by specific antibodies in the striatal SPM fraction from wild-type, InsG3680+/+, and R1117X+/+ mice. (B and C) Quantification of relative levels of proteins as normalized to tubulin protein expression from striatal SPM. (n = 4–6 samples per protein per genotype, each n being pooled tissue from three mice). (D) Representative blots for proteins detected by specific antibodies in the cortical SPM fraction from wild-type, InsG3680+/+, and R1117X+/+ mice. (E and F) Quantification of relative levels of proteins as normalized to tubulin protein expression from cortex SPM. (n = 4–11 samples per protein per genotype, each n being pooled tissue from two mice). In (B), (C), (E), and (F), data are presented as mean ± SEM. *p < 0.05, **p < 0.01, **p < 0.001; one sample t test.
Figure 7
Figure 7. InsG3680 and R1117X Mutant Mice Display Anxiety Behavior and Social Interaction Deficits
(A and B) Total distance traveled in the open field test as normalized to wild-type littermates. (C and D) Time spent in the open arms in the elevated zero maze test as normalized to wild-type littermates. In the InsG3680 cohort, n = 17 mice for wild-type; n = 19 mice for InsG3680+/−; n = 18 mice for InsG3680+/+ group. In the R1117X cohort, n = 15 mice for wild-type, n = 15 mice for R1117X+/−; n = 15 mice for R1117X+/+. (E and F) Time spent on close interaction with an object (O) versus stranger mice (S1) in the phase II social interaction test. (G and H) Time spent on close interaction with a familiar mouse (S1) versus stranger mouse (S2) in the phase III social interaction test. In the InsG3680 cohort, n = 17 mice for wild-type; n = 19 mice for InsG3680+/−; n = 18 mice for InsG3680+/+ group; in the R1117X cohort, n = 23 for wild-type, n = 25 for R1117X+/−; n = 24 for R1117X+/+ group. In all the panels, data are presented as mean ± SEM, *p < 0.05, **p < 0.01, ***p < 0.001; one-way ANOVA with Bonferroni post hoc test.
Figure 8
Figure 8. InsG3680 Mice Show More Profound Repetitive Self-Grooming, whereas R1117X Mice Display Allogrooming and Dominance-like Behavior
(A) Representative pictures from an adult wild-type and an InsG3680+/+ mouse that developed a lesion in the head/neck area. (B and C) Time spent on grooming during 2 hr videotaping of indicated genotypes as normalized to their wild-type littermates. In the InsG3680 cohort, n = 9 mice for wild-type; n = 9 mice for InsG3680+/−; n = 10 mice from InsG3680+/+ group. In the R1117X cohort, n = 9 mice for wild-type, n = 9 mice for R1117X+/−; n = 9 mice for R1117X+/+. Data are presented as mean ± SEM. *p < 0.05; Kruskal-Wallis test with Dunn’s post hoc comparison. (D) Representative pictures of an R1117X+/− mouse with intact facial hair and a wild-type mouse shaved by its cage mate as an indication for allogrooming behavior. (E) Diagram of tube test task between two unfamiliar mice with different genotypes. (F and G) Percentage of wins in test pairs between indicated genotypes, 11/18 (61%) of R1117X+/− versus WT; 16/18 (89%) of R1117X+/+ versus WT; 6/14 (43%) of InsG3680+/− versus WT; 8/11 (73%) of InsG3680+/+ versus WT. Note that both R1117X+/− and R1117X+/+ mice perform significantly above chance level. One-sample chi-square test was used to determine the significant difference. “*” indicates significantly different from an expected chance (50:50 win-lose outcome).

Comment in

References

    1. Adhikari A, Topiwala MA, Gordon JA. Synchronized activity between the ventral hippocampus and the medial prefrontal cortex during anxiety. Neuron. 2010;65:257–269. - PMC - PubMed
    1. Ahmari SE, Spellman T, Douglass NL, Kheirbek MA, Simpson HB, Deisseroth K, Gordon JA, Hen R. Repeated cortico-striatal stimulation generates persistent OCD-like behavior. Science. 2013;340:1234–1239. - PMC - PubMed
    1. Amodio DM, Frith CD. Meeting of minds: the medial frontal cortex and social cognition. Nat Rev Neurosci. 2006;7:268–277. - PubMed
    1. Anderson SW, Bechara A, Damasio H, Tranel D, Damasio AR. Impairment of social and moral behavior related to early damage in human prefrontal cortex. Nat Neurosci. 1999;2:1032–1037. - PubMed
    1. Baker SA, Chen L, Wilkins AD, Yu P, Lichtarge O, Zoghbi HY. An AT-hook domain in MeCP2 determines the clinical course of Rett syndrome and related disorders. Cell. 2013;152:984–996. - PMC - PubMed

Publication types