. 2016 Feb 17;27(2):465-73.
doi: 10.1021/acs.bioconjchem.5b00561. Epub 2016 Jan 6.

Cell-Permeable Esterase-Activated Ca(II)-Sensitive MRI Contrast Agent

Affiliations

Cell-Permeable Esterase-Activated Ca(II)-Sensitive MRI Contrast Agent

Keith W MacRenaris et al. Bioconjug Chem. .

Abstract

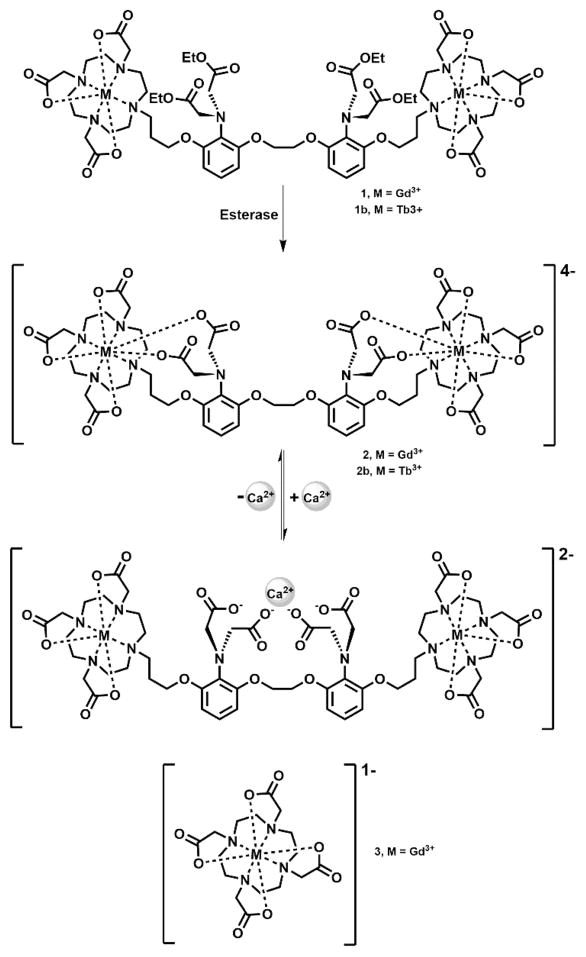
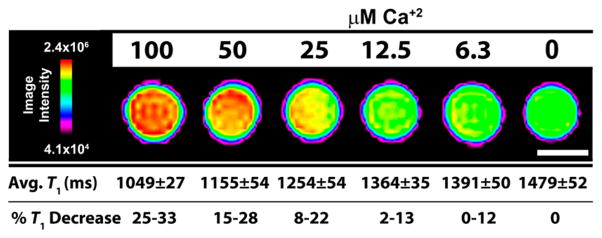
Calcium [Ca(II)] is a fundamental transducer of electrical activity in the central nervous system (CNS). Influx of Ca(II) into the cytosol is responsible for action potential initiation and propagation, and initiates interneuronal communication via release of neurotransmitters and activation of gene expression. Despite the importance of Ca(II) in physiology, it remains a challenge to visualize Ca(II) flux in the central nervous system (CNS) in vivo. To address these challenges, we have developed a new generation, Ca(II)-activated MRI contrast agent that utilizes ethyl esters to increase cell labeling and prevent extracellular divalent Ca(II) binding. Following labeling, the ethyl esters can be cleaved, thus allowing the agent to bind Ca(II), increasing relaxivity and resulting in enhanced positive MR image contrast. The ability of this probe to discriminate between extra- and intracellular Ca(II) may allow for spatiotemporal in vivo imaging of Ca(II) flux during seizures or ischemia where large Ca(II) fluxes (1-10 μM) can result in cell death.


Conflict of interest statement

Notes

The authors declare no competing financial interest.

Figures

Figure 1
Figure 1
Schematic of complex 1 activation after ethyl ester hydrolysis and subsequent Ca(II) binding. Esterases cleave the ethyl esters on the BAPTA moiety unmasking four carboxylates that coordinate to the metal center blocking water access to the macrocyclic chelates maintaining the agent in a low relaxivity state. In the presence of Ca(II) a conformational change occurs whereby the free carboxylates bind Ca(II) providing water access to the Gd(III) centers, thereby increasing contrast agent relaxivity. Complex 3 was used in a parallel experiment as a control.
Figure 2
Figure 2
Synthetic scheme of DOPTA-Ethyl-Gd(III). (a) Br2, PPh3, TEA, DCM, 60%. (b) Tris-t-butyl-DO3A, K2CO3, MeCN, 65%. (c) Formic acid, 55 °C. (d) GdCl3, NaOH, pH 5–6, 44%.
Figure 3
Figure 3
Plot of ethyl ester hydrolysis of 1 by porcine esterase at 37 °C (in pH 7.4 HEPES buffer) monitored by HPLC-MS using an evaporative light scattering detector (ELSD). Individual data points represent the integration of the HPLC-MS peak of 1 after exposure to porcine esterase divided by the HPLC-MS peak of 1 prior to porcine esterase exposure (multiplied by 100 to give percent complex hydrolysis). The line corresponds to a pseudo first-order kinetic fit of the data with an 11.4 h half-life for 1.
Figure 4
Figure 4
Relaxivity (r1, mM−1s−1) changes of complex 1 (after ethyl ester hydrolysis via porcine esterase) and 2 upon addition of Ca(II) at 1.41 T and 37 °C (in pH 7.4 0.1 M HEPES buffer with 0.1 M KCl and 1% DMSO). Both synthesized 2 and ester hydrolyzed 1 show a >64% change in r1 upon Ca(II) binding. Lines represent nonlinear sigmoidal dose–response fits to the data. EC50 value for compound 1 is 16.6 μM Ca2+ and for compound 2 is 11.5 μM Ca2+.
Figure 5
Figure 5
MR images and T1 analysis of 100 μM solution phantoms of 2 binding with increasing amounts of Ca(II) corresponding to 100, 50, 25, 12.5, and 6.25 μM Ca(II) at 7 T and 25 °C. Scale bar (white) represents 1 mm. T1 values are calculated as the average of 5, 1 mm slices ± 1 standard deviation. %T1 decrease is calculated versus the 0 μM Ca(II) sample.
Figure 6
Figure 6
Concentration-dependent (A), time-dependent (B), and cellular retention studies (C) of 1, 2, and 3 in the hippocampal neuronal cell line, HT-22. Cellular uptake of 1 was significantly higher than that of 2 and 3. A small amount of contrast agent (<7%) leached out of the cells in 24 h. All samples were washed 3× with DPBS, trypsinized, counted, and digested in nitric acid to determine Gd(III) content via ICP-MS. Data are mean ± standard deviation of triplicate runs.
Figure 7
Figure 7
(A) T1-weighted MR image with corresponding image-intensity color map of HT-22 cells incubated with 1, 2, and 3 and media alone for 4 h (scale bar = 1 mm). 9.4 T (400 MHz) and 25 °C. (B) Calculated values corresponding to the MR image in (A). Values represent the average of four 1 mm slices and the error is plus or minus one standard deviation of the mean.

References

    1. Berridge MJ. Neuronal calcium signaling. Neuron. 1998;21:13–26. - PubMed
    1. Bading H. Nuclear calcium signalling in the regulation of brain function. Nat Rev Neurosci. 2013;14:593–608. - PubMed
    1. Bean BP. The action potential in mammalian central neurons. Nat Rev Neurosci. 2007;8:451–465. - PubMed
    1. Clapham DE. Calcium signaling. Cell. 2007;131:1047–1058. - PubMed
    1. Charles A. Intercellular calcium waves in glia. Glia. 1998;24:39–49. - PubMed

Publication types