

Analysis on Population Level Reveals Trappability of Wild Rodents Is Determined by Previous Trap Occupant
- PMID: 26689683
- PMCID: PMC4687096
- DOI: 10.1371/journal.pone.0145006
Analysis on Population Level Reveals Trappability of Wild Rodents Is Determined by Previous Trap Occupant
Abstract
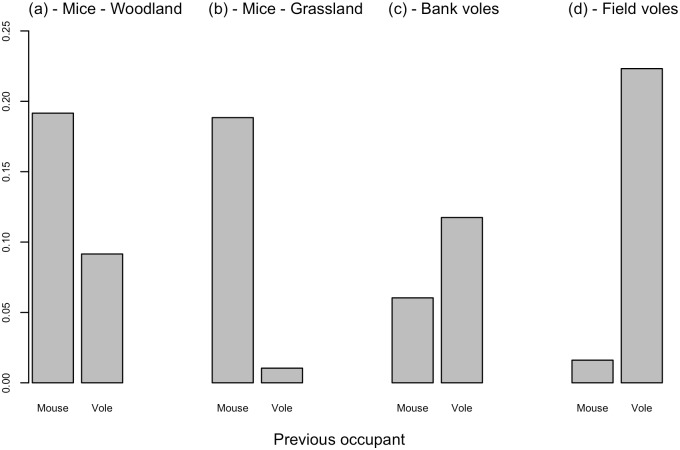
Live trapping is central to the study of small mammals. Thus, any bias needs to be understood and accounted for in subsequent analyses to ensure accurate population estimates. One rarely considered bias is the behavioural response of individuals to the trap, in particular the olfactory cues left behind by previous occupants (PO). We used a data set of 8,115 trap nights spanning 17 separate trapping sessions between August 2002 and November 2013 in Wytham Woods, Oxfordshire, UK to examine if the decision to enter a trap was affected by the PO, if this was detectable in traditional Capture-Mark-Recapture trapping data (i.e., individuals not uniquely marked), and if it was possible for this effect to bias the population estimates obtained. Data were collected on Apodemus sylvaticus, Myodes glareolus, and Microtus agrestis. Three Generalised Linear Models revealed a significant tendency for the three species to enter traps with same-species PO. With, for example, A. sylvaticus 9.1 times more likely to enter a same species PO trap compared to one that contained a M. agrestis in the grassland during the nocturnal period. Simulation highlighted that, when all other factors are equal, the species with the highest PO effect will have the highest capture rate and therefore return more accurate population estimates. Despite the large dataset, certain species-, sex-, and/ or age-combinations were under-represented, and thus no effects of any additional individual-specific characteristics could be evaluated. Uniquely marking individuals would allow for the PO effect to be disentangled from other biases such as trap-shyness and spatial heterogeneity, but may not be possible in all cases and will depend on the aims of the study and the resources available.
Conflict of interest statement
Figures


Similar articles
-
Population estimation and trappability of the European badger (Meles meles): implications for tuberculosis management.PLoS One. 2012;7(12):e50807. doi: 10.1371/journal.pone.0050807. Epub 2012 Dec 5. PLoS One. 2012. PMID: 23227211 Free PMC article.
-
Infections with blood parasites in the small British rodents Apodemus sylvaticus, Clethrionomys glareolus and Microtus agrestis.Parasitology. 1981 Aug;83(Pt 1):179-89. doi: 10.1017/s0031182000050149. Parasitology. 1981. PMID: 7022328
-
Differential trappability of small mammals in three habitats of Southeastern Brazil.Braz J Biol. 2004 Nov;64(4):895-900. doi: 10.1590/s1519-69842004000500021. Epub 2005 Mar 2. Braz J Biol. 2004. PMID: 15744432
-
Updating the AIHTS Trapping Standards to Improve Animal Welfare and Capture Efficiency and Selectivity.Animals (Basel). 2020 Jul 24;10(8):1262. doi: 10.3390/ani10081262. Animals (Basel). 2020. PMID: 32722315 Free PMC article. Review.
-
[Small rodents in the forest ecosystem as infectious disease reservoirs].Acta Med Croatica. 2003;57(5):421-6. Acta Med Croatica. 2003. PMID: 15011471 Review. Croatian.
Cited by
-
Habitat and Season Effects on Small Mammal Bycatch in Live Trapping.Biology (Basel). 2022 Dec 13;11(12):1806. doi: 10.3390/biology11121806. Biology (Basel). 2022. PMID: 36552315 Free PMC article.
-
Spatial capture-recapture design and modelling for the study of small mammals.PLoS One. 2018 Jun 7;13(6):e0198766. doi: 10.1371/journal.pone.0198766. eCollection 2018. PLoS One. 2018. PMID: 29879211 Free PMC article.
References
-
- Gurnell J, Flowerdew JR. Live trapping small mammals. Mammal Society; 2006.
-
- Smith MH. A comparison of different methods of capturing and estimating numbers of mice. Journal of Mammalogy. 1968;p. 455–462. 10.2307/1378203 - DOI
-
- Krebs CJ. Demographic changes in fluctuating populations of Microtus californicus . Ecological monographs. 1966;p. 239–273. 10.2307/1942418 - DOI
-
- Petersen C. The yearly immigration of young plaice into the Limfjord from the German Sea. Report of the Danish Biological Station. 1896;6:1–48.
-
- Lincoln FC. Calculating waterfowl abundance on the basis of banding returns. US Dept of Agriculture. 1930;.
Publication types
MeSH terms
LinkOut - more resources
Full Text Sources
Other Literature Sources
