

Optimal Vitamin D Supplementation Doses that Minimize the Risk for Both Low and High Serum 25-Hydroxyvitamin D Concentrations in the General Population
- PMID: 26690210
- PMCID: PMC4690079
- DOI: 10.3390/nu7125527
Optimal Vitamin D Supplementation Doses that Minimize the Risk for Both Low and High Serum 25-Hydroxyvitamin D Concentrations in the General Population
Abstract
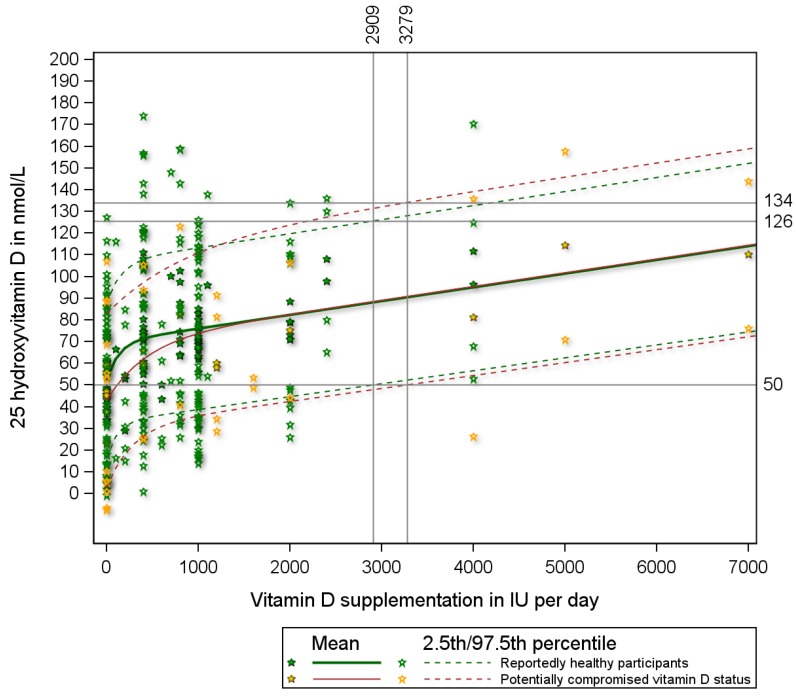
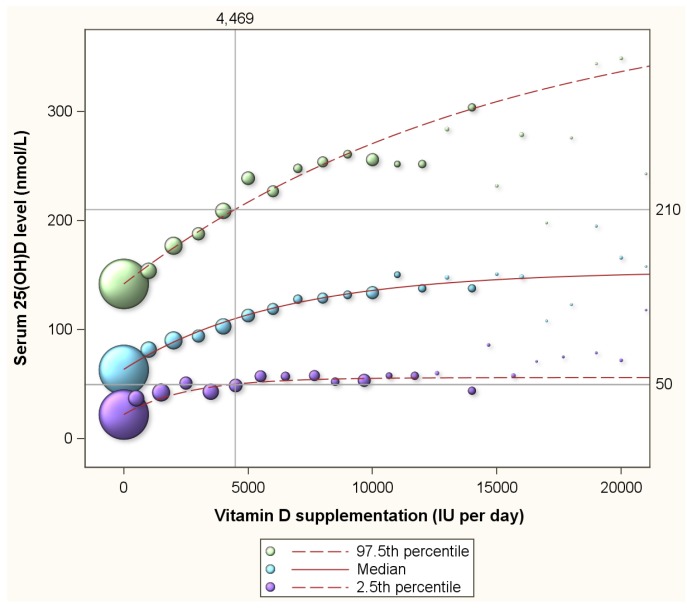
The Recommended Dietary Allowance (RDA) is the nutrient intake considered to be sufficient to meet the requirements of 97.5% of the population. Recent reports revealed a statistical error in the calculation of the RDA for vitamin D opening the question of what the recommendation should be. We took a dual approach to answer this question: (1) we aggregated 108 published estimates on vitamin D supplementation and vitamin D status; and (2) we analyzed 13,987 observations of program participants. The aggregation of published data revealed that 2909 IU of vitamin D per day is needed to achieve serum 25-hydroxyvitamin D (25(OH)D) concentrations of 50 nmol/L or more in 97.5% of healthy individuals. For normal weight, overweight and obese program participants this was 3094, 4450 and 7248 IU respectively. These supplementation doses would also result in 2.5% of normal weight, overweight and obese participants having 25(OH)D concentrations above 210, 200 and 214 nmol/L respectively. As these concentrations are high, an approach that minimizes the risk for both low and high concentrations seems desirable. With this approach we estimated, for example, that doses of 1885, 2802 and 6235 IU per day are required for normal weight, overweight and obese individuals respectively to achieve natural 25(OH)D concentrations (defined as 58 to 171 nmol/L). In conclusion, the large extent of variability in 25(OH)D concentrations makes a RDA for vitamin D neither desirable nor feasible. We therefore propose recommendations be articulated in the form of an optimal intake that minimizes the risk for both low and high serum 25(OH)D concentrations. This contribution includes body weight specific recommendations for optimal intakes for various combinations of lower and upper 25(OH)D concentration targets.
Keywords: disease prevention; nutrition; optimal vitamin D intake; optimal vitamin D status; public health; recommended daily allowance; vitamin D; vitamin D deficiency; vitamin D supplementation.
Figures


Similar articles
-
Dose response to vitamin D supplementation in postmenopausal women: a randomized trial.Ann Intern Med. 2012 Mar 20;156(6):425-37. doi: 10.7326/0003-4819-156-6-201203200-00005. Ann Intern Med. 2012. PMID: 22431675 Clinical Trial.
-
The importance of body weight for the dose response relationship of oral vitamin D supplementation and serum 25-hydroxyvitamin D in healthy volunteers.PLoS One. 2014 Nov 5;9(11):e111265. doi: 10.1371/journal.pone.0111265. eCollection 2014. PLoS One. 2014. PMID: 25372709 Free PMC article.
-
Dietary vitamin D dose-response in healthy children 2 to 8 y of age: a 12-wk randomized controlled trial using fortified foods.Am J Clin Nutr. 2016 Jan;103(1):144-52. doi: 10.3945/ajcn.115.115956. Epub 2015 Dec 16. Am J Clin Nutr. 2016. PMID: 26675772 Clinical Trial.
-
Vitamin D supplementation, 25-hydroxyvitamin D concentrations, and safety.Am J Clin Nutr. 1999 May;69(5):842-56. doi: 10.1093/ajcn/69.5.842. Am J Clin Nutr. 1999. PMID: 10232622 Review.
-
Vitamin D: Current Guidelines and Future Outlook.Anticancer Res. 2018 Feb;38(2):1145-1151. doi: 10.21873/anticanres.12333. Anticancer Res. 2018. PMID: 29374751 Review.
Cited by
-
Vitamin D supplementation: less controversy, more guidance needed.F1000Res. 2016 Aug 17;5:F1000 Faculty Rev-2017. doi: 10.12688/f1000research.8863.1. eCollection 2016. F1000Res. 2016. PMID: 27594987 Free PMC article. Review.
-
Sunbeds with UVB radiation can produce physiological levels of serum 25-Hydroxyvitamin D in healthy volunteers.Dermatoendocrinol. 2017 Oct 17;9(1):e1375635. doi: 10.1080/19381980.2017.1375635. eCollection 2017. Dermatoendocrinol. 2017. PMID: 29484099 Free PMC article.
-
Impact of Vitamin D Supplementation on Bone Mineral Density and All-Cause Mortality in Heart Transplant Patients.Biomedicines. 2021 Oct 12;9(10):1450. doi: 10.3390/biomedicines9101450. Biomedicines. 2021. PMID: 34680567 Free PMC article.
-
Serum 25-hydroxyvitamin D levels in patients with skin diseases including psoriasis, infections, and atopic dermatitis.Dermatoendocrinol. 2018 Feb 22;10(1):e1442159. doi: 10.1080/19381980.2018.1442159. eCollection 2018. Dermatoendocrinol. 2018. PMID: 29904567 Free PMC article.
-
Vitamin D Status and Its Association with Parathyroid Hormone Concentration in Brazilians.J Nutr Metab. 2017;2017:9056470. doi: 10.1155/2017/9056470. Epub 2017 Feb 7. J Nutr Metab. 2017. PMID: 28265467 Free PMC article.
References
-
- Institute of Medicine. Food and Nutrition Board . Dietary Reference Intakes for Calcium and Vitamin D. National Academies Press; Washington, DC, USA: 2011. - PubMed
-
- Holick M.F., Binkley N.C., Bischoff-Ferrari H.A., Gordon C.M., Hanley D.A., Heaney R.P., Murad M.H., Weaver C.M., Endocrine S. Evaluation, treatment, and prevention of vitamin D deficiency: An Endocrine Society clinical practice guideline. J. Clin. Endocrinol. Metab. 2011;96:1911–1930. doi: 10.1210/jc.2011-0385. - DOI - PubMed
-
- Ekwaru J.P., Zwicker J.D., Holick M.F., Giovannucci E., Veugelers P.J. The importance of body weight for the dose response relationship of oral vitamin D supplementation and serum 25-hydroxyvitamin D in healthy volunteers. PLoS ONE. 2014;9:e111265. doi: 10.1371/journal.pone.0111265. - DOI - PMC - PubMed
Publication types
MeSH terms
Substances
LinkOut - more resources
Full Text Sources
Other Literature Sources
Medical
Molecular Biology Databases
Research Materials
