

Prophage-Encoded Staphylococcal Enterotoxin A: Regulation of Production in Staphylococcus aureus Strains Representing Different Sea Regions
- PMID: 26690218
- PMCID: PMC4690139
- DOI: 10.3390/toxins7124889
Prophage-Encoded Staphylococcal Enterotoxin A: Regulation of Production in Staphylococcus aureus Strains Representing Different Sea Regions
Abstract
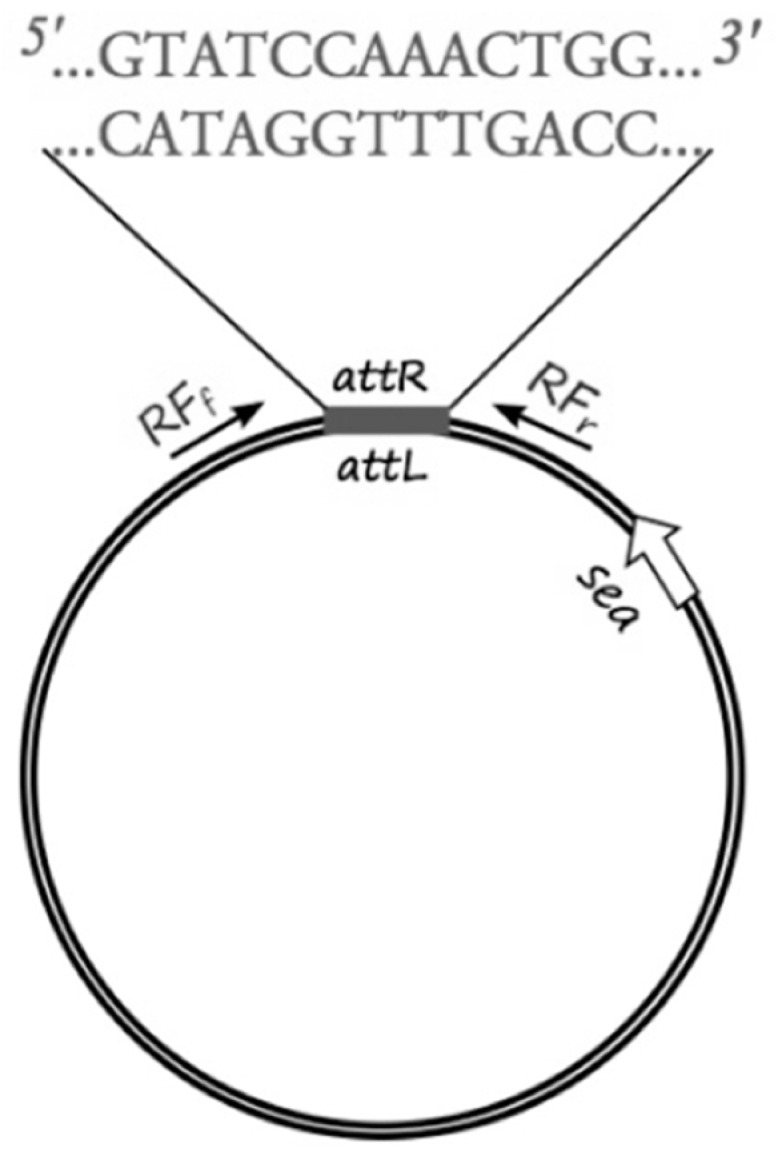
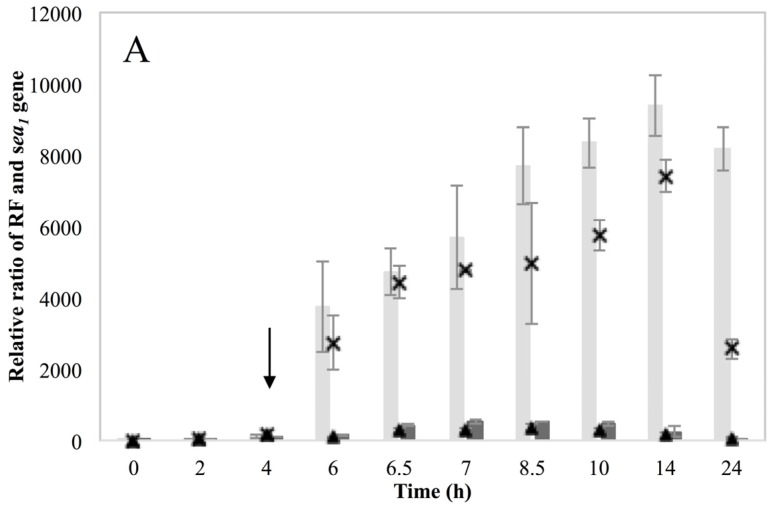
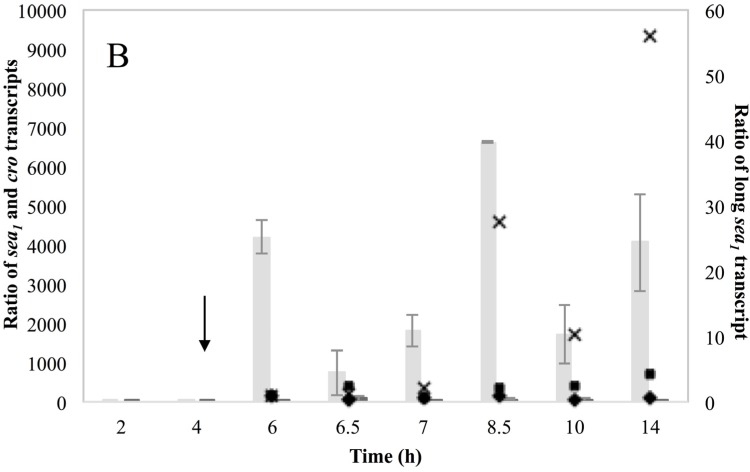
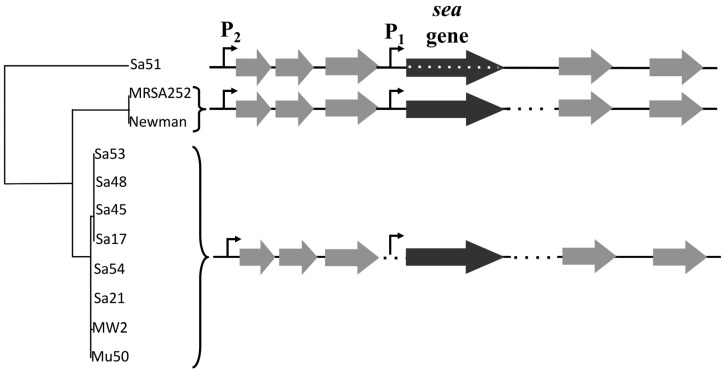
The present study investigates the nature of the link between the staphylococcal enterotoxin A (SEA) gene and the lifecycle of Siphoviridae bacteriophages, including the origin of strain variation regarding SEA production after prophage induction. Five strains representing three different genetic lines of the sea region were studied under optimal and prophage-induced growth conditions and the Siphoviridae lifecycle was followed through the phage replicative form copies and transcripts of the lysogenic repressor, cro. The role of SOS response on prophage induction was addressed through recA transcription in a recA-disruption mutant. Prophage induction was found to increase the abundance of the phage replicative form, the sea gene copies and transcripts and enhance SEA production. Sequence analysis of the sea regions revealed that observed strain variances were related to strain capacity for prophage induction, rather than sequence differences in the sea region. The impact of SOS response activation on the phage lifecycle was demonstrated by the absence of phage replicative form copies in the recA-disruption mutant after prophage induction. From this study it emerges that all aspects of SEA-producing strain, the Siphoviridae phage and the food environment must be considered when evaluating SEA-related hazards.
Keywords: Siphoviridae; Staphylococcus aureus; enterotoxin A; prophage; staphylococcal food poisoning.
Figures


Similar articles
-
Coordination of prophage and global regulator leads to high enterotoxin production in staphylococcal food poisoning-associated lineage.Microbiol Spectr. 2024 Mar 5;12(3):e0292723. doi: 10.1128/spectrum.02927-23. Epub 2024 Feb 6. Microbiol Spectr. 2024. PMID: 38319074 Free PMC article.
-
Assessment of high and low enterotoxin A producing Staphylococcus aureus strains on pork sausage.Int J Food Microbiol. 2014 Jul 16;182-183:44-50. doi: 10.1016/j.ijfoodmicro.2014.05.010. Epub 2014 May 15. Int J Food Microbiol. 2014. PMID: 24859189
-
Elevated enterotoxin A expression and formation in Staphylococcus aureus and its association with prophage induction.Appl Environ Microbiol. 2012 Jul;78(14):4942-8. doi: 10.1128/AEM.00803-12. Epub 2012 Apr 27. Appl Environ Microbiol. 2012. PMID: 22544256 Free PMC article.
-
[Temperature dependence of staphylococcal enterotoxin A production by Staphylococcus aureus].Nihon Rinsho. 2012 Aug;70(8):1323-8. Nihon Rinsho. 2012. PMID: 22894066 Review. Japanese.
-
Prophage Activation in the Intestine: Insights Into Functions and Possible Applications.Front Microbiol. 2021 Dec 13;12:785634. doi: 10.3389/fmicb.2021.785634. eCollection 2021. Front Microbiol. 2021. PMID: 34966370 Free PMC article. Review.
Cited by
-
Reduced Enterotoxin D Formation on Boiled Ham in Staphylococcus Aureus Δagr Mutant.Toxins (Basel). 2017 Aug 25;9(9):263. doi: 10.3390/toxins9090263. Toxins (Basel). 2017. PMID: 28841182 Free PMC article.
-
The Enterotoxin Gene Profiles and Enterotoxin Production of Staphylococcus aureus Strains Isolated from Artisanal Cheeses in Belgium.Foods. 2023 Nov 3;12(21):4019. doi: 10.3390/foods12214019. Foods. 2023. PMID: 37959138 Free PMC article.
-
Effect of Temperature on the Expression of Classical Enterotoxin Genes among Staphylococci Associated with Bovine Mastitis.Pathogens. 2021 Aug 2;10(8):975. doi: 10.3390/pathogens10080975. Pathogens. 2021. PMID: 34451439 Free PMC article.
-
Coordination of prophage and global regulator leads to high enterotoxin production in staphylococcal food poisoning-associated lineage.Microbiol Spectr. 2024 Mar 5;12(3):e0292723. doi: 10.1128/spectrum.02927-23. Epub 2024 Feb 6. Microbiol Spectr. 2024. PMID: 38319074 Free PMC article.
-
Molecular Characteristics and Pathogenicity of Staphylococcus aureus Exotoxins.Int J Mol Sci. 2023 Dec 28;25(1):395. doi: 10.3390/ijms25010395. Int J Mol Sci. 2023. PMID: 38203566 Free PMC article. Review.
References
-
- The European Food Safety Authority. The European Centre for Disease Prevention and Control The european union summary report on trends and sources of zoonoses, zoonotic agents and food-borne outbreaks in 2012. EFSA J. 2014;3547:1–312.
-
- Argudin M.A., Mendoza M.C., Gonzalez-Hevua M.A., Bances M., Rodicio M.R. Genotypes, exotoxin gene content, and antimicrobial resistance of Staphylococcus aureus strains recovered from foods and food handlers. Appl. Environ. Microbiol. 2012;78:2930–2935. doi: 10.1128/AEM.07487-11. - DOI - PMC - PubMed
-
- Sospedra I., Soriano J.M., Manes J. Enterotoxinomics: The omic sciences in the study of staphylococcal toxins analyzed in food matrices. Food Res. Int. 2013;54:1052–1060. doi: 10.1016/j.foodres.2013.03.002. - DOI
Publication types
MeSH terms
Substances
LinkOut - more resources
Full Text Sources
Other Literature Sources
