

Chloroquine alleviates etoposide-induced centrosome amplification by inhibiting CDK2 in adrenocortical tumor cells
- PMID: 26690546
- PMCID: PMC4688395
- DOI: 10.1038/oncsis.2015.37
Chloroquine alleviates etoposide-induced centrosome amplification by inhibiting CDK2 in adrenocortical tumor cells
Abstract
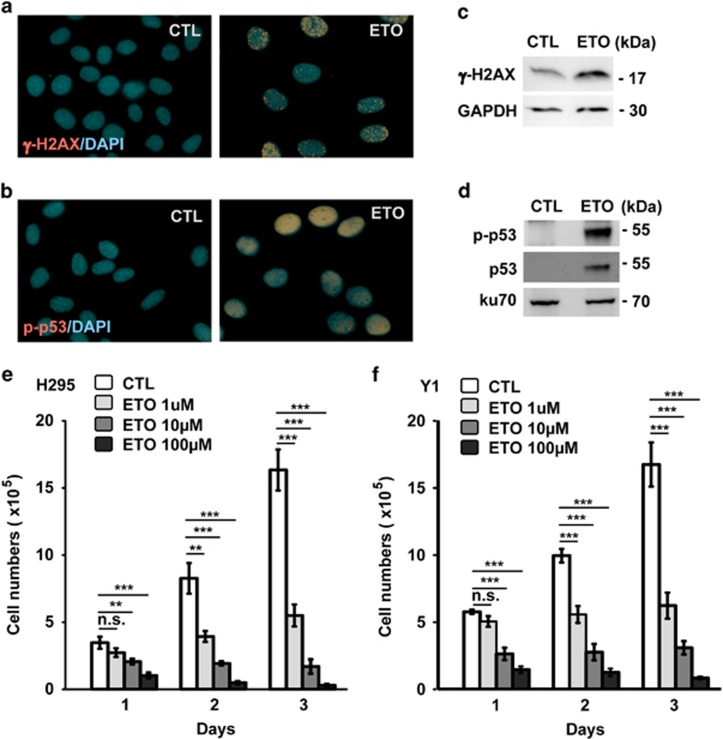
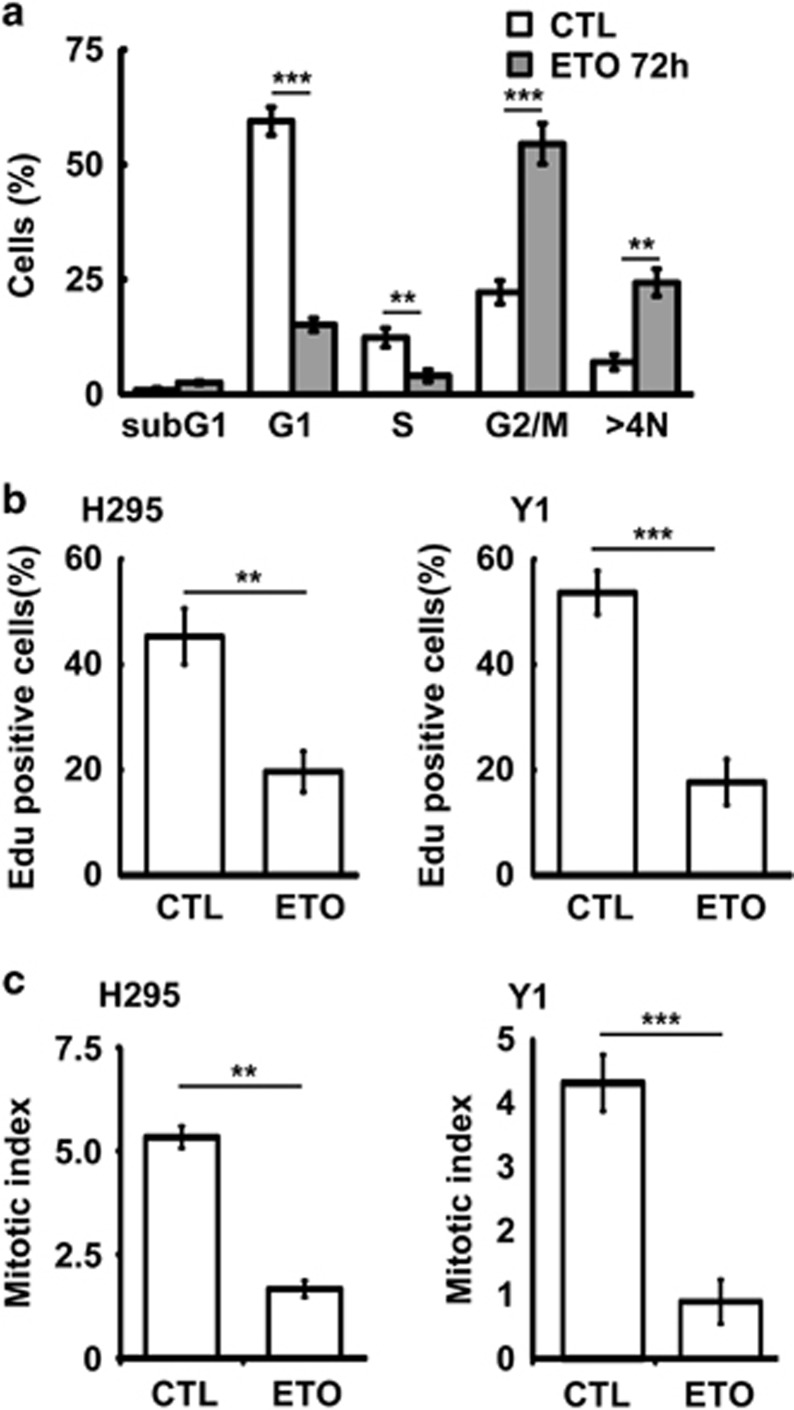
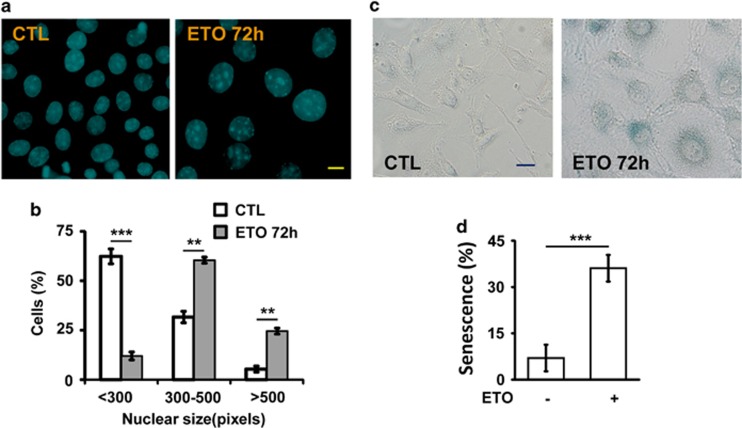
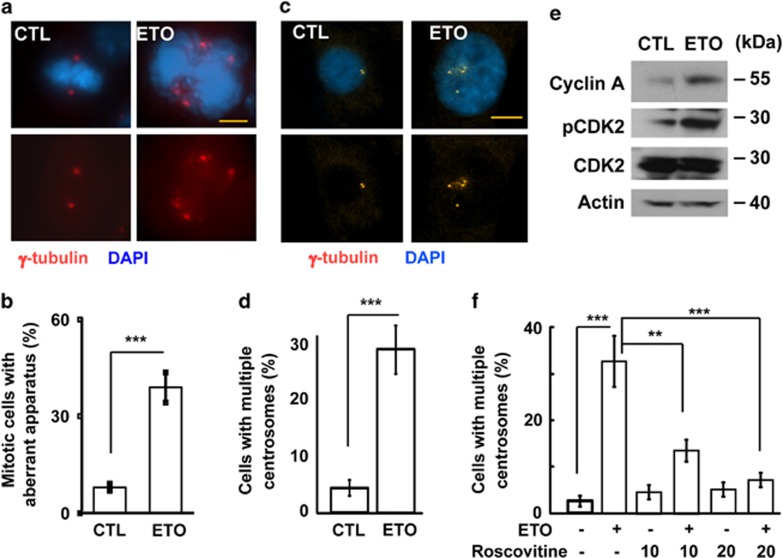
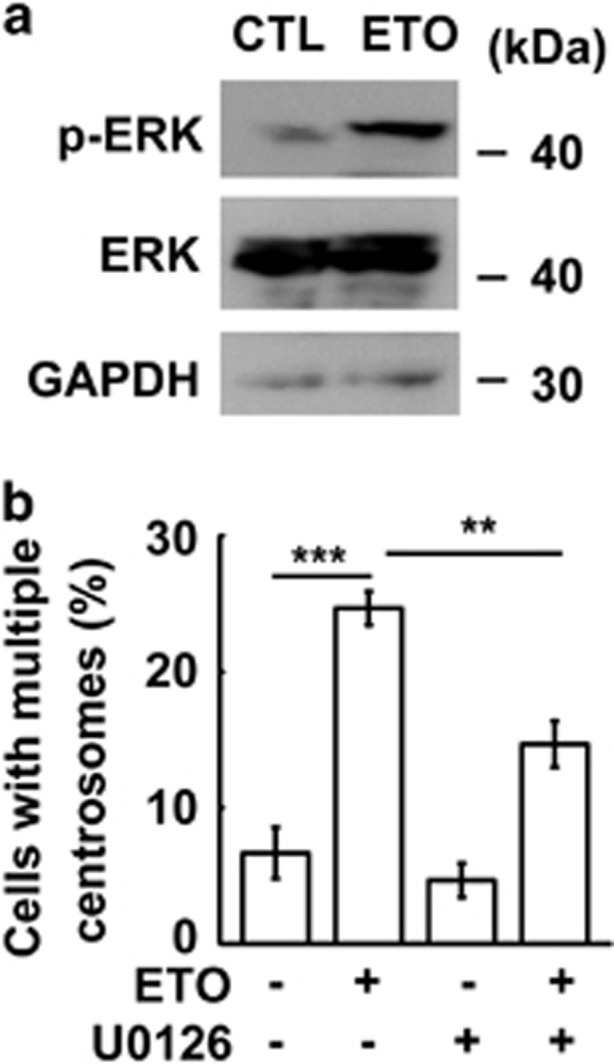
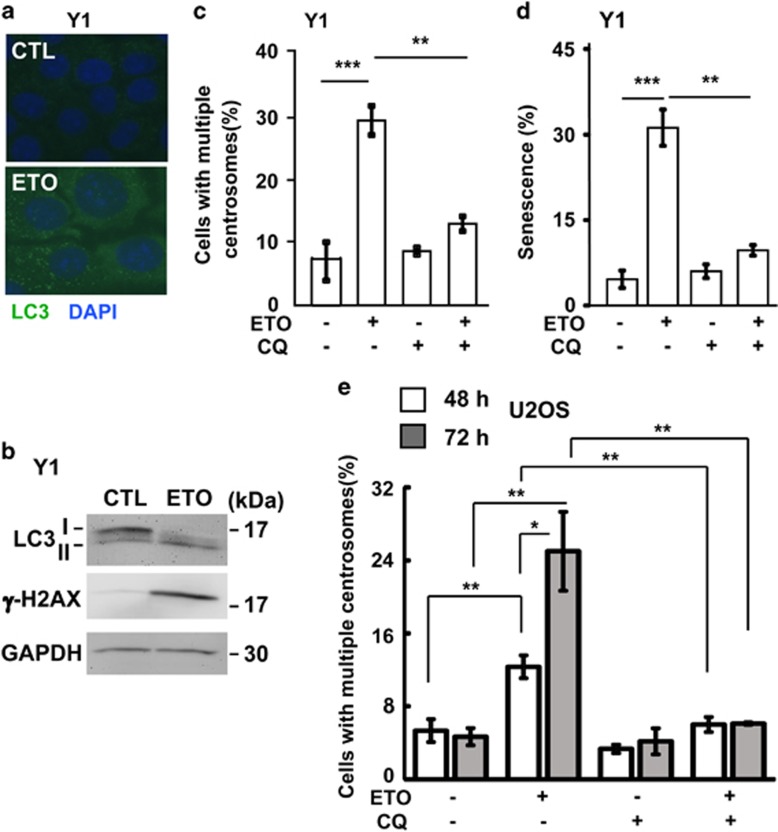
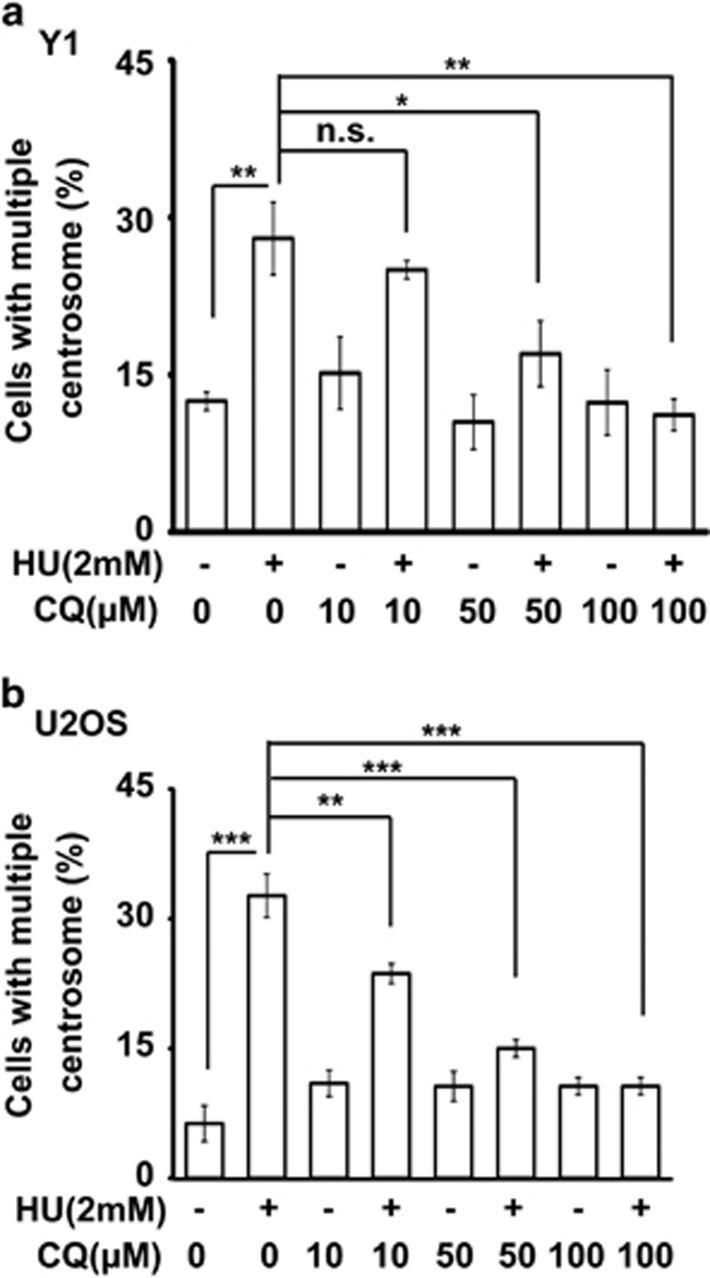
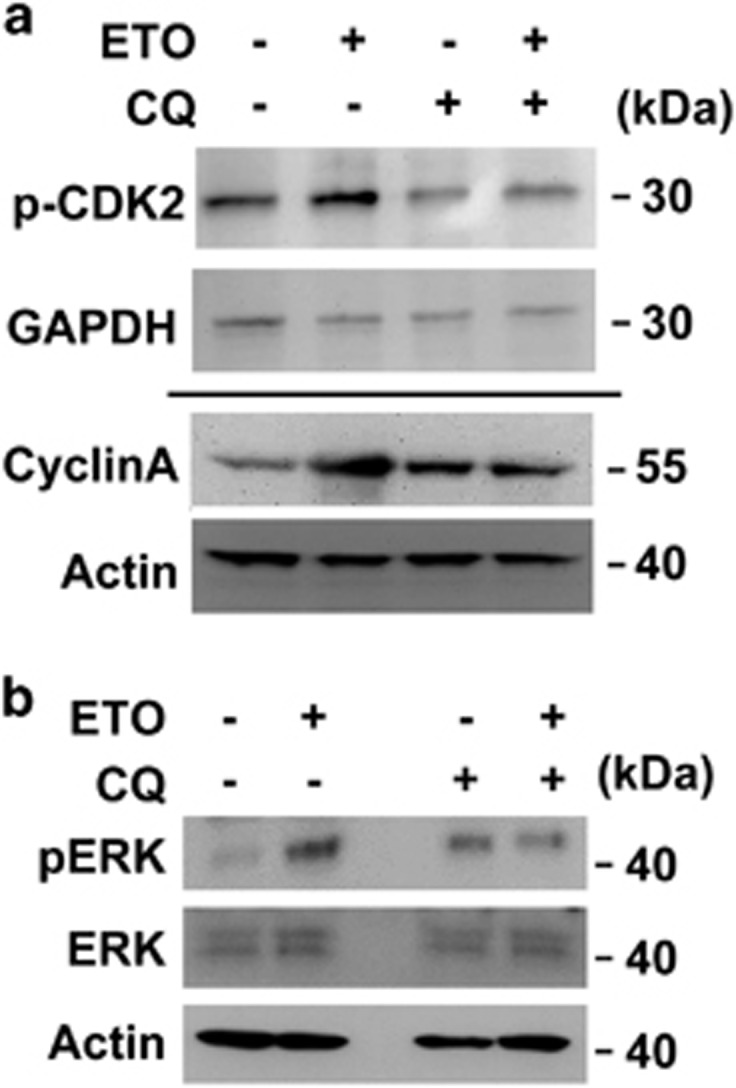
The antitumor drug etoposide (ETO) is widely used in treating several cancers, including adrenocortical tumor (ACT). However, when used at sublethal doses, tumor cells still survive and are more susceptible to the recurring tumor due to centrosome amplification. Here, we checked the effect of sublethal dose of ETO in ACT cells. Sublethal dose of ETO treatment did not induce cell death but arrested the ACT cells in G2/M phase. This resulted in centrosome amplification and aberrant mitotic spindle formation leading to genomic instability and cellular senescence. Under such conditions, Chk2, cyclin A/CDK2 and ERK1/2 were aberrantly activated. Pharmacological inactivation of Chk2, CDK2 or ERK1/2 or depletion of CDK2 or Chk2 inhibited the centrosome amplification in ETO-treated ACT cells. In addition, autophagy was activated by ETO and was required for ACT cell survival. Chloroquine, the autophagy inhibitor, reduced ACT cell growth and inhibited ETO-induced centrosome amplification. Chloroquine alleviated CDK2 and ERK, but not Chk2, activation and thus inhibited centrosome amplification in either ETO- or hydroxyurea-treated ACT cells. In addition, chloroquine also inhibited centrosome amplification in osteosarcoma U2OS cell lines when treated with ETO or hydroxyurea. In summary, we have demonstrated that chloroquine inhibited ACT cell growth and alleviated DNA damage-induced centrosome amplification by inhibiting CDK2 and ERK activity, thus preventing genomic instability and recurrence of ACT.
Figures
Similar articles
-
Etoposide Triggers Cellular Senescence by Inducing Multiple Centrosomes and Primary Cilia in Adrenocortical Tumor Cells.Cells. 2021 Jun 11;10(6):1466. doi: 10.3390/cells10061466. Cells. 2021. PMID: 34208028 Free PMC article.
-
DNA-PK/Chk2 induces centrosome amplification during prolonged replication stress.Oncogene. 2015 Mar 5;34(10):1263-9. doi: 10.1038/onc.2014.74. Epub 2014 Mar 24. Oncogene. 2015. PMID: 24662822
-
NF-κB induces abnormal centrosome amplification by upregulation of CDK2 in laryngeal squamous cell cancer.Int J Oncol. 2011 Oct;39(4):915-24. doi: 10.3892/ijo.2011.1125. Epub 2011 Jul 15. Int J Oncol. 2011. PMID: 21769424
-
Deregulation of the centrosome cycle and the origin of chromosomal instability in cancer.Adv Exp Med Biol. 2005;570:393-421. doi: 10.1007/1-4020-3764-3_14. Adv Exp Med Biol. 2005. PMID: 18727509 Review.
-
Centrosome amplification, chromosome instability and cancer development.Cancer Lett. 2005 Dec 8;230(1):6-19. doi: 10.1016/j.canlet.2004.12.028. Cancer Lett. 2005. PMID: 16253756 Review.
Cited by
-
Cordycepin Inhibits Human Gestational Choriocarcinoma Cell Growth by Disrupting Centrosome Homeostasis.Drug Des Devel Ther. 2020 Jul 27;14:2987-3000. doi: 10.2147/DDDT.S252401. eCollection 2020. Drug Des Devel Ther. 2020. PMID: 32801639 Free PMC article.
-
Korean Red ginseng prevents endothelial senescence by downregulating the HO-1/NF-κB/miRNA-155-5p/eNOS pathway.J Ginseng Res. 2021 Mar;45(2):344-353. doi: 10.1016/j.jgr.2020.08.002. Epub 2020 Aug 14. J Ginseng Res. 2021. PMID: 33841015 Free PMC article.
-
Polo‑like kinase 1 selective inhibitor BI2536 (dihydropteridinone) disrupts centrosome homeostasis via ATM‑ERK cascade in adrenocortical carcinoma.Oncol Rep. 2023 Sep;50(3):167. doi: 10.3892/or.2023.8604. Epub 2023 Jul 21. Oncol Rep. 2023. PMID: 37477142 Free PMC article.
-
Chloroquine, an autophagy inhibitor, potentiates the radiosensitivity of glioma initiating cells by inhibiting autophagy and activating apoptosis.BMC Neurol. 2016 Sep 20;16(1):178. doi: 10.1186/s12883-016-0700-6. BMC Neurol. 2016. PMID: 27644442 Free PMC article.
-
Fetuin-A Inhibits Placental Cell Growth and Ciliogenesis in Gestational Diabetes Mellitus.Int J Mol Sci. 2019 Oct 21;20(20):5207. doi: 10.3390/ijms20205207. Int J Mol Sci. 2019. PMID: 31640125 Free PMC article.
References
-
- 1Erickson LA, Rivera M, Zhang J. Adrenocortical carcinoma: review and update. Adv Anat Pathol 2014; 21: 151–159. - PubMed
-
- 2Fassnacht M, Libe R, Kroiss M, Allolio B. Adrenocortical carcinoma: a clinician's update. Nat Rev Endocrinol 2011; 7: 323–335. - PubMed
-
- 3Sharma N, Herts BR. Adrenocortical carcinoma presenting with Cushing syndrome. J Urol 2014; 191: 800–801. - PubMed
-
- 4Almeida MQ, Soares IC, Ribeiro TC, Fragoso MC, Marins LV, Wakamatsu A et al. Steroidogenic factor 1 overexpression and gene amplification are more frequent in adrenocortical tumors from children than from adults. J Clin Endocrinol Metab 2010; 95: 1458–1462. - PubMed
-
- 5Boulle N, Logie A, Gicquel C, Perin L, Le Bouc Y. Increased levels of insulin-like growth factor II (IGF-II) and IGF-binding protein-2 are associated with malignancy in sporadic adrenocortical tumors. J Clin Endocrinol Metab 1998; 83: 1713–1720. - PubMed
LinkOut - more resources
Full Text Sources
Other Literature Sources
Miscellaneous
