. 2015 Dec 21:15:995.
doi: 10.1186/s12885-015-2014-2.

Up-regulation of Orai1 expression and store operated Ca(2+) entry following activation of membrane androgen receptors in MCF-7 breast tumor cells

Affiliations

Up-regulation of Orai1 expression and store operated Ca(2+) entry following activation of membrane androgen receptors in MCF-7 breast tumor cells

Guilai Liu et al. BMC Cancer. .

Abstract

Background: Membrane androgen receptors (mAR) are functionally expressed in a variety of tumor-cells including the breast tumor-cell line MCF-7. They are specifically activated by testosterone albumin conjugates (TAC). The mAR sensitive signaling includes activation of Ras-related C3 botulinum toxin substrate 1 (Rac1) and reorganization of the actin filament network. Signaling of tumor-cells may further involve up-regulation of pore forming Ca(2+) channel protein Orai1, which accomplishes store operated Ca(2+) entry (SOCE). This study explored the regulation of Orai1 abundance and SOCE by mAR.

Methods: Actin filaments were visualized utilizing confocal microscopy, Rac1 activity using GST-GBD assay, Orai1 transcript levels by RT-PCR and total protein abundance by western blotting, Orai1 abundance at the cell surface by confocal microscopy and FACS-analysis, cytosolic Ca(2+) activity ([Ca(2+)]i) utilizing Fura-2-fluorescence, and SOCE from increase of [Ca(2+)]i following readdition of Ca(2+) after store depletion with thapsigargin (1 μM).

Results: TAC treatment of MCF-7 cells was followed by Rac1 activation, actin polymerization, transient increase of Orai1transcript levels and protein abundance, and transient increase of SOCE. The transient increase of Orai1 protein abundance was abrogated by Rac1 inhibitor NSC23766 (50 μM) and by prevention of actin reorganization with cytochalasin B (1 μM).

Conclusions: mAR sensitive Rac1 activation and actin reorganization contribute to the regulation of Orai1 protein abundance and SOCE.


Figures
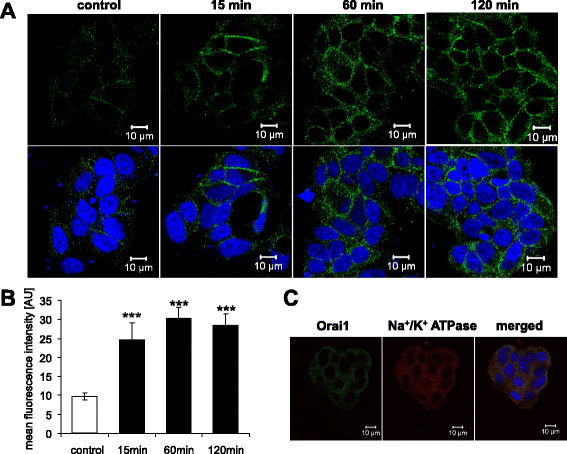
Fig. 1
Fig. 1
Effect of mAR activation on Orai1 protein abundance at the surface of MCF-7 cells. a Original confocal microscopy of non-permeabilized MCF7 cells treated for 15–120 min with TAC-BSA (100 nM) and stained with anti-Orai1 antibody (green) and DRAQ-5 (blue) for nuclei. b Arithmetic means ± SEM (n = 6) of Orai1 protein abundance in non-permeabilized MCF-7 cells without (white bar) and with (black bars) a 15 min to 120 min treatment with testosterone-albumin-conjugates (TAC, 100 nM). ***(p < 0.001) indicates statistically significant difference from absence of TAC. c Original confocal microscopy demonstrating colocalization of Orai1 (green) and Na+/K+ ATPase (red) in MCF7 cells. DRAQ-5 (blue) indicates nuclei
Fig. 2
Fig. 2
Effect of mAR activation on Orai1 transcript levels and total protein abundance. a Arithmetic means ± SEM (n = 6) of Orai 1 transcript levels as determined by RT-PCR in MCF-7 cells without (white bar) and with (black bars) a 60 min treatment with testosterone-albumin-conjugates (TAC, 100 nM). *(p < 0.05) indicates statistically significant difference from absence of TAC. b Original Western blot and arithmetic means ± SEM (n = 3) of protein abundance in MCF-7 cells without (white bar) and with (black bars) a 60 min and 120 min treatment with testosterone-albumin-conjugates (TAC, 100 nM). *(p < 0.05) indicates statistically significant difference from absence of TAC
Fig. 3
Fig. 3
Modulation of dynamic actin polymerization by mAR activation of MCF-7 cells. a Original confocal images of rhodamine-phalloidin binding to F-actin (red) and DRAQ-5 for nuclei (blue) in MCF-7 cells without (control) and with a prior 15–120 min treatment with testosterone-albumin-conjugates (TAC, 100 nM). Arrows point to formation of actin stress fibers. b Arithmetic means ± SEM (n = 6) of actin fluorescence in MCF-7 cells without (white bar) and with (black bars) a 15 min to 120 min treatment with testosterone-albumin-conjugates (TAC, 100 nM). *(p < 0.05) and ***(p < 0.001) indicate statistically significant difference from absence of TAC
Fig. 4
Fig. 4
Effect of mAR activation on abundance of activated Rac1 protein in MCF-7 cells. a Affinity precipitation with GST (glutatione S-transferase) -PBD (p21 binding domain) revealing by immunoblotting (IB) the protein abundance of activated (upper lane) and total (lower lane) Rac1 prior to (control) and 15–120 min following treatment with testosterone-albumin-conjugates (TAC, 100 nM) and TAC + Rac1 inhibitor NSC23766 (50 μM). b Arithmetic means ± SEM (n = 4) of the relative fold increases of activated over total Rac1 protein abundance prior to (taken as 1) and 15–120 min following treatment with testosterone-albumin-conjugates (TAC, 100 nM) and TAC + Rac1 inhibitor NSC23766 (50 μM). **(p < 0.01) indicates statistically significant difference from absence of TAC
Fig. 5
Fig. 5
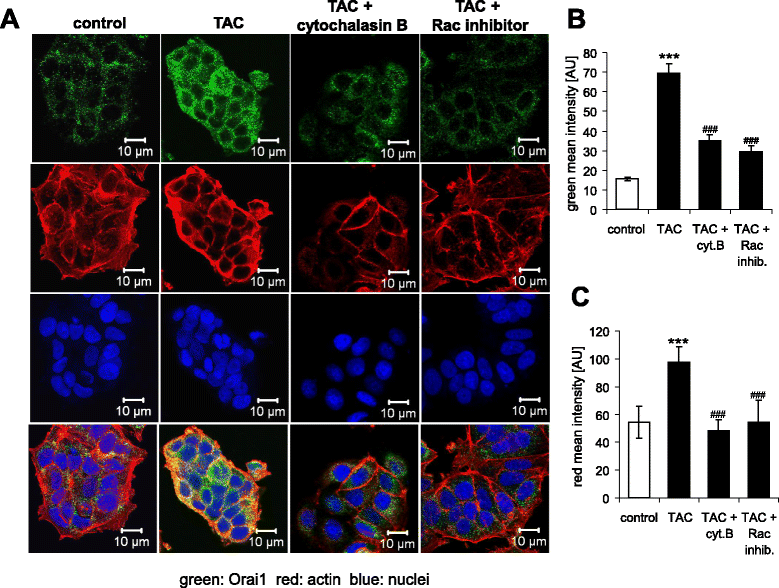
Effect of mAR activation on actin cytoskeleton and membrane Orai1 abundance of MCF-7 cells. a Original confocal microscopy of actin filaments (red) and Orai1 (green) in non-permeabilized MCF-7 cells without (control) and with a prior 60 min treatment with testosterone-albumin-conjugates (TAC, 100 nM) alone (TAC) or together with cytochalasin B (1 μM) (TAC + cytochalasin B), or with Rac inhibitor NSC23766 (50 μM) (TAC+ Rac inhibitor). b, c Arithmetic means ± SEM of (b) Orai1 abundance (n = 6) and of (c) actin fluorescence (n = 6) in MCF-7 cells without (white bar) and with (black bars) a 60 min treatment with testosterone-albumin-conjugates (TAC, 100 nM). ***(p < 0.001) indicates statistically significant difference from absence of TAC, ###(p < 0.001) indicates statistically significant difference from presence of TAC without presence of inhibitors
Fig. 6
Fig. 6
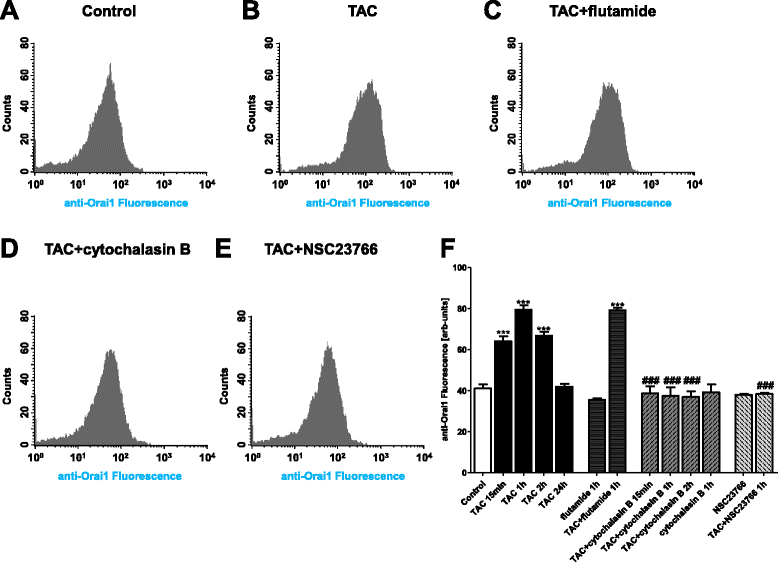
Total Orai1 abundance in MCF-7 cells following mAR activation in absence and presence of cytochalasin B and Rac1 inhibitor NSC23766. a-e Original histogram of anti-Orai1 fluorescence in permeabilized MCF-7 cells without (a) and with (b-e) a 60 min treatment with testosterone-albumin-conjugates (TAC, 100 nM) in the absence (b) and presence of flutamide (c), cytochalasin B (d) and Rac inhibitor (e). f Arithmetic means ± SEM (n = 6) of the Orai 1 protein abundance in permeabilized MCF-7 cells without (white bar) and with a 15 min to 24 h treatment with testosterone-albumin-conjugates (TAC, 100 nM) in the absence (black bars) and presence of flutamide (1 μM) (dark grey bars) cytochalasin B (1 μM) (middle grey bars), or Rac inhibitor NSC23766 (50 μM) (light grey bars). ***(p < 0.001) indicates statistically significant difference from absence of TAC, ###(p < 0.001) indicates statistically significant difference from presence of TAC without presence of inhibitors
Fig. 7
Fig. 7
Cell membrane Orai1 abundance in MCF-7 cells following mAR activation in absence and presence of cytochalasin B and Rac1 inhibitor NSC23766. a-d Original histogram of anti-Orai1 fluorescence in non-permeabilized MCF-7 cells without (a) and with (b-d) a 60 min treatment with testosterone-albumin-conjugates (TAC, 100 nM) in the absence (b) and presence of cytochalasin B (c) and Rac inhibitor (d). e Arithmetic means ± SEM (n = 6) of the Orai 1 protein abundance in non-permeabilized MCF-7 cells without (white bar) and with a 60 min treatment with testosterone-albumin-conjugates (TAC, 100 nM) in the absence (black bar) and presence of cytochalasin B (1 μM) (middle grey bars), or Rac inhibitor NSC23766 (50 μM) (light grey bars). ***(p < 0.001) indicates statistically significant difference from absence of TAC, ##(p < 0.01) indicates statistically significant difference from presence of TAC without presence of inhibitors
Fig. 8
Fig. 8
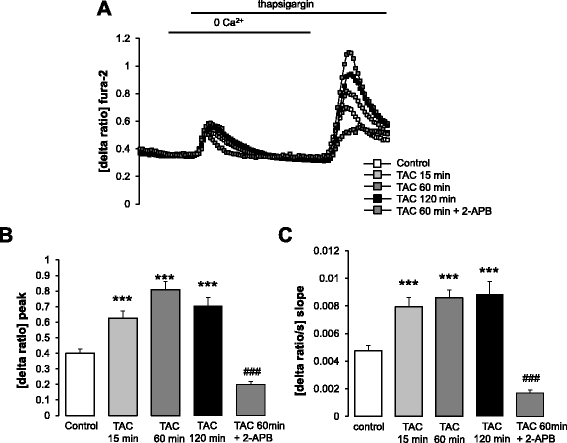
Effect of mAR activation on intracellular Ca2+ release and store operated Ca2+ entry (SOCE) in MCF-7 cells. a Representative tracings of fura-2 fluorescence-ratio in fluorescence spectrometry before, during and after Ca2+ depletion with subsequent addition of thapsigargin (1 μM) in MCF-7 cells without (control, open squares) and with (grey and black squares) treatment with testosterone-albumin-conjugates (TAC, 100 nM) for 15–120 min in the absence and presence of the Orai-1 inhibitor 2-APB (50 μM). b, c Arithmetic means (± SEM, n = 3–5, each experiment 10–30 cells) of slope (b) and peak (c) increase of fura-2-fluorescence-ratio following re-addition of extracellular Ca2+ in MCF-7 cells without (control, white bars) and with (grey and black bars) treatment with TAC (100 nM) for 15–120 min in the absence and presence of the Orai-1 inhibitor 2-APB (50 μM). ***(p < 0.001) indicates statistically significant difference from absence of TAC, ###(p < 0.001) indicates statistically significant difference from 60 min presence of TAC without presence of 2-APB (ANOVA)

References

    1. Kampa M, Papakonstanti EA, Hatzoglou A, Stathopoulos EN, Stournaras C, Castanas E. The human prostate cancer cell line LNCaP bears functional membrane testosterone receptors that increase PSA secretion and modify actin cytoskeleton. FASEB J. 2002;16:1429–31. - PubMed
    1. Papakonstanti EA, Kampa M, Castanas E, Stournaras C. A rapid, nongenomic, signaling pathway regulates the actin reorganization induced by activation of membrane testosterone receptors. Mol Endocrinol. 2003;17:870–81. doi: 10.1210/me.2002-0253. - DOI - PubMed
    1. Sen A, O'Malley K, Wang Z, Raj GV, Defranco DB, Hammes SR. Paxillin regulates androgen- and epidermal growth factor-induced MAPK signaling and cell proliferation in prostate cancer cells. J Biol Chem. 2010;285:28787–95. doi: 10.1074/jbc.M110.134064. - DOI - PMC - PubMed
    1. Sun YH, Gao X, Tang YJ, Xu CL, Wang LH. Androgens induce increases in intracellular calcium via a G protein-coupled receptor in LNCaP prostate cancer cells. J Androl. 2006;27:671–8. doi: 10.2164/jandrol.106.000554. - DOI - PubMed
    1. Papadopoulou N, Charalampopoulos I, Alevizopoulos K, Gravanis A, Stournaras C. Rho/ROCK/actin signaling regulates membrane androgen receptor induced apoptosis in prostate cancer cells. Exp Cell Res. 2008;314:3162–74. doi: 10.1016/j.yexcr.2008.07.012. - DOI - PubMed

Publication types