. 2015 Dec 21;10(12):e0145114.
doi: 10.1371/journal.pone.0145114. eCollection 2015.

Influence of the Accuracy of Angiography-Based Reconstructions on Velocity and Wall Shear Stress Computations in Coronary Bifurcations: A Phantom Study

Affiliations

Influence of the Accuracy of Angiography-Based Reconstructions on Velocity and Wall Shear Stress Computations in Coronary Bifurcations: A Phantom Study

Jelle T C Schrauwen et al. PLoS One. .

Abstract

Introduction: Wall shear stress (WSS) plays a key role in the onset and progression of atherosclerosis in human coronary arteries. Especially sites with low and oscillating WSS near bifurcations have a higher propensity to develop atherosclerosis. WSS computations in coronary bifurcations can be performed in angiography-based 3D reconstructions. It is essential to evaluate how reconstruction errors influence WSS computations in mildly-diseased coronary bifurcations. In mildly-diseased lesions WSS could potentially provide more insight in plaque progression.

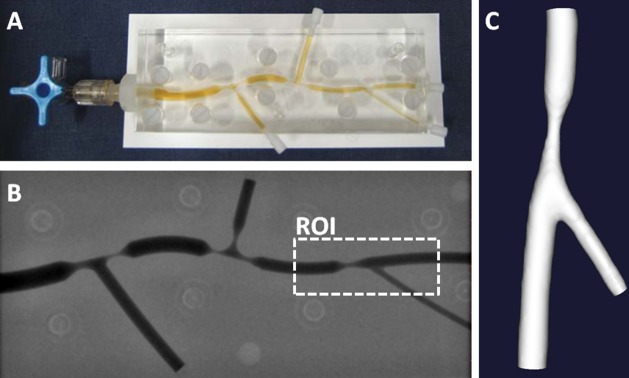
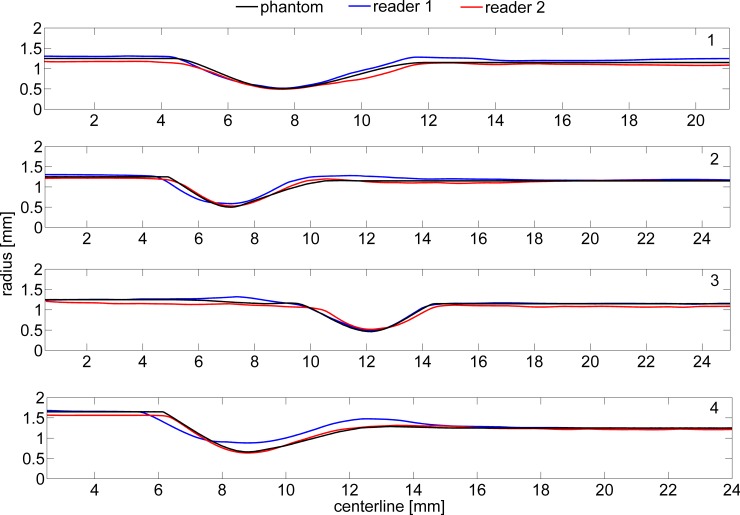
Materials methods: Four Plexiglas phantom models of coronary bifurcations were imaged with bi-plane angiography. The lumens were segmented by two clinically experienced readers. Based on the segmentations 3D models were generated. This resulted in three models per phantom: one gold-standard from the phantom model itself, and one from each reader. Steady-state and transient simulations were performed with computational fluid dynamics to compute the WSS. A similarity index and a noninferiority test were used to compare the WSS in the phantoms and their reconstructions. The margin for this test was based on the resolution constraints of angiography.

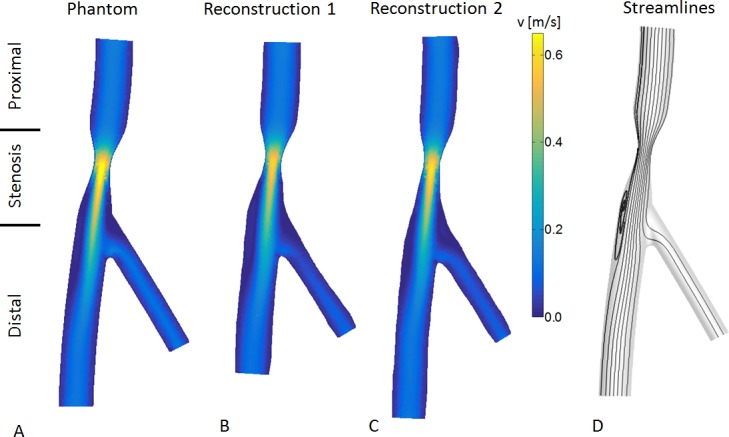
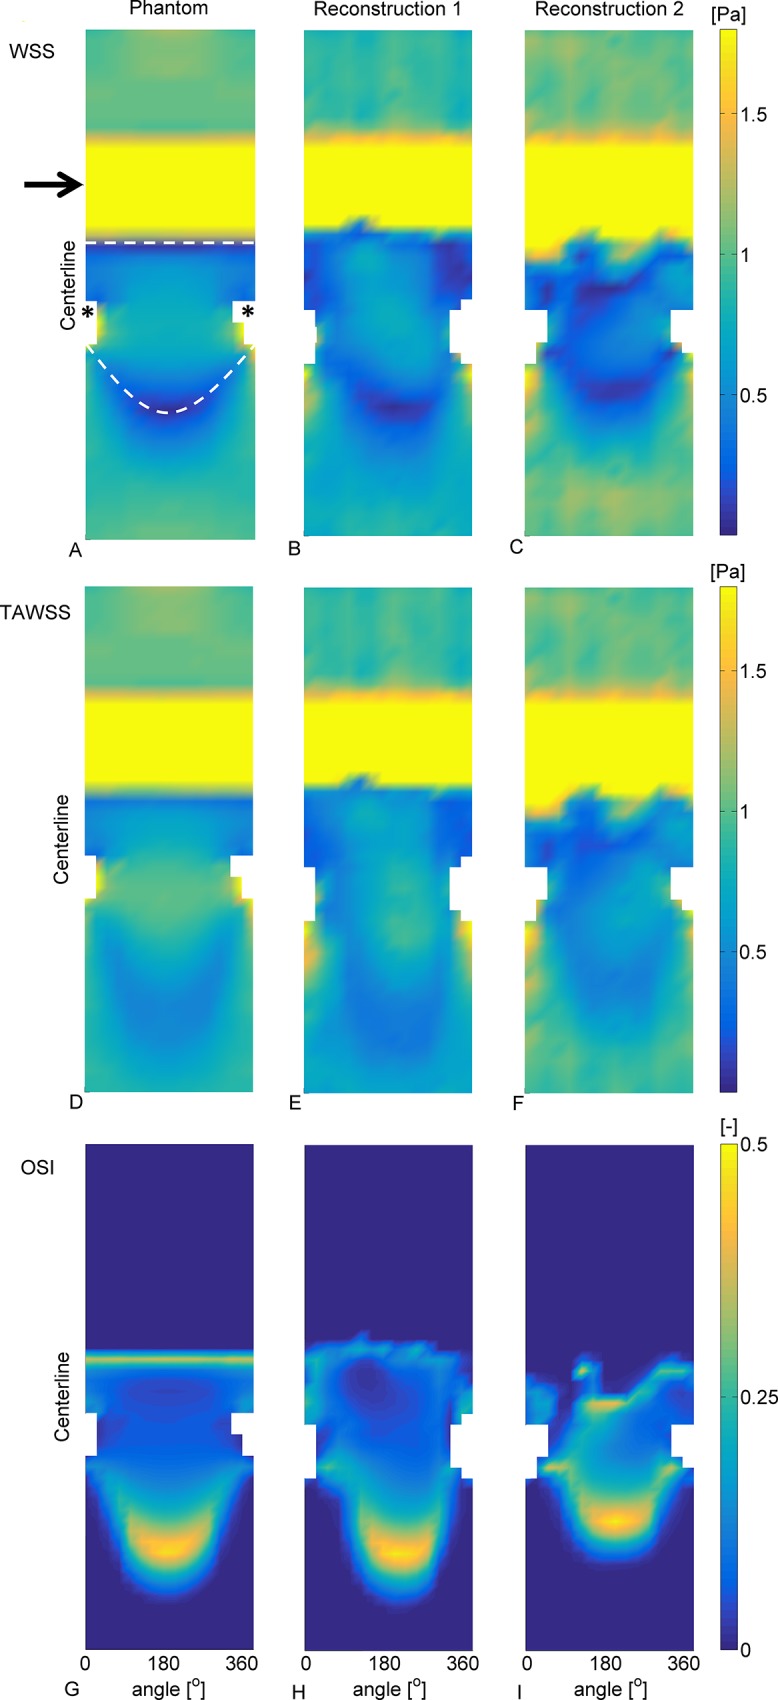
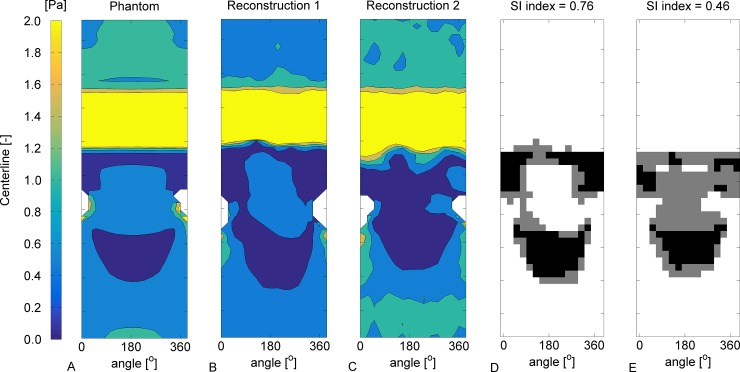
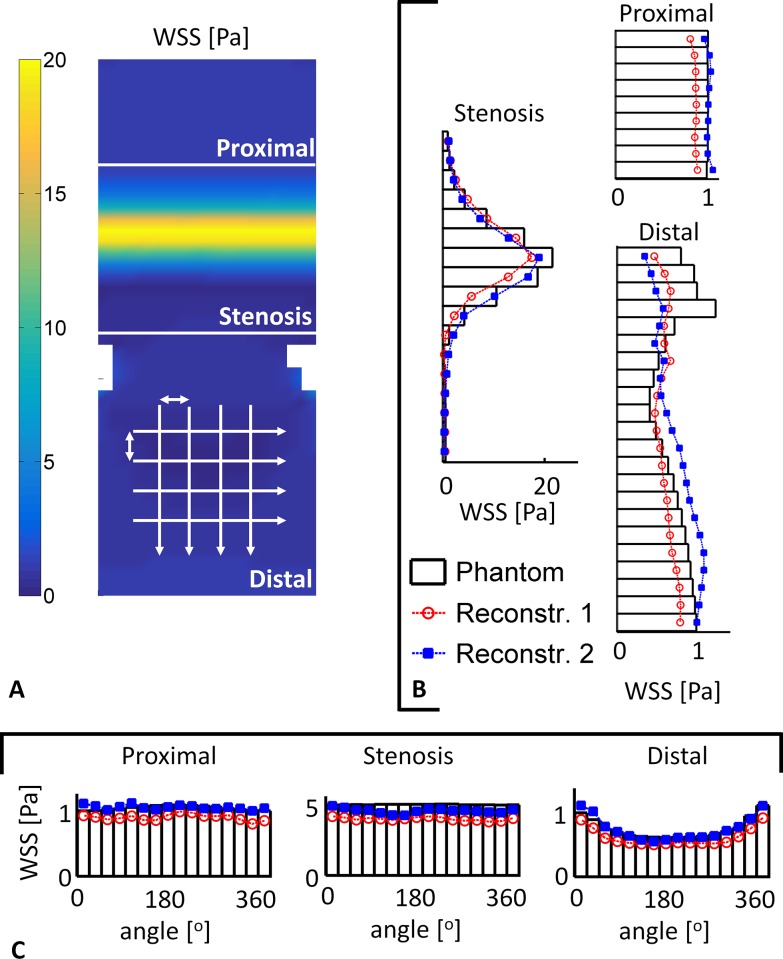
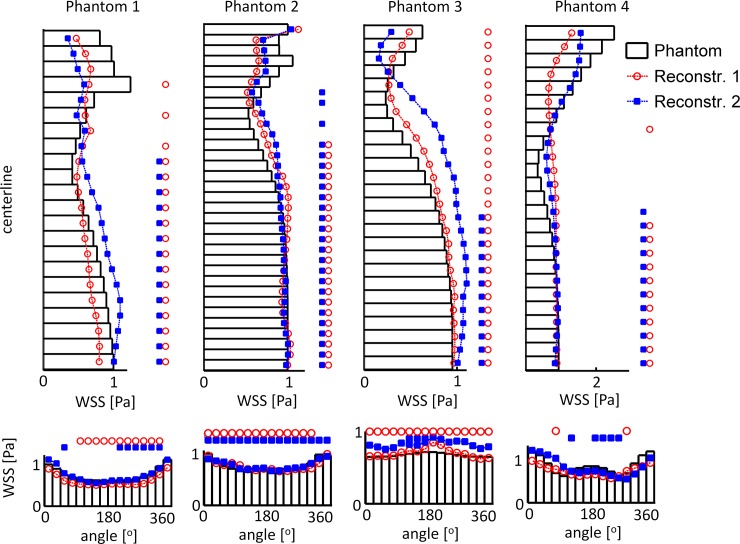
Results: The reconstruction errors were similar to previously reported data; in seven out of eight reconstructions less than 0.10 mm. WSS in the regions proximal and far distal of the stenosis showed a good agreement. However, the low WSS areas directly distal of the stenosis showed some disagreement between the phantoms and the readers. This was due to small deviations in the reconstruction of the stenosis that caused differences in the resulting jet, and consequently the size and location of the low WSS area.

Discussion: This study showed that WSS can accurately be computed within angiography-based 3D reconstructions of coronary arteries with early stage atherosclerosis. Qualitatively, there was a good agreement between the phantoms and the readers. Quantitatively, the low WSS regions directly distal to the stenosis were sensitive to small reconstruction errors.


Conflict of interest statement

Competing Interests: The authors of this manuscript have the following competing interests: Jean-Paul Aben is employed by Pie Medical Imaging. The commercial affiliation to Pie Medical Imaging does not alter their adherence to PLOS ONE policies on sharing data and materials.

Figures

Fig 1
Fig 1. Overview of the 3D reconstruction steps of a phantom model with bi-plane angiography.
A: Original phantom model filled with contrast agent. B: An angiography recording of the phantom. A region of interest (ROI) is indicated around a section that can be regarded as mildly stenosed. C: Final 3D reconstruction.
Fig 2
Fig 2. The radii of the main branch of the four original phantom models and of the two reconstructions based on the segmentation by the two readers.
Fig 3
Fig 3. The velocity results of the CFD computations in a plane through the center of phantom 1 and its two reconstructions.
In all models a jet forms at the neck of the stenosis and directly distal of the stenosis a recirculation zone is observed. A: Results in the phantom model. B: Reconstruction based on the segmentations from reader 1. C: Reconstruction based on the segmentations from reader 2. D: General streamlines observed in the computations.
Fig 4
Fig 4. 2D maps of the WSS, TAWSS and OSI in the main branch phantom 1.
The arrow indicates the stenosis and the asterisk the location of the side branch. A-C: Results of the WSS in the phantom (A), reconstruction 1 (B) and reconstruction 2 (C). The color map was saturated to visualize the low WSS. In the area directly distal to the stenosis there was retrograde flow (in between the white dashed lines). The crescent-shaped line where the WSS is zero indicates the transition from retrograde to antegrade flow. D-F: TAWSS results. Similar patterns were observed as for the WSS, although for the TAWSS the results were more averaged out. G-I: OSI results. Due to the pulsatility a zone of high oscillatory shear is formed in the distal region. This zone is indicative for the movement of the transition zone from retrograde to antegrade flow throughout a cycle.
Fig 5
Fig 5. Analysis of SI of WSS in phantom 1 and the corresponding reconstructions.
A: Contour plot of the WSS. Similar as Fig 4 a low WSS region is located directly distal of the stenosis and distal of the side branch. B: Contour plot of the WSS in the reconstruction based on the segmentation from reader 1. C: Contour plot in reconstruction 2. D: Plot of the SI between the phantom and reconstruction 1. The white indicates WSS above 0.5 Pa in both the phantom and the reconstruction. Gray indicates low WSS in either the phantom or the reconstruction. Black indicates low WSS in both the phantom and the reconstruction. E: SI between the phantom and reconstruction 2.
Fig 6
Fig 6. Quantitative analysis of the WSS in phantom 1.
The white lines mark the three regions. A: 2D WSS map of phantom 1.The arrows indicate the direction of the averaging procedure. B: The circumferential means in the three regions. The bars indicate the mean circumferential WSS in the phantom and the lines the WSS from reconstruction 1 (red circle) and reconstruction 2 (blue square). In the proximal and stenosis region the WSS from the readers match the WSS in the phantom. In the distal region more pronounced differences are observed, primarily directly after the stenosis. C: Axial means in the three regions. In all regions the WSS from the readers match the WSS in the phantom.
Fig 7
Fig 7. Circumferential and axial mean WSS in the four phantoms and reconstructions 1 and 2.
The asterisks indicate the locations were the WSS in the phantom and the readers did not reach clinical equivalence. Particularly in the region directly distal of the stenosis the WSS is not clinically equivalent. Far distal the circumferential means are clinically equivalent. The axial means in the readers are similar as the phantom, though equivalence in not reached everywhere.

Similar articles

Cited by

References

    1. Virmani R, Kolodgie FD, Burke AP, Farb A, Stephen M, Schwartz SM. Lessons From Sudden Coronary Death : A Comprehensive Morphological Classification Scheme for Atherosclerotic Lesions. Arterioscler Thromb Vasc Biol. 2000;20: 1262–1275. - PubMed
    1. Newby DE. Triggering of acute myocardial infarction: beyond the vulnerable plaque. Heart. 2010;96: 1247–1251. 10.1136/hrt.2009.175141 - DOI - PubMed
    1. Slager C, Wentzel J, Gijsen F, Schuurbiers J, van der Wal A, van der Steen A, et al. The role of shear stress in the generation of rupture-prone vulnerable plaques. Nat Clin Pract Cardiovasc Med. 2005;2: 401–407. 10.1038/ncpcardio0274 - DOI - PubMed
    1. Stone PH, Saito S, Takahashi S, Makita Y, Nakamura S, Kawasaki T, et al. Prediction of progression of coronary artery disease and clinical outcomes using vascular profiling of endothelial shear stress and arterial plaque characteristics: the PREDICTION Study. Circulation. 2012;126: 172–81. 10.1161/CIRCULATIONAHA.112.096438 - DOI - PubMed
    1. Gijsen FJH, Wentzel JJ, Thury A, Mastik F, Schaar JA, Schuurbiers JCH, et al. Strain distribution over plaques in human coronary arteries relates to shear stress. Am J Physiol Heart Circ Physiol. 2008;295: 1608–1614. 10.1152/ajpheart.01081.2007 - DOI - PubMed

Publication types