. 2015 Mar;120(3):495-514.
doi: 10.1002/2014JE004737. Epub 2015 Mar 21.

Organic molecules in the Sheepbed Mudstone, Gale Crater, Mars

Affiliations

Organic molecules in the Sheepbed Mudstone, Gale Crater, Mars

C Freissinet et al. J Geophys Res Planets. 2015 Mar.

Abstract

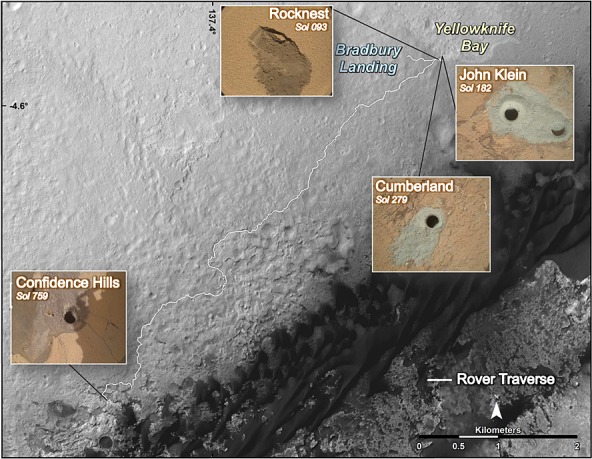
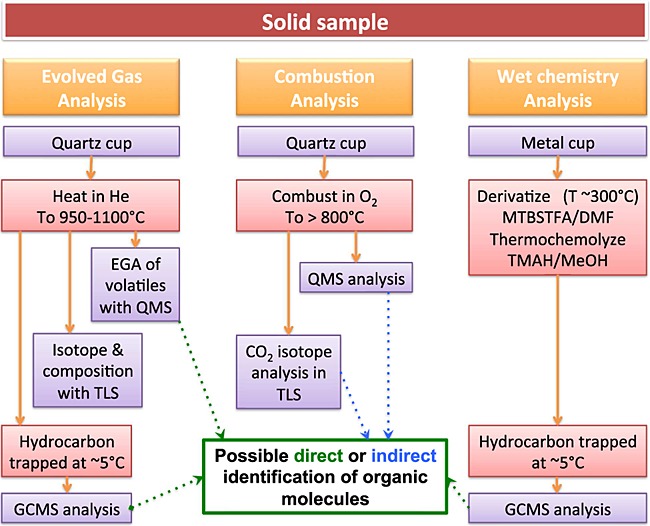
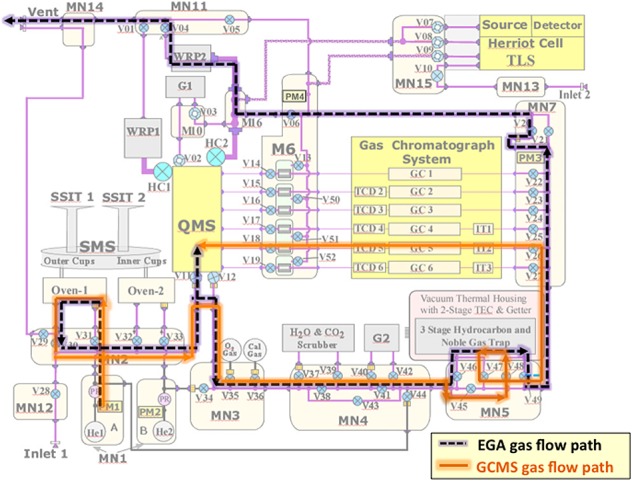
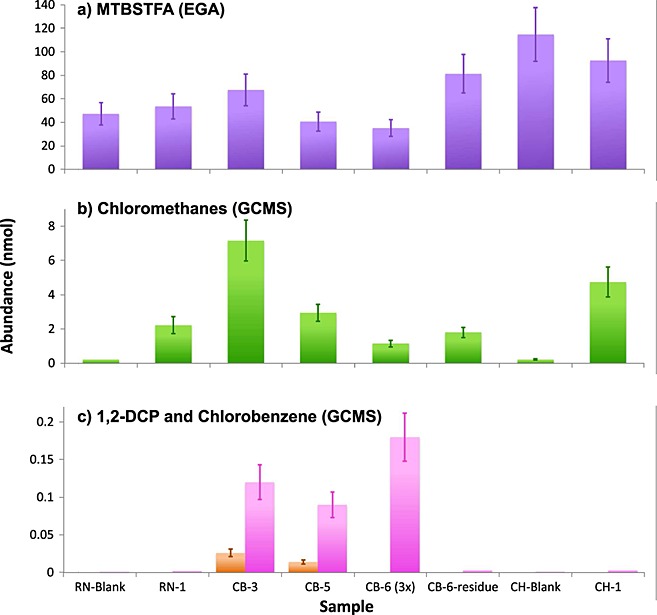
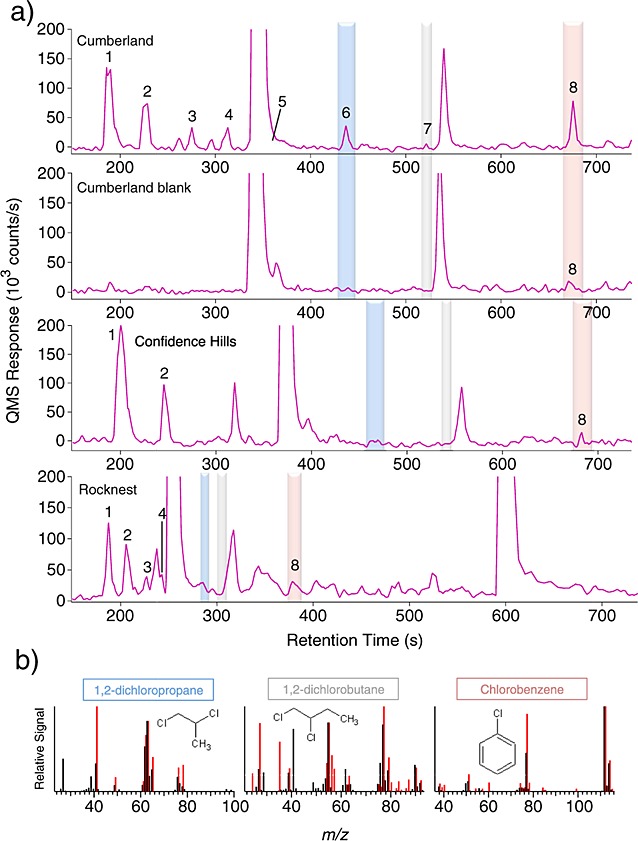
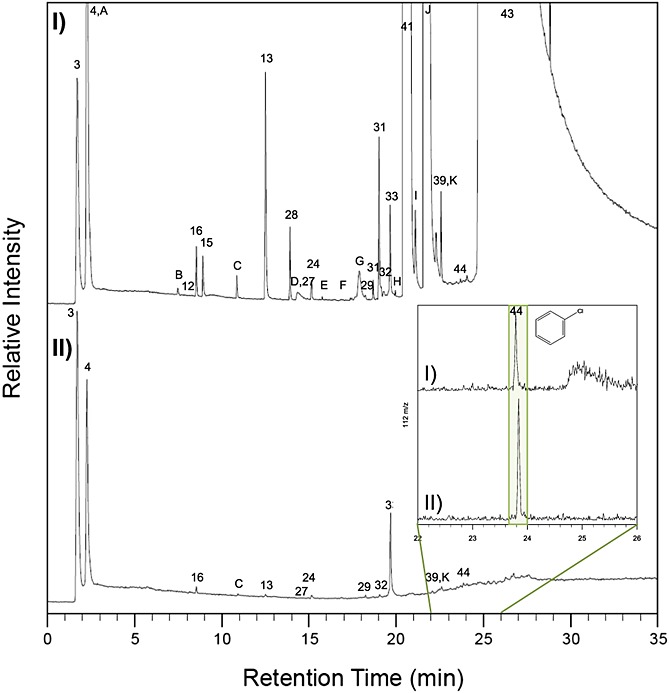
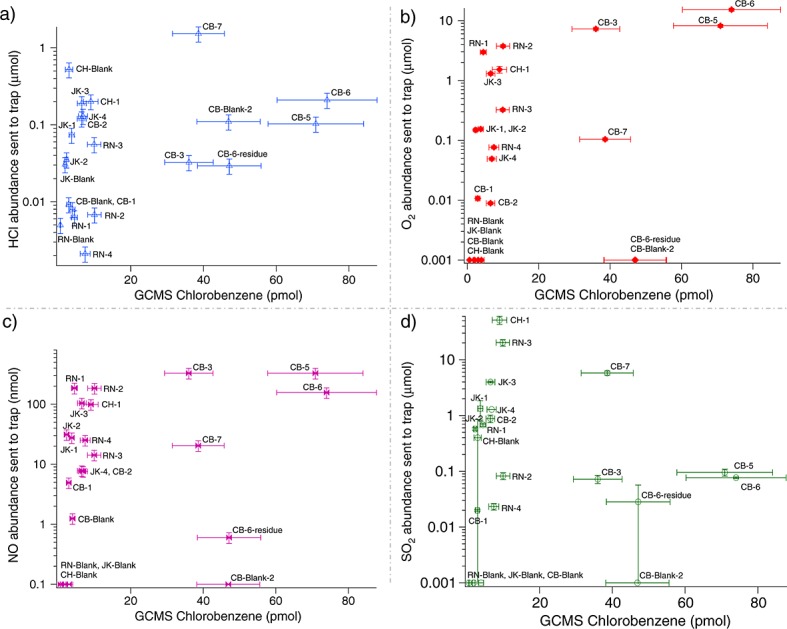
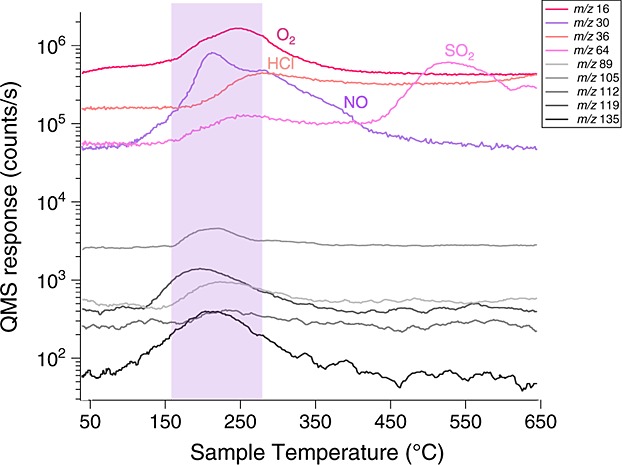
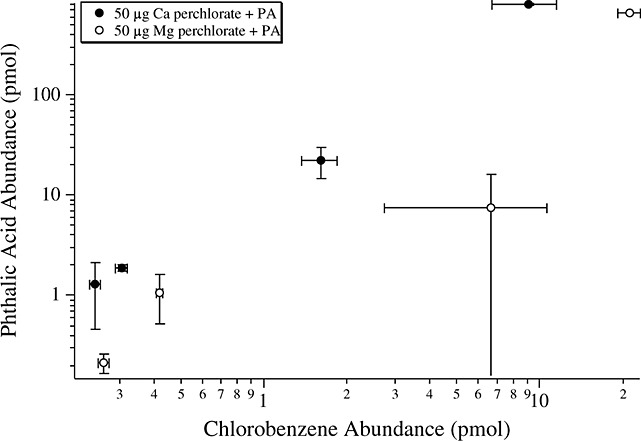
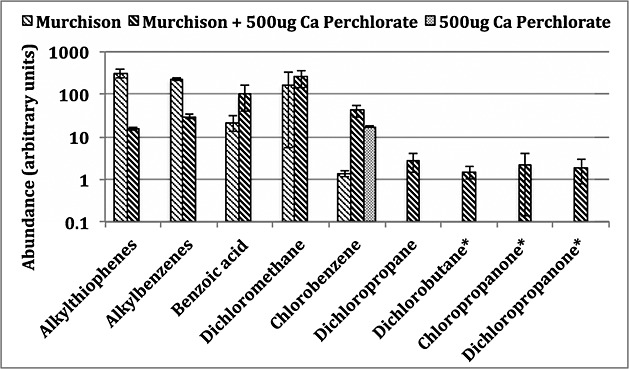
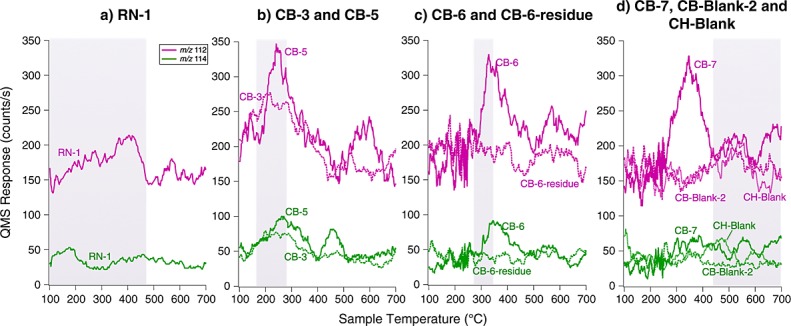
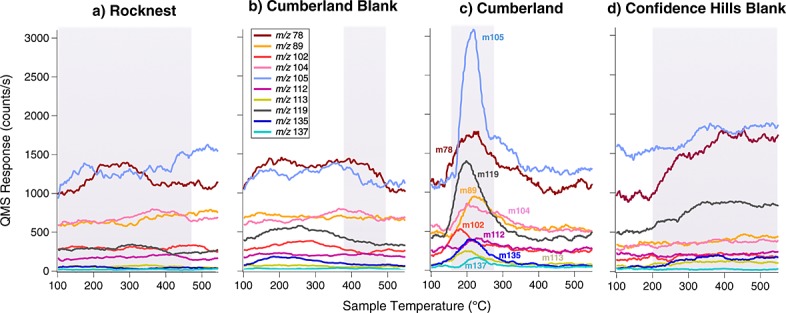
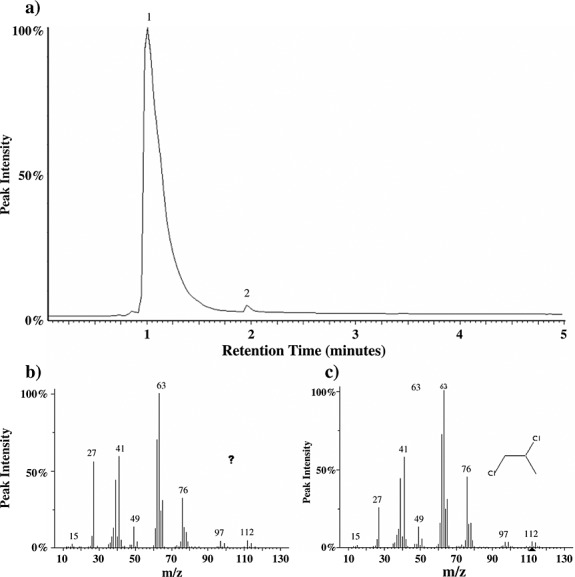
The Sample Analysis at Mars (SAM) instrument on board the Mars Science Laboratory Curiosity rover is designed to conduct inorganic and organic chemical analyses of the atmosphere and the surface regolith and rocks to help evaluate the past and present habitability potential of Mars at Gale Crater. Central to this task is the development of an inventory of any organic molecules present to elucidate processes associated with their origin, diagenesis, concentration, and long-term preservation. This will guide the future search for biosignatures. Here we report the definitive identification of chlorobenzene (150-300 parts per billion by weight (ppbw)) and C2 to C4 dichloroalkanes (up to 70 ppbw) with the SAM gas chromatograph mass spectrometer (GCMS) and detection of chlorobenzene in the direct evolved gas analysis (EGA) mode, in multiple portions of the fines from the Cumberland drill hole in the Sheepbed mudstone at Yellowknife Bay. When combined with GCMS and EGA data from multiple scooped and drilled samples, blank runs, and supporting laboratory analog studies, the elevated levels of chlorobenzene and the dichloroalkanes cannot be solely explained by instrument background sources known to be present in SAM. We conclude that these chlorinated hydrocarbons are the reaction products of Martian chlorine and organic carbon derived from Martian sources (e.g., igneous, hydrothermal, atmospheric, or biological) or exogenous sources such as meteorites, comets, or interplanetary dust particles.

Key points: First in situ evidence of nonterrestrial organics in Martian surface sediments Chlorinated hydrocarbons identified in the Sheepbed mudstone by SAM Organics preserved in sample exposed to ionizing radiation and oxidative condition.

Keywords: MSL; Mars; SAM; chlorobenzene; organic molecules; oxychlorine.


Figures

Figure 1
Figure 1
Curiosity’s route as of Sol 653, from Bradbury landing site to Pahrump Hills. The base image is from the High Resolution Imaging Science Experiment camera on Mars Reconnaissance Orbiter. Traverse map produced by Fred Calef, Jet Propulsion Laboratory-Caltech. Rocknest (RN) scooped site, John Klein (JK), Cumberland (CB), and Confidence Hills drilled sites are represented along with their respective sol of sample collection.
Figure 2
Figure 2
The three different modes of analysis of a solid sample for organic compounds by the SAM instrument.
Figure 3
Figure 3
The SAM gas flow diagram showing the helium gas flow paths in both EGA (purple dashed line) and GCMS modes (orange line). Major components shown include the quadrupole mass spectrometer (QMS), the gas chromatograph system including six columns (GCx), three injection traps (ITx), and five thermal conductivity detectors (TCDx), the tunable laser spectrometer (TLS), the gas manifolds (MNx), the microvalves (Vx) and high-conductance valves (HCx), the hydrocarbon and noble gas trap, the sample manipulation system (SMS) with two solid sample inlet tubes (SSIT-1 and SSIT-2) and two pyrolysis ovens (Oven-1 and Oven-2), the helium gas reservoirs (He-1 and He-2), pressure sensors (PMx), and miniature wide-range pumps (WRP-1 and WRP-2). The manifold and pipe heaters and associated temperature sensors are not shown.
Figure 4
Figure 4
(a) MTBSTFA, (b) chloromethanes, and (c) 1,2-DCP and chlorobenzene throughout runs that include GC cuts within the expected chlorobenzene release temperature. MTBSTFA abundance (Figure4a) is inferred from its major by-products and is calculated from EGA. MTBSTFA reduction strategies are employed on CB-5, CB-6 triple portion, and CB-6-residue. The increase in the MTBSTFA abundances in CB-6-residue is explained by the lack of combustion in the absence of O2 released from the sample. Chloromethanes (Figure4b) reflect the sum of the abundances of chloromethanes (chloromethane, dichloromethane, trichloromethane, and carbon tetrachloride) observed in GCMS after EGA temperature cut correction. 1,2-DCP abundances (Figure4c, orange) observed in GCMS. Chlorobenzene abundances (Figure4c, pink) observed in GCMS are derived from an EGA temperature cut correction using m/z 112, from the GCMS background-subtracted data.
Figure 5
Figure 5
Tenax TA by-products. 2,6-diphenyl-p-phenylene oxide (Tenax TA) and the observed degradation products from the hydrocarbon traps present in SAM.
Figure 6
Figure 6
SAM GCMS identification of chlorohydrocarbons. (a) Chlorohydrocarbons observed in GCMS in the Cumberland sample CB-3, Cumberland blank CB-Blank-1, Confidence Hills sample CH-1, and Rocknest sample RN-1. Reconstructed ion chromatograms with the following multiplication factors: m/z 52 × 2 + m/z 84 + m/z 83 × 8 + m/z 117 × 35 + m/z 63 × 8 + m/z 90 × 10 + m/z 112 × 7. 1: chloromethane, 2: dichloromethane, 3: trichloromethane, 4: carbon tetrachloride, 5: 1,2-dichloroethane, 6: 1,2-dichloropropane, 7: 1,2-dichlorobutane, and 8: chlorobenzene. The peaks at 340 and 538 s in CB are, respectively, benzene and toluene from internal background. Note that the CH experiments used another oven to heat the sample and that the RN experiments used a different GC temperature program than CB, resulting in modified retention times. (b) Mass spectra generated for the GC peaks detected in CB are shown in red and compared to those of 1,2-DCP, 1,2-dichlorobutane, and chlorobenzene from NIST Mass Spectral Database (black). The GC retention time for these compounds has been validated with high fidelity laboratory breadboards of the SAM GCMS system.
Figure 7
Figure 7
Laboratory study showing the effect of MTBSTFA on the formation of chlorobenzene. GCMS analysis of hydrocarbon trap products collected at 5°C under He flow (25 mL min−1) during pyrolysis from 45 to 850°C at 35°C min−1 of (I) 1 wt % Ca-perchlorate in fused silica with 0.4 μL MTBSTFA and 0.1 μL DMF compared to (II) 1 wt % Ca-perchlorate in fused silica with no MTBSTFA/DMF. Peaks were identified by comparison of the mass spectra to NIST. Molecules identified in the laboratory experiments and not in SAM are lettered. Numbers and letters are as follows: 3, air; 4, carbon dioxide; A, nitrous oxide; B, ethanedinitrile; 12, propene; 16, chloromethane; 15, hydrogen cyanide; C, acetaldehyde; 13, C4-alkene; 28, acetonitrile; D, methyl isocyanate; 27, acetone; 24, dichloromethane; E, nitromethane; F, C4-alkene aldehyde; G, 2-chloro-2-methylpropane; 29, trichloromethane; 31, 1- and 3-chloro-2-methyl-1-propene; 32, carbon tetrachloride; 33, benzene; H, C4-alkene nitrile; 41, N-methyl-2,2,2-trifluoroacetamide; I, N-methylformamide; J, N,N-dimethylformamide; 39, toluene; K, tetrachloroethene; 44, chlorobenzene; and 43, tert-butyldimethylsilanol. The Restek MXT-Q-Bond Porous Layer Open Tubular (PLOT) GC column (30 m length, 0.25 mm internal diameter, and 8 µm film thickness) used was held at 50°C for 4 min followed by a 10°C min−1 ramp to 250°C at a constant He flow of 1.5 mL min−1. Transfer line was set to 135°C. The quadrupole mass spectrometer operated in electron impact mode at 70 eV and scanned m/z 25–350. Inset: Selected Ion Monitoring (SIM) mode (m/z 112) on the elution zone of chlorobenzene (22–26 min).
Figure 8
Figure 8
No significant correlation between the abundance of HCl, O2, NO, or SO2 sent to the HC trap (EGA-corrected abundances) and the abundance of chlorobenzene (nonbackground-subtracted abundances) measured by GCMS. Chlorobenzene abundance (pmol) detected in GCMS versus (a) abundance of HCl sent to the hydrocarbon trap (µmol), (b) abundance of O2 sent to hydrocarbon trap (µmol), (c) abundance of NO sent to the hydrocarbon trap (nmol), and (d) abundance of SO2 sent to the trap (µmol). For the calculated abundances of chlorobenzene (C6H5Cl) in the blanks and solid sample runs, measured by GCMS, the uncertainties (δx) are based on the standard deviation of the average value of five separate hexane calibration measurements (n) made during preflight calibration of SAM with a standard error, δx = σx · (n − 1)−1/2. O2, HCl, NO, and SO2 abundances sent to the hydrocarbon trap are determined, respectively, from m/z 32, m/z 36, m/z 30, and m/z 48 measured by EGA and corrected for the temperature cut. Errors reported for the molar abundances of O2, HCl, NO, and SO2 (2σ standard deviation of the mean) also include the uncertainty in differences in ionization efficiency between masses.
Figure 9
Figure 9
Temperature releases of O2, HCl, NO, and SO2 and their relation with chlorobenzene and other aromatic-like m/z (showed in smoothed lines, shades of grey) in CB-5. The increase in chlorobenzene observed when a higher abundance of O2, HCl, and NO is sent to the HC trap (Figure8) is explained by the release of all these species in the same temperature range.
Figure 10
Figure 10
Laboratory study showing the abundance of chlorobenzene formation as a function of the initial abundance of phthalic acid (PA) pyrolyzed, in the presence of Ca-perchlorate (black circles) or Mg-perchlorate (white circles). The higher yield for chlorobenzene with Mg-perchlorate is explained by the higher abundance of HCl and O2 release from Mg-perchlorate compared to Ca-perchlorate. Reported errors are 1σ.
Figure 11
Figure 11
Laboratory study showing the comparison of some organic compounds detected from the GCMS analyses of ∼1 mg of kerogen-like organic matter isolated from the Murchison meteorite, pyrolyzed without or with 500 µg of Ca-perchlorate. Compound peak areas were measured from extracted mass chromatograms (alkylthiophenes = m/z 97, 112; alkylbenzenes and benzoic acid = m/z 105; dichloromethane = m/z 49; chlorobenzene = m/z 112; and dichloropropane, dichlorobutane*, chloropropanone*, and dichloropropanone* = m/z 63). Reported errors are 1σ. *Tentative identification.
Figure 12
Figure 12
Smoothed EGA pyrograms showing the m/z 112 (violet, top) and m/z 114 (green, bottom) signals in (a) RN-1; (b) CB-3 (plain lines) and CB-5 (dashed lines): (c) CB-6 triple portion (plain lines) and subsequent CB-6-residue reheated (dashed lines); and (d) CB-7 (plain lines), CB-Blank-2 (dashed lines), and CH-Blank (dotted lines). The m/z 112 to m/z 114 ratio of ∼4 in CB-3, CB-5, and CB-6 is similar to the NIST chlorobenzene m/z 112 to m/z 114 ratio of ∼3. The reheated CB-6-residue EGA traces show a return to background level for chlorobenzene. CB-7 shows a peak at m/z 112 but the temperature cut send to the GCMS excludes this peak. CB-Blank-2 and CH-Blank show and a return to background when no sample is pyrolyzed, after CB samples. The temperature cut sent to the hydrocarbon trap for GCMS analyses is indicated in the plot by the shaded region. The temperature cut for CH-Blank in Figure2d is not represented.
Figure 13
Figure 13
SAM EGA identification of hydrocarbons and chlorobenzene. SAM smoothed EGA data showing selected m/z values plotted in counts per second as a function of modeled sample temperature during pyrolysis over the range of 100–550°C. m/z 78 and m/z 105 were offset in the y axis to fit in the figure. The evolution of several m/z values consistent with the breakdown of aromatic hydrocarbons was observed in the 150–350°C temperature range in (c) Cumberland sample CB-5 but was not observed in precedent (a) Rocknest sample RN-1, (b) Cumberland blank CB-Blank-1, or (d) in subsequent Confidence Hills CH-blank. The temperature cuts sent to the hydrocarbon trap for GCMS analyses are indicated by the shaded zones.
Figure 14
Figure 14
(a) Laboratory study showing the total ion chromatogram resulting from the pyrolysis of Ca-perchlorate in the presence of propane gas. The main compounds detected after the reaction of propane gas with Ca-perchlorate decomposition products are propane (peak 1) and 1,2-DCP (peak 2). 1,2-DCP is identified based on comparison of (b) the mass spectra for peak 2 with (c) the known mass spectra for 1,2-DCP based on a NIST library search.

References

    1. Anderson MS, Katz I, Petkov M, Blakkolb B, Mennella J, D’Agostino S, Crisp J, Evans J, Feldman J. Limonadi D. In situ cleaning of instruments for the sensitive detection of organics on Mars. Rev. Sci. Instrum. 2012;83(10) doi: 10.1063/1061.4757861. - DOI - PubMed
    1. Archer PD, et al. Abundances and implications of volatile-bearing species from Evolved Gas Analysis of the Rocknest aeolian deposit, Gale Crater, Mars. J. Geophys. Res. Planets. 2014;119:237–254. doi: 10.1002/2013JE004493. - DOI
    1. Benner SA, Devine KG, Matveeva LN. Powell DH. The missing organic molecules on Mars. Proc. Natl. Acad. Sci. U.S.A. 2000;97(6):2425–2430. - PMC - PubMed
    1. Biemann K. Bada JL. Comment on “Reanalysis of the Viking results suggests perchlorate and organics at midlatitudes on Mars” by Rafael Navarro-Gonzalez et al. J. Geophys. Res. 2011;116 E12001, doi: 10.1029/2011JE003869. - DOI
    1. Biemann K, et al. Search for organic and volatile inorganic-compounds in 2 surface samples from Chryse-Planitia Region of Mars. Science. 1976;194(4260):72–76. - PubMed